Institutional Shareholder Services (ISS) recently issued policy updates for 2021. Additionally, in October ISS issued Frequently Asked Questions (FAQs) related to COVID-19 pay decisions. This article summarizes both the compensation-related policy updates and the FAQs related to COVID-19, and highlights other key changes to ISS’s policies. ISS will publish all updated proxy voting guidelines for 2021 by late November/early December.
2021 Policy Updates
The two compensation-related policy updates cover ISS voting recommendations on shareholder proposals relating to Gender, Race/Ethnicity Pay Gaps and Board Independence – Classification of Directors.
Gender, Race/Ethnicity Pay Gaps: ISS will vote case-by-case on requests for reports on a company’s pay data by gender or race/ethnicity, or a report on a company’s policies and goals to reduce any gender or race/ethnicity pay gaps, taking into account:
- The company’s current policies and disclosure related to both its diversity and inclusion policies and practices and its compensation philosophy on fair and equitable compensation practices;
- Whether the company has been the subject of recent controversy, litigation, or regulatory actions related to gender, race, or ethnicity pay gap issues;
- The company’s disclosure regarding gender, race, or ethnicity pay gap policies or initiatives compared to its industry peers; and
- Local laws regarding categorization of race and/or ethnicity and definitions of ethnic and/or racial minorities.
ISS updated the policy language to clarify how it evaluates a company’s policies and practices compared to its peers. ISS also highlights that some legal jurisdictions do not allow companies to categorize employees by race and/or ethnicity and that definitions of ethnic and/or racial minorities differ from country to country, so a global racial and/or ethnicity statistic would not necessarily be meaningful or possible to provide.
Board Independence – Classification of Directors: ISS will not consider a non-employee director as independent if the individual’s pay is comparable to Named Executive Officers’ (NEOs’) pay for multiple years. While ISS has reviewed non-employee director pay vs. NEO pay as a historical practice, this factor is now being made explicit with this policy update.
Other notable ISS updates are summarized below:
Director Elections: Racial/Ethnic Board Diversity (applies to Russell 3000 and S&P 1500 Indexes): Beginning in 2022, ISS will adopt a new voting policy with respect to U.S. boards that lack racial and ethnic diversity. During a one-year transition period beginning in 2021, ISS will highlight in a company’s proxy research report the lack of racial and ethnic diversity (or lack of disclosure of such) on its board. The purpose is to help investors identify companies they may wish to engage and foster dialogue with on this topic.
In 2022, for companies in the Russell 3000 or S&P 1500 indexes where the board has no racially or ethnically diverse members, ISS will recommend voting against or withhold from the chair of the nominating committee (or other directors on a case-by-case basis). Companies that provide aggregated diversity statistics for board members will only be considered if the breakout is specific to racial and/or ethnic diversity. ISS will allow an exception if there was racial and/or ethnic diversity on the board at the preceding annual meeting and the board makes a firm commitment to appoint at least one racial and/or ethnically diverse member within a year.
ISS Discontinues S&P 500 Proxy Report Draft Review Process: Effective for shareholder meetings held on or after January 1, 2021, ISS will no longer provide U.S.-based S&P 500 companies the opportunity to review draft proxy research reports prior to publication. ISS does not believe the additional review process is necessary as ISS supports the accuracy of its data and the quality-control process. With the elimination of the review process, ISS states that institutional clients will be able to engage with companies sooner, as reports will be filed earlier.
In order to comply with the Securities and Exchange Commission (SEC) regulations passed in July regarding proxy advisor recommendations, ISS notes that companies will receive a complimentary copy of the ISS report upon publication and be able to respond with comments and corrections.
FAQs for COVID-Related Pay Decisions
ISS released the October FAQs to help public companies think through incentive plan changes related to COVID-19. Consistent with its April 2020 policy guidance, ISS’s October FAQs emphasize the importance of clear and adequate disclosures.
ISS will continue to use quantitative screens as a first look at incentive plans at publicly traded companies. The quantitative screens will not be modified to address the impact of the pandemic. Instead, ISS notes that it will continue to use the quantitative screens to identify elevated concerns that warrant more in-depth qualitative reviews of compensation programs and practices. The qualitative evaluation is where ISS considers the impact of COVID-19.

Temporary Salary Reductions: In spring 2020, many companies impacted by COVID-19 reduced executive and employee salaries. The recent ISS FAQs note that salaries are a small portion of total pay for executives. As a result, the impact of salary cuts will be given mitigating weight to the extent they decrease total executive pay. Accordingly, salary reductions will be considered more meaningful if they flow through to targeted incentive opportunities.
COVID-Related Changes to Incentives: Most of the FAQs address the impact of COVID-19 on executive incentives. Overall, the FAQs emphasize the need for clear disclosures that provide the justification and rationale for each decision, and that demonstrate the reasonableness of the resulting incentive outcomes. The following table summarizes the FAQs addressing incentives:
| Bonus / Annual Incentives | |
| What Companies Should Disclose: |
|
| If Financial or Operational Targets are Lowered Below Prior-Year Performance Levels: |
|
| Long-Term Incentives | |
| In-Progress Cycles: |
|
| Go-Forward Cycles (awards granted in most recent year): |
|
| Retention or Other One-Time Awards | |
| What Companies Should Disclose: |
|
| Awards in the Context of Forfeited Incentives: |
|
Responsiveness Policy: In addition to the guidance on incentives, ISS released information about its responsiveness policy in light of COVID-19. When a company receives less than 70 percent support on a say-on-pay proposal, ISS’s responsiveness policy reviews three factors:
- The disclosure of the board’s shareholder engagement efforts;
- The disclosure of the specific feedback received from dissenting investors; and
- Any actions or changes made to pay programs and practices to address investors’ concerns.
The guidance notes that the expectations regarding the first two factors will remain consistent with prior years. With respect to the third factor, if a company is unable to implement changes due to the pandemic, the proxy statement should disclose specifically how the pandemic has impeded the company’s ability to address shareholders’ concerns. If pay program changes are delayed, or do not fully address shareholder feedback, the company should disclose a longer-term plan on how it intends to address investors’ concerns.
Equity Plan Scorecard (EPSC), Problematic Pay Practices (PPP), or Option Repricing: Lastly, the FAQs address ISS’s EPSC, PPP, and option-repricing policies in light of COVID-19. No changes were made to these policies specifically because of the pandemic. However, ISS noted 2021 passing scores for EPSC:
- S&P 500 Model: 57 points (from 55)
- Russell 3000 Model: 55 points (from 53)
- All Other Models: 53 points (unchanged)
The PPP policies flag problematic contractual provisions in executive agreements. ISS policies on option repricing programs take a case-by-case approach but generally oppose repricings that occur within one year of a significant stock price drop. Companies that reprice options without seeking shareholder approval are reminded in the FAQs that they may receive unfavorable recommendations under ISS’s U.S. policies on board accountability.
Key Upcoming Dates
Late November 2020: Publication of all updated ISS benchmark policies (proxy voting guidelines) for 2021.
December 2020: Publication of updated FAQ documents.
January 2021: ISS will evaluate new U.S. shareholder proposals anticipated for 2021 and update its Proxy Voting Guidelines as needed.
February 1, 2021: Updated 2021 ISS benchmark policies will take effect for meetings occurring on or after this date.
This article highlights changes to ISS policies and is not intended to be exhaustive. For information related to ISS‘s voting policies, please visit:
More than six months have passed since the COVID-19 pandemic began. In February, American businesses were hit hard by shutdowns, shifting demand, operational disruptions, and significant new challenges for employee health and safety. Many S&P Composite 1500 companies responded with changes to their compensation programs for executives and employees. Initial pay actions in March, April and May focused on conserving cash, mainly through salary cuts. Over the summer, companies adapted, and pay actions began to focus on annual and long-term incentive plans.
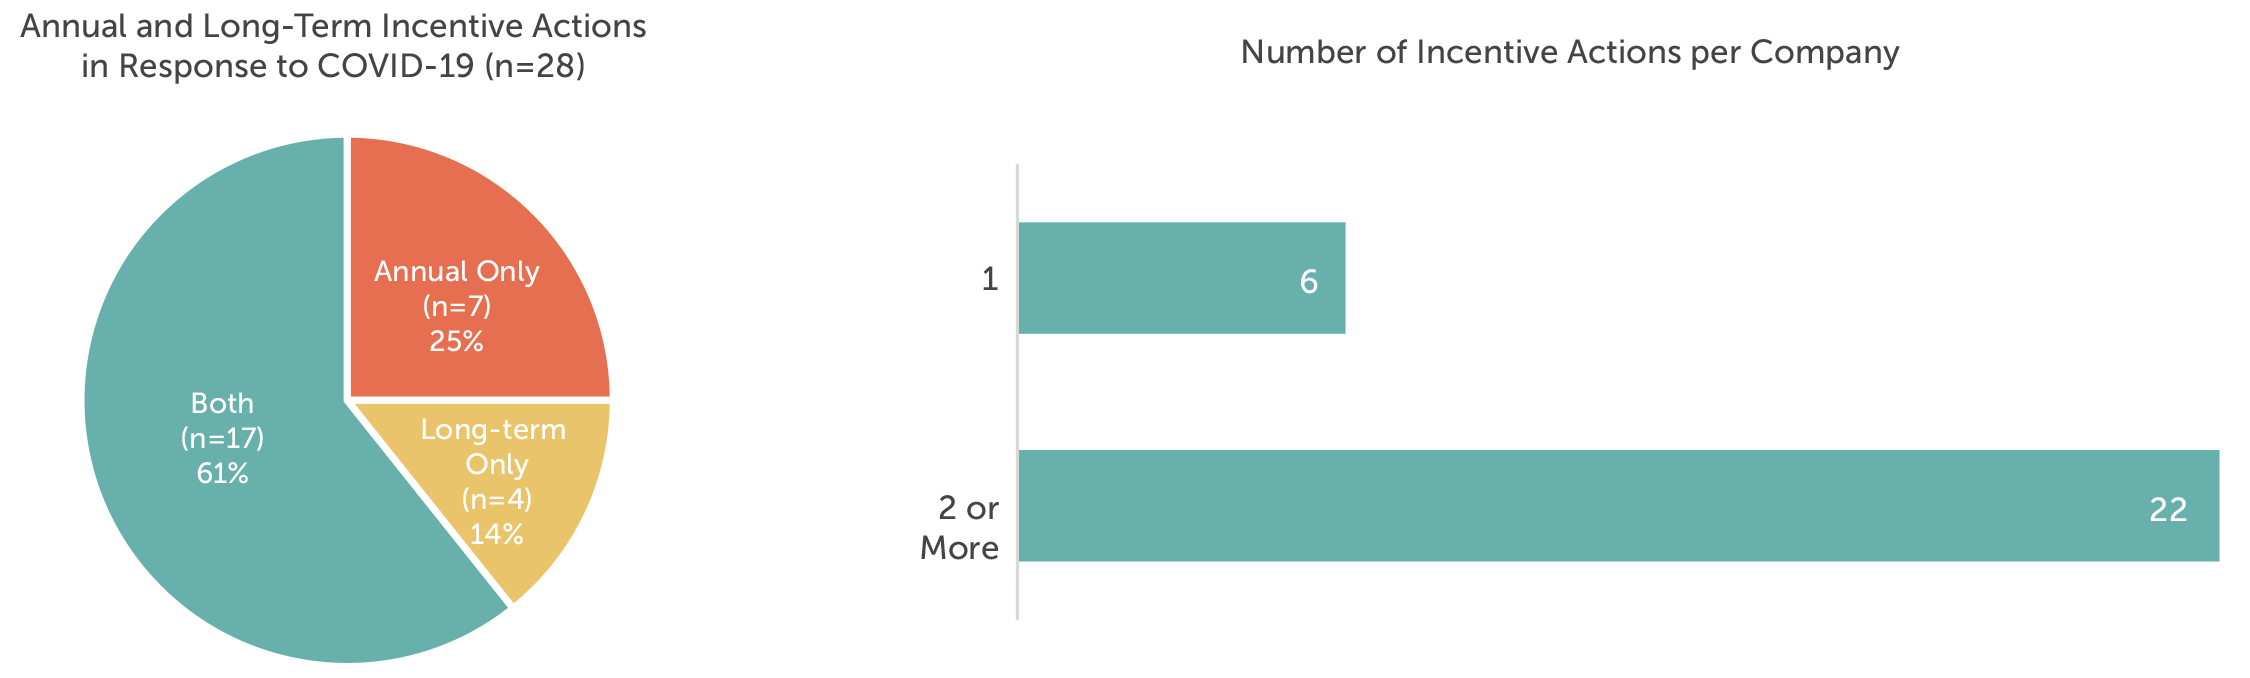
Public filings in September and October offered the first detailed look at how U.S. public companies adjusted their executive compensation plans in response to COVID-19. Public companies with fiscal year ends (FYEs) on or near June 30 recently filed their proxy statements, which included robust discussions of the impact of COVID-19 on 2020 executive compensation decisions and plans for 2021. Of the S&P Composite 1500 companies – which Compensation Advisory Partners (CAP) has been closely tracking – 65 companies with FYEs between May 30 and July 3 filed their annual proxy statements by October 7. Of the 65 companies, 28 – or 43 percent – announced changes to their outstanding and go-forward incentive plans because of COVID-19. Approximately 60 percent of the 28 companies had responded at the start of the pandemic with immediate human capital actions, including temporary reductions to executive base salaries, and adverse broad-based employee actions.
It is too early to say whether actions taken by the June FYE companies are indicative of trends we will see when most companies file their proxy statements in the spring of 2021. From an industry-sector standpoint, the June FYE companies show significant representation from Information Technology (28%), Industrials (15%), and Consumer Staples (15%). While not a completely representative sample, this group of companies still provides an interesting early look at executive compensation responses to COVID-19 beyond annual pay reductions.
The majority of the 28 companies that reported COVID-19-related pay actions adjusted both their annual and long-term incentive plans. About 85 percent of the companies made changes to their annual incentive plans, and 75 percent made changes to long-term incentives. Twenty-two of the companies took more than one incentive action.
Annual Incentives
Of the 28 companies, 24 made changes to their outstanding and/or go-forward annual incentive plans. The most common changes were modifying the performance period, exercising discretion to determine award amounts, revising the payout scale, delaying goal-setting and adding or changing performance metrics.

Prevalent annual incentive actions are discussed below.
Adjusted Performance Period
Several June FYE companies adjusted the performance period for an outstanding plan. For these companies, COVID-19 only impacted fourth-quarter results, so most of their 2020 fiscal years were business as usual. In go-forward plans, shorter performance periods are intended to focus executives and employees on immediate priorities, and to recognize that goal-setting will be difficult because of COVID-19.
|
Action |
# of Companies |
|
Outstanding Plan |
|
|
Shortened the performance period to exclude the pandemic. |
9 |
|
Go-Forward Plan |
|
|
Bifurcated annual performance periods. |
2 |
|
Set quarterly goals. |
2 |
Use of Discretion
Eight companies applied discretion to outstanding incentive awards. The disclosed rationale for the use of upward discretion was to recognize the extraordinary efforts of executives and employees who contributed to companies’ COVID-19 responses, and to recognize performance before COVID-19 hit.
|
Action |
# of Companies |
|
Outstanding Plan |
|
|
Applied discretion to increase annual incentive funding and awards. |
7 |
|
Used downward discretion to reflect the negative impact of COVID-19. |
1 |
Revised Payout Scale
Revisions to payout scales for outstanding awards were made primarily to prorate awards in conjunction with adjusted performance periods, as discussed in “Adjusted Performance Period.” Payout scales were revised in go-forward plans for a number of reasons: to widen the performance curve to reflect the difficulty with goal-setting, to reduce maximum payouts for cost containment, and to implement a payout floor and increase the award maximums to incentivize superior performance.
|
Action |
# of Companies |
|
Outstanding Plan |
|
|
Revised payout scales in conjunction with shortening performance periods to remove the impact of COVID-19. The payouts were prorated based on how much the performance periods were shortened. |
3 |
|
Go-Forward Plan |
|
|
Widened performance curves. |
1 |
|
Reduced maximum annual incentive award to be 150 percent of target, down from 200 percent of target. |
1 |
|
Added a payout floor, increased maximum payout, and adjusted corporate and business unit award multipliers. |
1 |
Delayed Goal-Setting
Six companies delayed goal-setting for go-forward plans. The rationale is to allow time for more information to predict financial performance.
|
Action |
# of Companies |
|
Go-Forward Plan |
|
|
Delayed goal-setting in conjunction with breaking performance periods into smaller units. |
3 |
|
Delayed goal-setting to have more accurate information for forecasting. |
3 |
Added/Changed Metrics
Several June FYE companies changed performance metrics for their annual incentive plans to move away from financial measures. The shift to operational measures illustrates that companies are opting to focus executives and employees on drivers of financial performance, which may provide clearer line of sight or may be easier to forecast in unpredictable times. Similarly, the shift to strategic and individual metrics may allow for more discretion in payout determination and recognizes the importance of non-financial goals at this time.
|
Action |
# of Companies |
|
Outstanding Plan |
|
|
Changed metrics for outstanding awards to focus on near-term priorities, and company health and well-being. |
1 |
|
Go-Forward Plan |
|
|
Adjusted annual performance metrics, including shifting to operational, strategic, and individual performance. |
4 |
Long-Term Incentives
Of the 28 companies, 21 made changes to their outstanding and/or go-forward long-term incentive plans. All but four of the companies that adjusted long-term incentives also adjusted annual incentive plans. The most common changes were modifying the performance period, revising the payout scale, changing the long-term incentive vehicle mix, changing metrics for performance awards, and delaying goal-setting.

Modified the Performance Period
As with annual incentive plans, modifying the performance period was the most prevalent long-term incentive plan change. CAP predicts goal-setting will remain as a key challenge for incentive plan design for 2021 and beyond. The COVID-19 pandemic hurt many companies and helped others (e.g., consumer staples), resulting in highly unusual results for 2020. To address future uncertainty during goal-setting, breaking performance periods into smaller periods may become more common until economic conditions stabilize.
|
Action |
# of Companies |
|
Outstanding Plan |
|
|
Modified the performance period for outstanding awards, including omitting the quarter negatively impacted by COVID-19. With that change, some companies also prorated the award amounts commensurately. |
7 |
|
Go-Forward Plan |
|
|
Divided the award period into shorter periods for purposes of goal-setting and award calculation. |
3 |
|
Shortened the three-year performance period to two years. |
1 |
|
Changed the goal-setting approach to include a cumulative goal. |
1 |
Revised the Payout Scale
Revisions to past payout opportunities and maximums were made to prorate awards in conjunction with shortened performance periods, or to cap the payout and conserve cash.
|
Action |
# of Companies |
|
Outstanding Plan |
|
|
Decreased the payout scale for outstanding awards in conjunction with omitting quarters negatively impacted by COVID-19. Prorated the awards commensurately (e.g., if performance were measured over 11 quarters instead of 12, the award would be prorated by 11/12). |
4 |
|
Revised award payouts to the maximum based on performance in quarters not negatively impacted by COVID-19. |
1 |
|
Capped the maximum payout at target. |
1 |
|
Go-Forward Plan |
|
|
Awarded grants at target regardless of performance. |
1 |
|
Increased maximum payout. |
1 |
Changed Long-Term Incentive Vehicles
Ten companies adjusted the long-term incentive mix for upcoming awards. The most common change was to add time-vested vehicles or to increase the percentage of time-vested vehicles overall to increase retention and recognize the difficulties of goal-setting during the pandemic.
|
Action |
# of Companies |
|
Go-Forward Plan |
|
|
Added time-vesting vehicles or increased the percentage of time-vested vehicles in the overall mix. |
6 |
|
Added stock options to the 2021 fiscal year grant. |
2 |
|
Eliminated stock options. |
2 |
|
Not granting equity. |
2 |
Note: Two companies took multiple actions.
Changed Performance Plan Metrics
Given the impact of COVID-19 on U.S. companies, changing performance measures to reflect new business realities has not been a surprising development. Five companies with June FYEs adjusted their long-term performance measures. CAP expects to see more changes in performance measures in go-forward performance plans as companies file proxy statements.
|
Action |
# of Companies |
|
Go-Forward Plan |
|
|
Adopted relative performance measures, which mitigate the risk of goals being missed because of market events beyond management’s control. |
2 |
|
Added strategic metrics to focus management on COVID-related priorities. |
2 |
|
Eliminated a more complicated return measure to focus on revenue and profitability. |
1 |
Delayed Goal-Setting
Five companies delayed goal-setting for future awards. Delaying annual grants or choosing to set targets in the second quarter could provide companies with flexibility to set more accurate and realistic performance goals.
|
Action |
# of Companies |
|
Go-Forward Plan |
|
|
Made annual grants but delaying goal-setting under the grants until there is more predictability surrounding COVID-19 and its impact. |
3 |
|
Delayed making annual grants. |
2 |
Special Awards
Four companies with June FYEs provided special awards to executives. FedEx and Nike made special awards to replace annual and long-term incentive awards that were not paid because of COVID-19. Tapestry and Herman Miller provided special grants to incentivize executive performance. CAP expects to see more special awards in the future.
|
Company |
Revenue ($M) |
Position |
Grant Date |
Award Value ($000s) |
Award Type* |
Vesting |
|
FedEx Corporation |
$71,490 |
CEO |
06/15/2020 |
$14,160 |
SOs |
Ratable 4-year |
|
COO |
$3,981 |
|||||
|
NIKE, Inc. |
$37,337 |
CEO |
06/01/2020 |
$6,750 |
Cash |
Immediate |
|
Other NEOs |
$2,533 (avg.) |
|||||
|
Tapestry, Inc. |
$4,961 |
All NEOs |
08/17/2020 |
$200 – $500 |
PSUs |
Cliff 2-year |
|
Herman Miller |
$2,487 |
Leadership, including NEOs |
07/14/2020 |
Not disclosed |
Premium SOs |
Ratable 3-year |
* SOs are stock options; PSUs are performance share units.
Looking Ahead
CAP expects companies to make increasingly more changes to their executive compensation programs to address the impact of COVID-19, market volatility and the challenges of credible long-term forecasting.
Annual Incentive Plans
- Use of informed or structured discretion to determine payouts.
- New or increased weighting on operational, strategic, and individual performance metrics. These may be incorporated as environmental, social and governance (ESG) metrics, which provide a more holistic view of business performance and consider different stakeholders.
- Use of wider performance scales around target goals, which may lead to less volatility in payouts.
- Delay of goal-setting to improve accuracy.
- Use of shorter performance periods to address goal-setting difficulties.
Long-Term Incentive Plans
- Increased use of time-based restricted stock/units for retention. CAP still expects at least 50% of long-term incentives to be performance-based, given the long-standing expectations of proxy advisors and major investors.
- Companies may exclude the chief executive officer or named executive officers from the shift to time-based equity.
- Use of relative performance measures (primarily total shareholder return), or an increase in the weight of relative measures.
- Delay of goal-setting to improve accuracy.
- Use of shorter periods for performance-based long-term incentives to lower the risk of the overall incentive program.
The COVID-19 pandemic dealt an unexpected blow that pushed a number of companies into bankruptcy. The impact of pandemic-related shutdowns was broad: Companies in a diverse range of industries – including retail, oil and gas, consumer goods, restaurants, and entertainment and recreation – filed for Chapter 11 bankruptcy protection in the first half of 2020. While the number of filings has not yet reached the level seen in the 2008 financial crisis, the number of bankruptcies is expected to rise through the remainder of the year.
The 2020 surge in bankruptcies has been accompanied by heightened scrutiny of executive pay in restructuring situations. Bankruptcy filings are often preceded by announcements of executive retention and other short-term performance-based awards. These awards can draw criticism as excessive and even inappropriate given the impact of bankruptcy on shareholders and the broader employee population. However, 2020 is unique. While situations vary by industry, most agree that this flurry of bankruptcy filings is not the result of poor management but rather the inevitable impact of unprecedented and unforeseeable broad shutdowns across the country to contain the pandemic. The companies entering bankruptcy need continuity, stability, and motivated leadership. Carefully designed and communicated retention and performance awards can play an important role in keeping leadership in place and focused on moving the company through the restructuring process.
The Evolution of Prepaid Awards
Corporate bankruptcies cause a significant amount of uncertainty for executives and employees, who can be tempted to leave for more stable work situations with predictable, secure compensation streams. Poor company performance means that annual incentives are unlikely to pay out, and equity holdings lose almost all value. In situations where shareholders need to retain executives through the bankruptcy period, cash retention awards to critical members of management can be effective by providing compensation stability. These programs are often called Key Executive Retention Programs (KERPs).
Executive retention awards in bankruptcy situations today have a unique design: they are paid before the bankruptcy filing and are subject to clawback provisions. Clawback provisions are triggered if the executive terminates employment during a specified time period or is terminated for cause. In addition, some clawbacks are tied to performance goals not being achieved. If triggered, the clawback provisions require executives to pay back the after-tax award value. The fact that the awards are prepaid differentiates them from most other cash incentives and makes them the subject of criticism and misunderstanding.
The Evolution of Prepaid Executive Retention Awards in Bankruptcies
The unique design for executive retention awards emerged from changes to the U.S. bankruptcy code made through the Bankruptcy Abuse Prevention and Consumer Protection Act of 2005 (BAPCPA). Prior to BAPCPA, a large portion of executive compensation in bankruptcy situations was delivered through retention awards. Executive retention awards were typically paid out in a lump sum or through several payments based on the executive’s continued employment. Executive retention awards also had special status in the bankruptcy proceedings that ensured payment ahead of many other company obligations. As a result of the special status and lack of performance features, executive retention awards were not viewed favorably.
BAPCPA imposed stringent restrictions on awards to “insiders” implemented during the bankruptcy process that are based solely on retention and that lack performance features (“Insiders” are defined as directors, officers, individuals in control of the corporation, and relatives of such individuals). BAPCPA’s restrictions effectively stopped the use of executive retention awards once companies file for bankruptcy. Despite BAPCPA, executive retention awards eventually re-emerged – as prepaid awards subject to clawbacks. By paying the awards before the bankruptcy filing, companies can generally avoid the BAPCPA restrictions and avoid having the award subject to Bankruptcy Court approval.
Prevalent Executive and Employee Pay Practices during Bankruptcy
CAP analyzed the 8-K filings of a number of companies that entered bankruptcy in 2020. Based on this analysis, companies today often use a mix of compensation programs to retain and motivate executives and employees leading up to, and during, the bankruptcy process:
- Pre-filing, prepaid executive retention awards
- Performance-based Key Employee Incentive Plans (KEIPs)
- Employee retention and incentive programs
Pre-Filing, Prepaid Executive Retention Awards
A number of companies that filed for bankruptcy during 2020 announced prepaid retention awards for executives anywhere from days to months before the legal filing. The 8-K filings indicate that the prepaid retention awards are designed by the board with advice from compensation consultants, as well as bankruptcy and other advisors. Typical design parameters for executive retention bonus awards include:
|
Participation: |
CEO, other key executives and officers |
|
Objectives: |
Retain key employees before and during the bankruptcy proceedings |
|
Award Value: |
|
|
Form of Payment and Timing: |
Awards are made in cash, prepaid in a lump sum prior to the bankruptcy filing |
|
Clawback Provisions: |
Executives must repay the awards, net of taxes, if they 1) Terminate employment prior to the earlier of a specified period or the conclusion of the bankruptcy period, or 2) Are terminated by the company for cause |
|
Clawback Period: |
Most often one year |
While less common, some companies, including Chesapeake Energy and Ascena Retail Group, include base-level performance criteria in the clawback provisions to add a performance element to the prepaid retention awards. This improves the overall optics of such awards and helps avoid additional scrutiny during bankruptcy.
|
Select Pre-Filing Retention and Incentive Programs |
||||||
|
Company |
Revenue FY2019 ($000s) |
Industry |
Bankruptcy Date |
Program |
Award Term |
Description |
|
J.C. Penney |
$12,019 |
Retailing |
5/15/2020 |
Retention & Incentive |
0.6Y |
Adopted a prepaid cash compensation program equal to a portion of NEO annual target variable compensation; NEO awards ranged from $1M to $4.5M; clawbacks are tied 80% to continued employment through January 31, 2021, and 20% to milestone-based performance goals |
|
Retention |
1.6Y |
Accelerated the earned 2019 portion of three-year long-term incentive awards ($2.4M for NEOs); clawbacks are tied to continued employment through January 31, 2022 |
||||
|
Hertz Global Holdings |
$9,779 |
Transportation |
5/22/2020 |
Retention |
0.8Y |
Cash retention payments to 340 key employees at the director level and above ($16.2M in aggregate); NEO awards ranged from $190K to $700K; clawbacks tied to continued employment through March 31, 2021 |
|
Chesapeake Energy |
$8,408 |
Energy |
6/28/2020 |
Retention & Incentive |
1.0Y |
Executives: Prepaid 100% of NEO and designated VP target variable compensation ($25M in aggregate for 27 executives) based 50% on continued employment and 50% on the achievement of specified incentive metrics Employees (retention only): Converted annual incentive plan into a 12-month cash retention plan paid quarterly, subject to continued employment |
|
Ascena Retail Group |
$5,493 |
Retailing |
7/23/2020 |
Retention & Incentive |
0.5Y |
Executive and Employee Retention and Performance Awards: Six-month cash award for NEOs (NEO awards ranged from $600K to $1.1M), 3 other executives, and employees who are eligible for the company’s incentive programs based 50% on continued employment through Q4 2020 and 50% on performance; award amounts are based on a percentage of annual and long-term incentive targets Earned Performance-Based LTIP Awards: Accelerated earned 2018 and 2019 performance-based cash awards for all employees ($1.1M for 2 NEOs), subject to continued employment through August 1, 2020 for the 2018 award and August 3, 2021 for the 2019 award |
|
Whiting Petroleum |
$1,572 |
Energy |
4/1/2020 |
Retention |
1.0Y or Chapter 11 Exit |
NEO awards were prepaid and ranged from $1.1M-$6.4M; clawbacks are based on termination of employment before the earlier of March 30, 2021, or Chapter 11 exit; employees receive quarterly cash awards that in aggregate may not exceed that employee’s target annual and long-term incentive compensation |
|
GNC Holdings |
$1,446 |
Food, Beverage and Tobacco |
6/23/2020 |
Retention |
1.0Y |
Cash exit incentive awards for key employees (including executives) based 75% on the Company’s exit from bankruptcy and 25% on the 60th day following an emergence event that occurs on or prior to June 23, 2021. Prepaid NEO awards ranged from $300K to $2.2M |
|
Diamond Offshore Drilling |
$935 |
Energy |
4/26/2020 |
Retention |
1.0Y |
Past Executive Long-Term Cash Incentives: Payment of a portion of past three-year cash incentive awards was accelerated for retention; awards are subject to clawbacks based on termination of employment for one year; NEO payouts ranged from $140,208 to $1.75 million. Other Plans: The Company announced a Key Employee Incentive Plan, a Non-Executive Incentive Plan and a Key Employee Retention Plan, which are all subject to approval by the Bankruptcy Court |
Performance-Based Key Employee Incentive Plans (KEIPs)
After BAPCPA, KEIPs emerged to provide incentives to executives without running afoul of the bankruptcy code. KEIPs, which are approved during the bankruptcy process, are performance-based incentives that pay out in cash based on the achievement of financial and operational goals. The goals can be very short-term in nature, such as quarterly performance periods.
Typical design parameters for KEIPs include:
|
Participation: |
CEO, other key executives and officers (ultimately those designated as “insiders” in the bankruptcy proceeding) |
|
Objectives: |
Incentivize key executives before, but primarily during, the bankruptcy proceedings |
|
Award Value: |
|
|
Form of Payment and Timing: |
|
A current trend is to design and implement the KEIP prior to filing. This is especially true in pre-packaged bankruptcies where the financial reorganization of the company is prepared in advance in cooperation with its creditors. Having these programs in place with payouts contingent on performance improves continuity throughout the entire process, incentivizes the management team to perform, and meets the court’s requirement that any variable compensation to executives be performance based.
One recent example of a company announcing a KEIP before the bankruptcy filing is Diamond Offshore Drilling. The company announced a prepaid retention program for executives, as well as a KEIP, a non-executive incentive plan and an additional retention plan. All plans except for the prepaid executive retention program are subject to Bankruptcy Court approval, according to the 8-K. The KEIP, nonexecutive incentive plan and the additional retention plan replace past incentives – including requiring the forfeiture of past restricted stock unit awards and stock appreciation rights – and current incentives that would have been granted in 2020. The KEIP includes nine participants, including the senior executive team.
Employee Retention and Incentive Programs
Retention and incentive programs for employees are also used during the bankruptcy process. The use of employee programs depends on the company’s business needs and other factors, such as size and industry. Retention and incentive programs for non-executives typically replace the value of annual incentives and sometimes long-term incentives. Employee retention programs are cash-based and pay out at specific intervals, often quarterly given the uncertainties associated with companies in restructuring situations. The duration of employee retention programs often mirrors those for executives.
Severance programs, which provide compensation to individuals at termination, are also used in bankruptcy situations. When communicated broadly during bankruptcy, severance can be considered a retention program as it helps employees have some financial security and focus on their current jobs rather than finding new positions. Severance programs tend to be used more commonly for employees than executives because BAPCPA limits the value that can be delivered to “insiders.” However, a recent example of a severance program for executives came from Hertz Global Holdings, which announced amendments to its executive severance programs prior to its bankruptcy filing in May 2020. The severance programs, which were disclosed in the same 8-K filing as a prepaid key employee retention program, cover senior executives and vice presidents, and the payment multiple was reduced to 1X salary and bonus from 1.5X.
Conclusion
Executive compensation programs implemented in conjunction with a bankruptcy should be carefully designed and reviewed with outside advisors to ensure that the company is complying with bankruptcy code. Companies should carefully review the value of executive awards to ensure that they are reasonable while also in line with competitive practices and past incentive opportunities. Executive award amounts should be considered in the context of employee awards and the company’s overall financial situation to ensure fairness and avoid the appearance of excess. Lastly, companies should carefully communicate the rationale for executive awards and what the company is doing for employees in the 8-K current report or other announcement. Clear communication up front can help head off later public relations and optics headaches.
Compensation Advisory Partners (CAP) examined 2019 CEO compensation levels and pay and governance practices among 40 companies in the regional bank industry. The banks were stratified into three groups based on FY’19 asset size: $1B – $5B in assets (“small banks”; n=13), $5B – $10B in assets (“medium banks”; n=13) and $10B – $20B in assets (“large banks”; n=14). This report discusses both the similarities and differences in compensation levels, incentive plan design and governance practices between the three groups. We also highlight current issues facing the banking industry in 2020 and as we head into 2021.
Highlights
- Total Pay Mix: As banks increase in size, a higher percentage of CEO total pay shifts from fixed compensation to at-risk or variable compensation
- 2019 Financial Performance: Banks performed well in 2019 resulting in annual incentive payouts around target for all three groups; however, CEO annual incentives were lower than in 2018 as 2019 financial performance lagged 2018 growth levels
- Annual Incentive Plan Metrics: For all banks, the most prevalent metrics generally include Efficiency Ratio, Asset Quality, Return on Assets (ROA), Earnings Per Share (EPS), Return on Equity (ROE), and Net Income with smaller banks also factoring in Loan and Deposit levels more frequently
- Long-Term Incentive Plan Metrics: For all banks, relative Total Shareholder Return (TSR), EPS, ROA and ROE are frequently used together. Medium and large banks are more likely to measure performance on both an absolute and relative basis
- Stock Ownership Guidelines: All large banks have policies in place for executives compared to less than three-fourths of small and medium banks
- Clawback Policy: Across all banks in our study, over 80 percent have a policy that extends beyond Sarbanes-Oxley requirements. More of the large banks have a policy in place compared to the small and medium banks
- Looking Ahead: The impact of COVID-19 on incentive plans and the 2020 presidential election is creating a lot of uncertainty as banks close out 2020 and prepare for 2021. Additionally, diversity and inclusion will continue to gain attention and is a topic increasingly discussed at the Compensation Committee and Board level
Chief Executive Officer (CEO) Actual Pay Levels and Mix
Similar to our findings in prior year studies, CEOs at the larger banks have higher pay levels and more of their total pay delivered in at-risk or variable compensation, such as annual or long-term incentives. Conversely, executives at smaller banks are often paid more fixed compensation or base salary. For banks, asset size is a strong indicator of complexity as larger banks have more branches, products, and services offerings, corresponding to greater challenges and risks for management.

Specifically, 52 percent of compensation was fixed at the small banks compared to 43 and 32 percent at the medium and large banks, respectively. Larger banks also grant more compensation in the form of equity, which is tied to either multi-year vesting and/or performance criteria. These equity grants make up 32 percent of medium bank pay for CEOs and 40 percent at the large banks in the sample. By comparison, small banks only grant 21 percent of their compensation in these long-term equity vehicles.
2019 Performance and Pay Outcomes
Performance Results
Financial performance showed strong growth in 2019. Comparing 2018 to 2019, 2018 was a better year for the banks, which can be attributed, in part, to three interest rate cuts in 2019 (first rate cuts since 2008), creating pressure on net interest margins. Small banks had the strongest performance year among the three groups in 2019 with the majority performing in line with analyst expectations. Large banks had the weakest performance year among the three groups as more than half of the large banks underperformed against analyst expectations. ROE increased for only the small banks and one-year TSR was strong for all groups, significantly outpacing 1-year 2018 TSR. Strong 2019 TSR was consistent with the upward TSR trend seen in the overall market and super regional and Wall Street banks.
|
Metric |
Median Percent Change Year Ended December 31, 2019 |
||
|
Asset Size |
|||
|
$1B – $5B |
$5B – $10B |
$10B – $20B |
|
|
EPS |
+15.1% |
+7.8% |
+4.6% |
|
Net Income |
+16.6% |
+11.6% |
+5.9% |
|
Pre-tax Operating Income |
+16.9% |
+10.5% |
+10.0% |
|
Return on Equity |
+28 bps |
-3 bps |
-81 bps |
|
1-Year TSR at 12/31/19 |
+27.4% |
+24.9% |
+24.7% |
|
1-Year TSR at 12/31/18 |
-10.5% |
-16.4% |
-16.4% |
bps – Basis points
Source: S&P Capital IQ Financial Database
CEO Annual Incentive Payouts
Overall, the small banks had the strongest year of the three groups in 2019 based on the financials reviewed. This performance was ultimately rewarded by annual incentive plans, as seen in CEO annual incentive payouts. Small banks had the highest annual incentive payouts as a percentage of target, 109 percent, and only four banks in the small bank group paid annual incentives at or below target, compared to seven banks each in the medium and large bank sample. Annual incentive payouts across all groups declined from 2018 levels, where all three groups generally paid out above target.
|
CEO Payout as % of Target |
Asset Size |
||
|
Summary Statistics |
$1B – $5B |
$5B – $10B |
$10B – $20B |
|
75th percentile |
119% |
100% |
121% |
|
Median |
109% |
100% |
103% |
|
25th percentile |
92% |
95% |
95% |
Total Pay Changes
CEO actual total compensation (base salary, annual incentive payouts, and long-term incentives) increased in 2019. The largest increases were at the large and small banks (9.6% and 5.2%, respectively) which was driven by a combination of base salary increases and larger long-term equity grants. While annual incentives were paid at target for medium banks, 2019 bonus opportunity increases led to a 14.6% year over year increase in value. The increase in long-term incentives was likely due to strong performance in 2018, as long-term incentives are generally granted in the first quarter (early 2019) and based on prior year (2018) performance. Large banks performed stronger in 2018 compared to the small and medium banks, which may explain the larger year-over-year increase in long-term incentives.
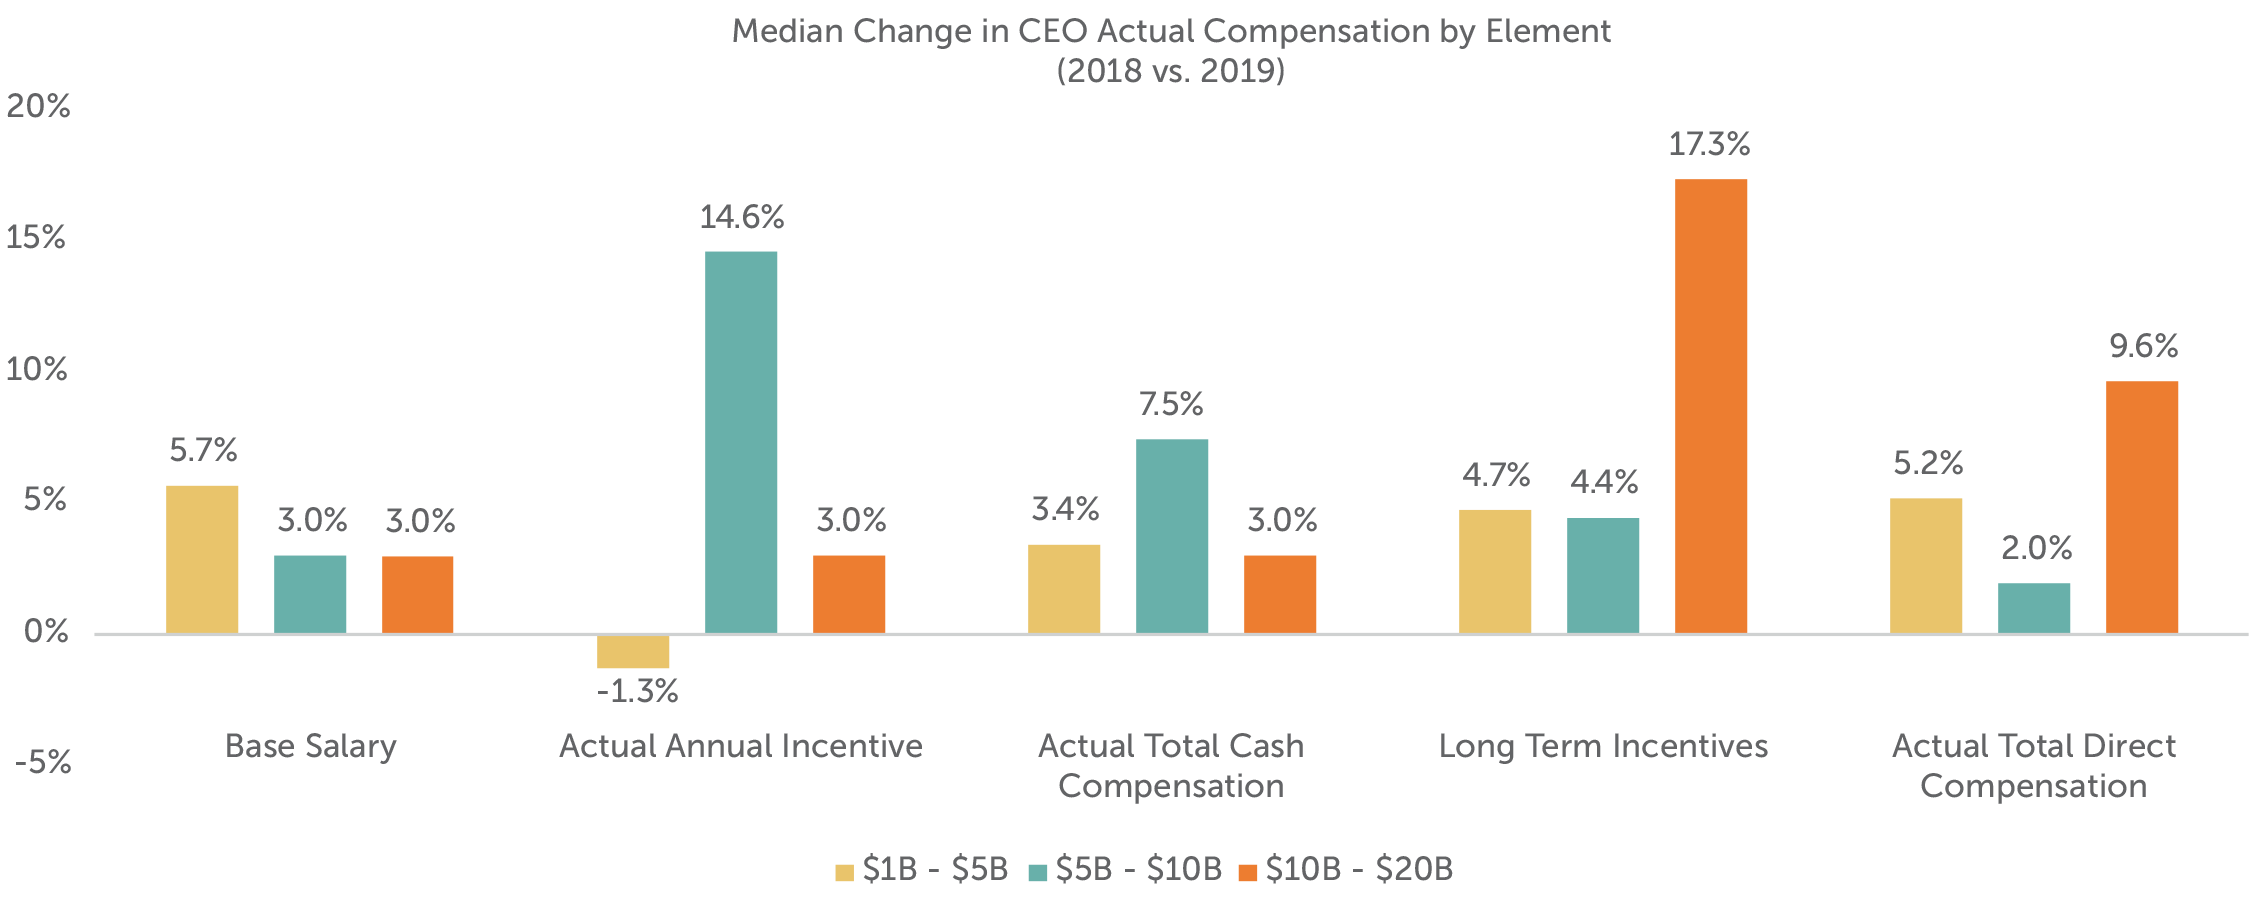
Note: Excludes companies where there was a change in CEO
Pay Practices
Annual Incentive Plans
The most common annual incentive plan approach is a “goal attainment” plan where actual financial achievement is compared to pre-established goals made at the beginning of the fiscal year. The banks in our sample typically utilize several corporate metrics when determining their annual incentive payout. Approximately 75 percent of the small, medium, and large banks use three or more weighted financial metrics. Efficiency Ratio, Asset Quality (i.e., non-performing assets, non-performing loan ratio), ROA, EPS, ROE and Net Income are the most prevalent metrics used at these banks. Returns (ROA or ROE), EPS and Net Income were typically weighted more (approximately 30-40 percent of the total plan) than Efficiency Ratio and Asset Quality metrics (approximately 15-20 percent of the total plan). The small banks differ from the medium and large banks in that they more frequently use Loan or Deposit measures in their plans, with these metrics accounting for no more than 20 percent of the total plan.

Smaller banks also tend to use and assign higher weightings to individual performance. In all cases they represent 20-50 percent of the total plan as a standalone weighted metric. These individual measures are prevalent at 46 percent of the small banks studied compared to 14-15 percent of the medium and large banks; however, the medium and large banks are more likely to incorporate strategic goals such as digital strategies, community presence or customer satisfaction.
Long-term Incentive (LTI) Plans
The most typical long-term incentives used across industries, including the banking industry, include stock options, time-vested stock (restricted stock (RS) or restricted stock units (RSUs)) and performance-vested stock. Most medium and large banks use a portfolio approach in their long-term incentive plan, with approximately two-thirds of these banks granting two or three LTI vehicles. The small bank sample more frequently either uses a single LTI vehicle (38%) or has no long-term incentive plan (15%). The LTI mix seen between the three groupings is fairly consistent, with stock options continuing to be the least utilized LTI vehicle, on average about 8 percent of the overall LTI mix. Time-vested restricted stock typically makes up about 30 percent to 40 percent of the LTI mix among these banks, with performance plans making up the bulk (about 50-65%) of LTIs in the total sample.

Performance plans are typically granted annually and have overlapping 3-year performance periods. Payouts can fluctuate based on achievement of performance measures, and the upside is normally limited to 150 percent to 200 percent of the target level. Over three-quarters of companies in each asset grouping (that utilize performance plans) measure performance against two or more metrics. The most prevalent metrics used are relative TSR, Returns, EPS, and Asset Quality for all three groupings, and it is common that two of these measures are paired together to determine all, or the majority of, the payout. Asset Quality is a fairly prevalent metric among medium sized banks (used by a third of the companies).
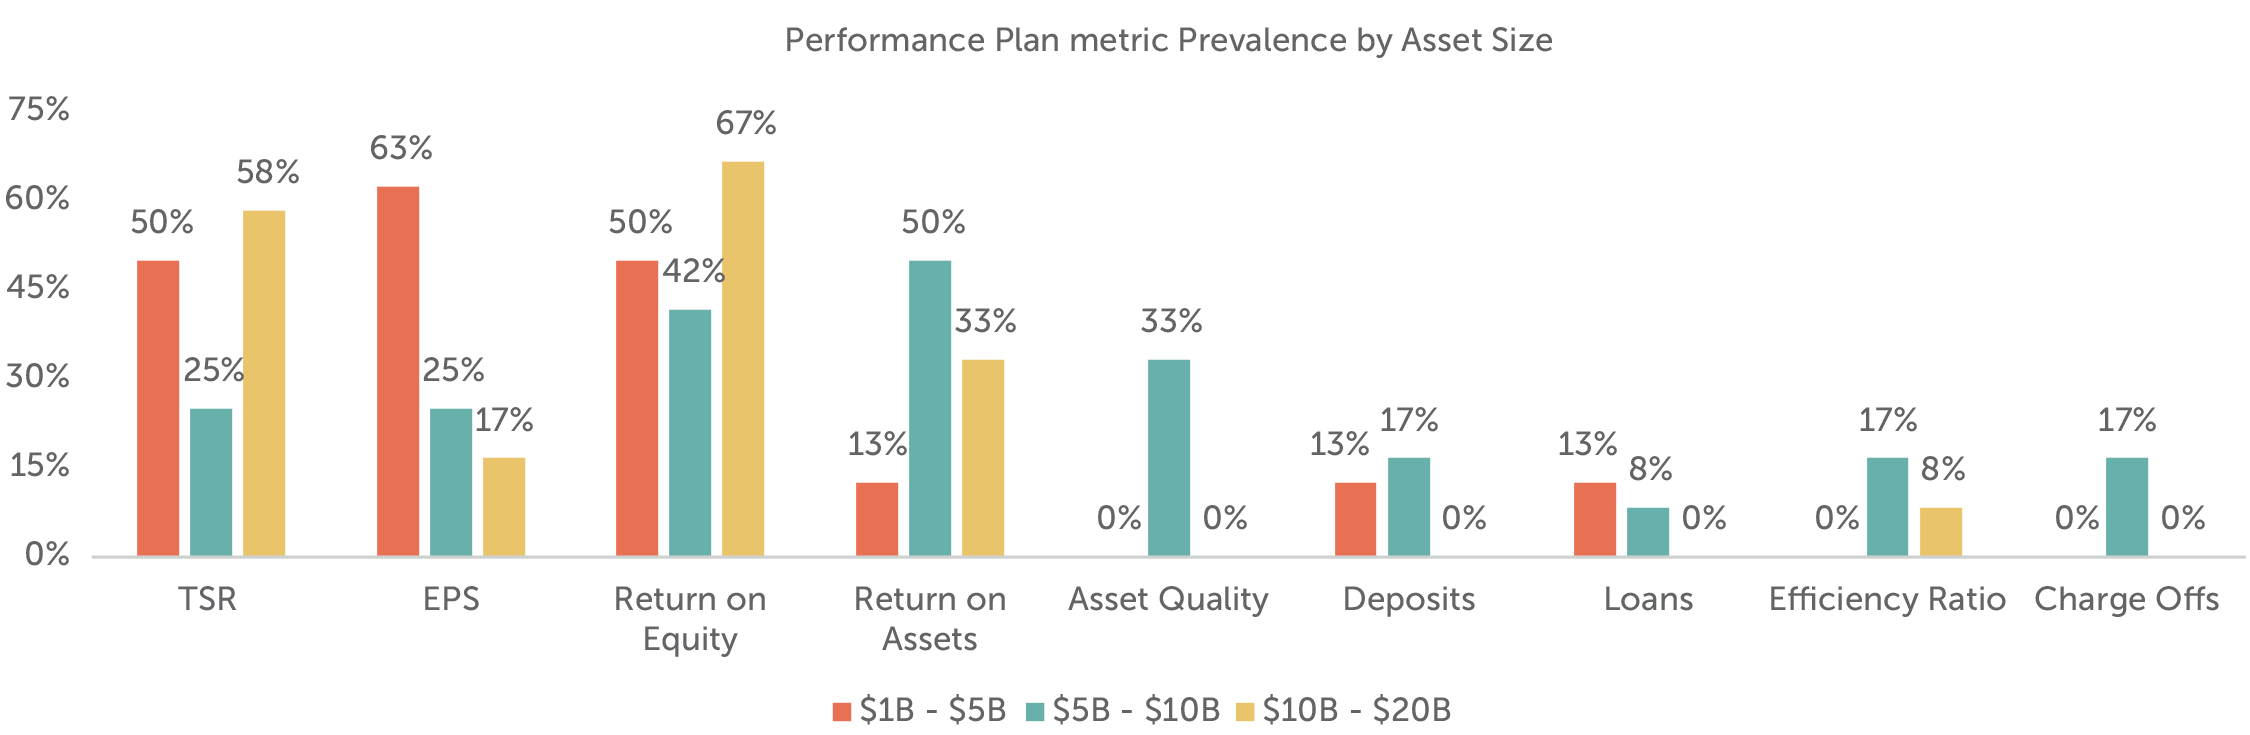
As banks increase in size, it becomes more likely that both absolute and relative comparisons are made when determining payouts; 42 percent of the large and medium banks look at performance on both an absolute and relative basis compared with 12 percent of small banks. These smaller banks may be challenged in setting 3-year goals, and, therefore, rely more heavily on relative performance.
|
Asset Size |
Performance Plan Measures |
||
|
Measurement Type(s) |
|||
|
Absolute |
Relative |
Both |
|
|
$1B – $5B |
25% |
63% |
12% |
|
$5B – $10B |
33% |
25% |
42% |
|
$10B – $20B |
16% |
42% |
42% |
TSR is almost exclusively measured on a relative basis, often measured against either the company-defined peer group or an industry index. In our sample of banks, relative TSR is more commonly installed as a weighted metric and only 5 percent of all banks use it as a modifier of the calculated payout. Other common relative metrics include Returns, EPS and Loan or Deposit growth.
Governance Practices
Stock Ownership Guidelines
The prevalence of stock ownership guidelines among the different asset groupings varies by group. All of the large banks have stock ownership guidelines in place for the named executive officers (NEOs) compared to 69 percent at the medium banks and 54 percent at the small banks. The larger banks grant a larger portion of long-term incentives in equity; therefore, it should not be surprising that executives must meet a required ownership guideline.
|
Asset Size |
Stock Ownership Guidelines |
|
|
CEO |
Other NEOs |
|
|
$1B – $5B |
62% |
54% |
|
$5B – $10B |
69% |
69% |
|
$10B – $20B |
100% |
100% |
Clawbacks
The proposed rules under the Dodd-Frank Act require companies to adopt policies that would claw back incentive compensation paid to current and former executives based on inaccurate financial results. Despite the rules being proposed in 2015 and not being finalized to date, many companies have adopted policies that are similar to the anticipated rules. Among our sample of banks, 83 percent of banks across all asset sizes have a clawback policy in place. The prevalence is greatest among the large banks.
|
Asset Size |
Clawback Policy |
|
Percent of Companies |
|
|
$1B – $5B |
77% |
|
$5B – $10B |
77% |
|
$10B – $20B |
93% |
Approximately 50 percent of the banks across all asset sizes have clawback triggers for financial restatement regardless of fraud or misconduct and 36 percent of banks can recoup incentive compensation due to fraud, misconduct, or material inaccurate financials beyond a financial restatement.
It is common for organizations to adopt stronger governance protocols such as stock ownership guidelines and clawback policies as they increase in size and may be more closely scrutinized by investors, regulators, and proxy advisory firms.
Looking Ahead
Impact of COVID-19 on Incentive Plans
Many banks set their 2020 incentive plan goals early in the year, before the onset of the COVID-19 pandemic in the U.S. As the second half of 2020 continues and the true economic impact of COVID-19 is felt globally, CAP expects some banks to use discretion to adjust 2020 annual incentive payouts, widen or change goals for outstanding performance-vested LTI goals and modify the 2021 annual incentive and LTI design. Most banks are waiting until year end to make specific decisions on any potential adjustments to incentives, as companies will try to quantify the COVID-19 related impact and address elements that were outside of management’s control (i.e., zero interest rate environment). Further, with stock prices down over 30 percent to date, equity worth less today compared to the grant date fair value, and annual and long-term performance plans projected to pay out well below target, Compensation Committees may feel the pressure to adjust incentive plan payouts or award retention bonuses in order to motivate and retain key talent.
Diversity and Inclusion Metrics in Incentive Plans
Diversity and inclusion is a topic that is increasingly being discussed among Board members and Compensation Committees specifically. With a growing focus on increasing diversity in the industry, the natural question is whether such initiatives should be included in compensation decision making. One large bank in our sample considers the achievement of certain diversity and inclusion targets as part of its individual assessment. While currently a minority practice to include diversity and inclusion measures in incentive plans, a discussion around each banks' diversity and inclusion statistics is increasingly becoming an agenda topic at Board meetings.
Given today’s climate, CAP expects an increase in the number of companies measuring the progress of diversity though the approach may vary between a quantitative metric or a more qualitative assessment. Compensation Committees have the flexibility to tailor goals that will impact payouts to the executives most responsible for this progress. The inclusion of diversity and inclusion progress in incentive compensation plans could highlight the importance of a company’s commitment to these objectives.
2020 Presidential Election
The banking industry has generally benefited from the policies of the current administration and reduced level of regulations. Two recent pieces of legislation have had a positive impact on the banking industry’s financial performance.
- 2017 Tax Cuts and Jobs Act: Meaningful benefit for corporations due to the reduced corporate tax rate
- 2020 Coronavirus Aid, Relief, and Economic Security Act: Benefited banks from fee income related to the Paycheck Protection Program loans
By contrast, the Democratic candidate Joe Biden plans to raise taxes and stiffen oversight of the banking industry. Given the uncertainty regarding taxes and regulation, banks financials may be impacted with an increase in taxes and heavier regulation in 2021 and beyond.
Conclusion
Compensation program practices have remained steady among our sample of banks. We expect to see changes in 2020 and beyond given the pandemic and focus on diversity and inclusion. As was the case after the 2008/2009 financial crisis, the ability to adjust and adapt to a changing environment is critical to the success of banks in attracting, motivating, and retaining key talent. While employee retention will be a key objective for management and Compensation Committees, banks must balance rewarding employees for their extraordinary efforts in response to the pandemic with pay for performance alignment and the shareholder experience. Further, given the heightened focus on diversity and inclusion and public commitments to diversity, companies are committing resources for initiatives aimed at promoting a diverse and inclusive workplace. We expect banks in our study to continue their efforts to make progress on the diversity and inclusion front.
For questions or more information, please contact:
Kelly Malafis Partner [email protected] 212-921-9357
Shaun Bisman Principal [email protected] 212-921-9365
Chris Callegari Senior Analyst [email protected] 646-486-9747
Stefanie Kushner and Felipe Cambeiro provided research assistance for this report.
Regional Banks in CAP’s Study (n=40)
Small Banks ($1B – $5B in assets)
- Bridge Bancorp, Inc.
- Capital City Bank Group, Inc.
- Central Valley Community Bancorp
- CNB Financial Corporation
- Evans Bancorp, Inc.
- Farmers National Banc Corp.
- First Business Financial Services, Inc.
- First Financial Northwest, Inc.
- German American Bancorp, Inc.
- Heritage Commerce Corp
- Independent Bank Corporation
- National Bankshares, Inc.
- Sierra Bancorp
Medium Banks ($5B – $10B in assets)
- 1st Source Corporation
- Amerant Bancorp Inc.
- Banc of California, Inc.
- Boston Private Financial Holdings, Inc.
- Brookline Bancorp, Inc.
- First Busey Corporation
- First Commonwealth Financial Corporation
- First Foundation Inc.
- Lakeland Bancorp, Inc.
- Park National Corporation
- Seacoast Banking Corporation of Florida
- Univest Financial Corporation
- Westamerica Bancorporation
Large Banks ($10B – $20B in assets)
- Ameris Bancorp
- Atlantic Union Bankshares Corporation
- BancorpSouth Bank
- Bank of Hawaii Corporation
- Berkshire Hills Bancorp, Inc.
- Cadence Bancorporation
- Community Bank System, Inc.
- First Merchants Corporation
- First Midwest Bancorp, Inc.
- Glacier Bancorp, Inc.
- Great Western Bancorp, Inc.
- Old National Bancorp
- Trustmark Corporation
- United Bankshares, Inc.
Each year CAP analyzes non-employee director compensation programs among the 100 largest companies. These companies can provide early insights into trends for compensation practices. This report reflects a summary of pay levels and pay practice trends based on 2020 proxy disclosure.
Key Takeaways
- Lowest year-over-year increase in total board compensation in the last 10 years
- Median retainer for Lead Director is now $45K, up from $35K in prior year
CAP Findings
Board Compensation
pay levels remained generally flat again
- Total Fees. Board compensation continues to be in a steady state with low single-digit annual increases. Median is now $310K, up from $305K last year. This is the lowest year-over-year increase during the 10 years that CAP has been conducting this study. Despite a significant increase in time requirements for board members during 2020 due to implications of the COVID-19 pandemic, we do not expect to see increases to annual director pay programs during 2020. That said, pay will be up during 2020 at the limited number of large companies that have retained meeting fees as an element of their non-employee director compensation program.
- COVID-19. 11 percent of companies announced pandemic-related temporary compensation reductions for directors, with most decreases only impacting cash compensation. In each of these cases, the company also announced a CEO salary reduction. 73 percent of these reductions were set to expire at the end of 2020, or sooner, while others did not specify a timeframe or stated “for the duration of the crisis.”
- Pay Structure. Companies rely mainly on annual retainers (cash and equity) to compensate directors. Pay programs for large companies are simple and tend to not use meeting fees. We support this approach as it simplifies administration and the need to define what counts as a meeting, though it may not be appropriate in all situations. While workload varies from year-to-year, this “advisory fee” approach takes a long-term view of director compensation and time requirements.
- Meeting Fees. Consistent with prior years, only 11 percent of companies studied provide meeting fees. Companies could consider having a mechanism for paying meeting fees if the number of meetings in a single year far exceeds the norm (“hybrid approach”). 5 percent of companies studied used this “hybrid” approach to meeting fees.
- Equity. 95 percent of companies used full-value awards (shares/units) and only 5 percent used stock options (3 of the 5 companies granting stock options used both equity award vehicles). Almost all companies denominated equity awards using a fixed value, versus a fixed number of shares. Using fixed value is generally considered best practice as it manages the “target” value awarded each year. The timing of director equity awards is typically linked to the annual meeting of stockholders. As a result of this and the standard fixed value approach to equity award determination, the number of shares directors received this year, at many companies, was significantly greater than prior years given typically short-term pandemic-driven stock price declines.
- Pay Mix. On average, total pay is comprised of 61% equity and 39% cash, which is consistent with findings over recent years.
- Process: 19 percent of companies disclosed increases to board cash and/or equity retainers in their 2020 proxy. This represents a significant decline from the one-third of companies that disclosed increases last year.
Committee Member1 Compensation
prevalence continues to slowly decline
- Overall Prevalence. 41 percent of companies paid committee-specific member fees for Audit Committee service, while only about a quarter of companies pay fees for other committee membership. Companies rely more on board-level compensation to recognize committee member (non-Chair) service, with the general expectation that all independent directors contribute to committee service needs.
- Total Fees. Of the companies that paid committee member compensation, the median was $18K in total.
Committee Chair1 Compensation
little/no change again
- Overall Prevalence. More than 90 percent of companies provided additional compensation to Chairs to recognize additional time requirements, responsibilities, and reputational risk.
- Fees. Median additional compensation increased to $28K from $25K for Audit Committee Chairs and remained $20K for Compensation Committee and Nominating/Governance Committee Chairs.
Independent Board Leader Compensation
pay levels continue to increase
- Non-Exec Chair. Additional compensation is provided by nearly all companies with this role. Median additional compensation was $235K. As a multiple of Total Board Compensation, total Chair pay was 1.75x a standard Board member, at median.
- Lead Director. Median additional compensation was $45K, up significantly from $35K last year. Additional compensation is provided by nearly all companies with this role2. The differential in pay versus non-executive Chairs is in line with typical differences in responsibilities.
Pay Limits
prevalence continues to increase
- 67 percent of companies have a shareholder approved limit in place for director compensation, up from 62 percent in the prior year.
- 54 percent of limits apply to just equity-based compensation, compared to 60 percent last year. We anticipate that the prevalence of limits that apply to both cash and equity-based compensation (i.e., total pay) will continue to increase.
- Director pay limits are in place largely due to advancement of litigation where the issue has been that directors approve their own annual compensation and are therefore deemed to be inherently conflicted.
- Similar to last year, limits range from $245K to $3.76M, with a median limit of $750K. The limited group of companies that denominate the limit in shares tend to have a higher dollar-equivalent limit, with a median of $1.18M.
- The limits are generally much higher than annual equity grants. Nearly one-third of limits are equivalent to more than 5x the annual equity grant.
- Some companies exclude initial at-election equity awards, committee Chair pay, and/or additional pay for Board leadership roles from the limit.
- The higher limits above likely are intended to address the possibility of having to pay higher amounts to a non-executive Chair.
|
Limit |
Prevalence |
|
<= 3X annual equity |
40% |
|
3.01X – 5X annual equity |
27% |
|
5.01X – 7X annual equity |
19% |
|
> 7X annual equity |
13% |
Some Changes CAP Suggests Companies Consider (Looking Ahead)
- Recruiting New Directors. As boards look to refresh and diversify their membership, this may be the time to re-visit initial at-election equity awards for new directors. There has been a considerable “move to the middle” with director pay programs, and at-elections grants can be a way to differentiate your company’s pay program in the recruiting process without a broader, more costly, increase to standard director pay levels.
- Board Leadership Roles. Taking on the role of non-executive Chair, Lead Director or Chair of a major committee can come with considerable time requirements, responsibilities, and reputational risk, yet additional compensation provided for most of these roles only reflects a modest premium on the standard director pay program. Providing greater additional compensation for the role of Lead Director of Chair of a major committee should be considered, in recognition of the typical time requirements, responsibilities and reputational risk individuals in these roles take on.
- Stock Ownership Requirements. Many boards, especially among the largest companies, require equity-based compensation be deferred until retirement (i.e., termination of board service). While we support alignment of director and shareholder interests through equity compensation, a standard stock ownership guideline (e.g., multiple of annual cash retainer) may be a competitive advantage when recruiting new directors who may be more focused on current compensation.
Appendix: Historical 3-Year Look

Total Board Compensation ($000s)3

Additional Compensation for Independent Board Leaders ($000s)

1 Audit, Compensation and/or Nominating and Governance committees.
2 Excludes controlled companies. Also excludes instances where Lead Director role is assumed by Chair of Nominating and Governance Committee, who receives compensation for the role.
3 Total Board Compensation reflects all cash and equity compensation for Board and committee service, excluding compensation for leadership roles such as committee Chair, Lead/Presiding Director, or non-executive Board Chair.
Compensation Advisory Partners (CAP) assessed human capital actions taken by companies in the Real Estate sector in response to the COVID-19 pandemic. Key findings include:
- The Real Estate sector was nominally impacted by the COVID-19 pandemic.
- 24% of the Real Estate companies in the S&P Composite 1500 Index reported human capital actions in response to the pandemic. In contrast, 41 percent of companies in the S&P 1500 reported actions.
- Pay reductions for executives and board members are the most prevalent human capital actions in the Real Estate sector.
- Median salary reductions were 50 percent for chief executive officers (CEOs), while median salary reductions for other executives were 21 percent.
- For boards of directors, pay was cut by a median of 33 percent.
- In addition to pay reductions for executives and boards, the most prevalent human capital actions in the Real Estate sector were furloughs, workforce reductions and employee pay reductions.
The PDF of the report provides additional data for the Real Estate sector.
The human capital actions that CAP is tracking include pay cuts; changes to annual and long-term incentives; furloughs; workforce reductions; suspended 401K matches; enhanced health and welfare benefits; additional pay for frontline workers; pay continuity; and workforce expansions. CAP will continue to monitor corporate public announcements of COVID-19 actions.
Compensation Advisory Partners (CAP) assessed human capital actions taken by companies in the Information Technology sector in response to the COVID-19 pandemic. Key findings include:
- The Information Technology (IT) sector and its Software & Services, Technology Hardware & Equipment, and Semiconductors and Semiconductor Equipment industries were nominally impacted by the COVID-19 pandemic.
- 28% of the Information Technology companies in the S&P Composite 1500 Index reported human capital actions in response to the pandemic. In contrast, 41 percent of companies in the S&P 1500 reported actions.
- Of the industries in the Information Technology sector, Software and Services (33%) and Technology Hardware and Equipment (32%) were impacted similarly, with about a third of companies reporting actions. In the Semiconductors and Semiconductor Equipment industry, only 15% of companies reported actions.
- Pay reductions for executives and board members are the most prevalent human capital actions in the Information Technology sector.
- Median salary reductions were 30 percent for chief executive officers (CEOs), while median salary reductions for other executives were 20 percent.
- For boards of directors, pay was cut by a median of 28 percent. The range of board pay cuts approximates the range for CEO pay cuts.
- In addition to pay reductions for executives and boards, the most prevalent human capital actions in the Information Technology sector were furloughs, employee pay cuts, and workforce reductions.
The PDF of the report provides additional data for the Information Technology sector.
The human capital actions that CAP is tracking include pay cuts; changes to annual and long-term incentives; furloughs; workforce reductions; suspended 401K matches; enhanced health and welfare benefits; additional pay for frontline workers; pay continuity; and workforce expansions. CAP will continue to monitor corporate public announcements of COVID-19 actions.


