Our findings, summarized below, indicate that overall, increases in pay levels for both CFOs and CEOs have moved from double-digit figures in the 2009-2010 period to single-digit figures in the 2010-2011 period, suggesting pay actions that are more reflective of a stabilizing economy. Pay increases in both periods were higher for CFOs compared to CEOs, driven by higher increases in short-term compensation. On an absolute basis, CFO pay continues to be approximately one-third of CEO pay.
Study Results
Salaries
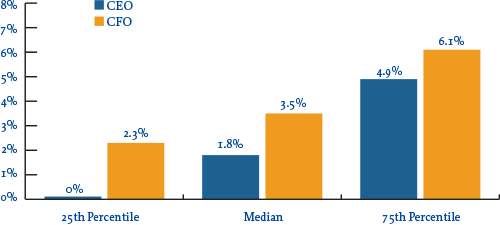
In 2011, 88% of CFOs received salary increases at a rate of 3.5% at median and 6.1% at the 75th percentile. In comparison, only 66% of CEOs received salary increases at lower levels (1.8% at median and 4.9% at the 75th percentile). The prevalence of salary increases for both CFOs and CEOs rose year-over-year, from 75% to 88% (CFOs) and from 56% to 66% (CEOs).
Salary Increase Prevalence |
||||
| 2009 – 2010 | 2010 – 2011 | |||
| No Increase | Increase | No Increase | Increase | |
| CEO |
43.8% |
56.3% |
34.4% |
65.6% |
| CFO |
25.0% |
75.0% |
12.5% |
87.5% |
2011 Salary Increases
Actual Pay Levels
Overall, actual total direct compensation (salary plus actual annual incentive plus the present value of long-term incentives) for both CFOs and CEOs continued to increase but at much lower rates in the 2010-2011 period compared to 2009-2010, as illustrated in the chart below. These lower, single-digit increases in pay levels are indicative of a stabilizing economy. The salary and actual bonus increase levels themselves continued to be higher for CFOs in the 2010-2011 period than for CEOs. Long-term incentives proved to be the biggest driver of pay increases from 2010 to 2011, however, rising by 10% for both CEOs and CFOs.
Median Percentage Change in Pay Components |
||||
| Pay Components | 2009 – 2010 | 2010 – 2011 | ||
| CEO | CFO | CEO | CFO | |
| Salary |
1.0% |
3.7% |
1.8% |
3.5% |
| Actual Bonus |
19.0% |
22.7% |
0.0% |
3.5% |
| Long-Term Incentives |
10.1% |
14.8% |
10.0% |
10.3% |
| Actual Total Direct Comp. |
14.4% |
20.0% |
3.6% |
7.5% |
Financial Performance (Median Levels) |
|||
| Year | Total Shareholder Return (as of 12/31) | 1-Year Revenue Growth | 1-Year Net Income Growth |
| 2009 |
31% |
-9% |
-7% |
| 2010 |
24% |
10% |
19% |
| 2011 |
5% |
9% |
13% |
While movement in pay among CFOs and CEOs was directionally similar, absolute CFO total direct compensation levels, on average, have been approximately 30% of CEO total direct compensation levels over the last three years.
Target Pay Mix
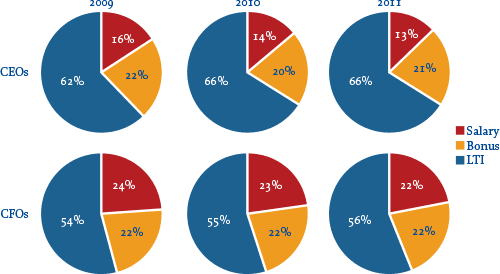
In terms of target compensation levels, the overall pay mix remained largely unchanged from 2009 to 2011, with a greater emphasis on at-risk pay for CEOs than for CFOs.
Long-Term Incentive (LTI) Vehicle Prevalence and Mix
The majority of companies continue to award LTI to both CEOs and CFOs using at least two incentive vehicles. The role of stock options has declined in the overall mix companies use to deliver LTI. And on average, performance-based LTI now comprises approximately 50% of LTI for CEOs and CFOs, an increase of approximately 10% over the past three years. Data shows 80% of CFOs and 85% of CEOs received some form of performance-based awards as part of their LTI program in 2011.
Number of LTI Vehicles Used in 2011 |
||
| % in Total | ||
| CEO | CFO | |
| 1 |
20% |
18% |
| 2 |
46% |
44% |
| 3 |
31% |
34% |
| Average |
2 |
2 |
LTI Mix |
||||||
| 2009 | 2010 | 2011 | ||||
| CEO | CFO | CEO | CFO | CEO | CFO | |
| Stock Options |
40% |
41% |
33% |
30% |
32% |
32% |
| Time Vested Restricted Stock |
19% |
21% |
20% |
23% |
17% |
22% |
| Perf. Based LTI |
40% |
38% |
48% |
47% |
51% |
46% |
Conclusion
In the last three years, trends in CFO pay have been directionally aligned with trends in CEO pay. While the rates of increases were higher for CFO’s 3 years ago, and have started to moderate compared to earlier years, trends for both positions indicate a pronounced linkage to performance, particularly through the long term incentive program.
While volatility in the economy may be stabilizing somewhat, we expect the performance linkages to remain strong for these two key positions. With the continued emphasis at the executive and board level on strong financial skills, talent and acumen, companies will continue to pay competitively for those in the CFO role.
Stronger Governance Practices
What We Found
In response to increased pressure from shareholders and proxy advisory firms, as well as recent Say on Pay legislation, companies continue to monitor their executive compensation programs. In the past, companies would re-evaluate their programs every 2-3 years. Given today’s intense scrutiny of executive compensation, we are seeing companies and compensation committees re-evaluate their programs annually. New governance standards include completing the annual risk assessment and implementing updated clawback policies. In addition, companies have removed excise tax-gross ups from change in control benefits and perquisites, continue to emphasize stock ownership guidelines and stock retention requirements, and have reduced supplemental retirement benefits.
Compensation Risk Disclosure
Clear and explicit disclosure of the compensation risk assessment process is becoming standard practice, especially after the recent economic downturn and passage of SEC rules on enhanced compensation disclosure. Of the 111 companies in our study, 105, or 95%, make some type of affirmative disclosure on risk assessment in the most recent proxy. Similar to 2009, none of the companies disclosed that their incentive programs create material adverse risks.
Most companies make their risk-related disclosure in the CD&A of the proxy statement, with the corporate governance section of the proxy statement ranking as the second most common place for this disclosure. The table below summarizes where risk disclosures were made:
| Section of the Proxy Statement with Compensation Risk Disclosure |
2010 | 2009 | ||
| % of Cos. | % of Cos. | |||
| No. of Cos. | n=105 | No. of Cos. | n=75 | |
| CD&A | 49 | 47% | 39 | 52% |
| Corporate Governance Section (Section 407) | 25 | 24% | 19 | 25% |
| CD&A and Corporate Governance Section (Section 407) | 14 | 13% | 7 | 9% |
| Separate Stand Alone Section | 11 | 10% | 8 | 11% |
| CD&A and Compensation Committee Report | 4 | 4% | 2 | 3% |
| Compensation Committee Report | 2 | 2% | n/a | n/a |
Responsibility for completing the risk assessment process varies by company. Of the companies disclosing a risk assessment, 35 companies (33%) had management and the compensation committee working together to conduct the assessment, while 17 companies (16%) reported that the compensation committee worked alone to conduct the assessment. One change we noted is that this year 95% of companies disclosed who conducted the risk assessment versus only 65% last year. The table below provides further detail on which groups were involved in the compensation risk review:
| Approach to Compensation Risk Reviews | 2010 | 2009 | ||
| % of Cos. | % of Cos. | |||
| No. of Cos. | n=105 | No. of Cos. | n=75 | |
| Management & Compensation Committee | 35 | 33% | 10 | 13% |
| Compensation Committee | 17 | 16% | 7 | 9% |
| Compensation Committee & Consultant | 15 | 14% | 9 | 12% |
| Management | 13 | 12% | 7 | 9% |
| Management, Compensation Committee & Consultant | 12 | 11% | 15 | 20% |
| Management & Consultant | 8 | 8% | 1 | 1% |
| Not Disclosed | 5 | 5% | 26 | 35% |
Clawbacks
Despite the SEC’s delay in proposing policies to recoup executive compensation under Dodd-Frank, companies have been proactively adopting clawback policies. Even though clawbacks are mandated by the SEC for all public company CEOs and CFOs under SOX and for the top 25 executives in TARP participants, companies have implemented their own clawbacks to obtain broader protection.
A significant majority of our research companies – 89 of 111 (80%) – maintain some form of clawback provision. For 2010, 17 of the 89 companies adopted a new clawback policy and 10 modified existing policies by expanding the type of compensation that can be recouped, the executives covered or the events that trigger a clawback. The majority of companies are awaiting final SEC regulations, however, before making comprehensive changes to update existing policies.
Similar to our findings in 2009, a financial restatement is required to trigger a clawback in nearly all cases (74 companies or 83% of those with a clawback). Further, 66 companies (74% of those with a clawback) disclosed that misconduct is a triggering event and 45 companies (51%) disclosed fraud as a trigger.
Based on our review of CD&A disclosures, companies with a clawback include the ability to clawback or recoup the following types of compensation: earned, exercised, outstanding, vested or unvested.
| Compensation Subject to Clawback | % of Cos. | |
| No. of Cos. | n=89 | |
| Prior annual incentive | 81 | 91% |
| Prior LTI | 79 | 89% |
| Future annual incentive | 20 | 22% |
| Future LTI | 14 | 16% |
Note: Percentages add up to greater than 100% due to multiple responses.
Of the type of compensation that is subject to a clawback, clawbacks of both cash and equity are equally prevalent.
While the majority of companies do not explicitly state who their clawback policy applies to, it is clear that coverage extends to the NEOs at 83 companies (93%).
A minority of companies (18 companies or 20%) indicate the time period which compensation can be recovered after a restatement. Of the 18 companies that disclosed a time frame, the most common is 1 year from the date of restatement and the range is 1-3 years.
It is apparent from reviewing CD&A disclosure that most companies are waiting for the SEC to rule before modifying their current policies. Companies will need to develop and implement a policy to provide for recovery of compensation that aligns final rules issued by the SEC. The proposed rules apply to both current and former executives and cover all incentive compensation within 3 years of a financial restatement (with or without intentional misconduct). It is unlikely that companies will make final modifications to their policies that apply to the 2012 proxy season, since the SEC is not expected to issue final rules until the first half of 2012.
Stock Ownership Requirement Changes
Companies continue to monitor their stock ownership requirements in order to align executives with shareholders. This year 25 companies (23%) initiated a change with respect to stock ownership or stock holding requirements. The most prevalent change was an increase in stock ownership guideline levels, with 12 of the 25 companies (48%) disclosing an increase. This is likely attributed to a recovery in the economy as well as stock prices, and increasing pressure from regulators and proxy advisory firms. Other common changes were 24% of companies added a new stock holding requirement and 20% modified or added a penalty for non-compliance. Further detail on changes made to executive stock ownership guidelines are below:
| Changes made to Executive Stock Ownership Guidelines | 2010 | 2009 | ||
| % of Cos. | % of Cos. | |||
| No. of Cos. | n=25 | No. of Cos. | n=17 | |
| Increased | 12 | 48% | 3 | 18% |
| Added holding requirement | 6 | 24% | n/a | n/a |
| Modified penalty for non-compliance | 5 | 20% | n/a | n/a |
| Changed to multiple of salary | 2 | 8% | n/a | n/a |
| Increased holding requirement | 2 | 8% | n/a | n/a |
| Decreased holding requirement | 2 | 8% | n/a | n/a |
| Newly adopted | 1 | 4% | 10 | 59% |
| Decreased | 1 | 4% | 1 | 6% |
| Adopted mandatory holding of shares through retirement | 1 | 4% | n/a | n/a |
Note: Percentages add up to greater than 100% due to multiple changes by several companies.
Stock Ownership Requirements Detail
For companies disclosing shares counted toward ownership requirements, it is interesting to note that one-third of companies count unvested restricted stock towards meeting the guidelines, since companies expect executives to vest in these shares. However, only 6% count vested/unexercised options and 5% count unearned performance shares since these shares are viewed as being subject to greater risk. See below for further detail:
| Shares Counting For Guideline Requirements | % of Cos. | |
| No. of Cos. | n=99 | |
| Shares directly owned | 55 | 56% |
| Unvested RS | 33 | 33% |
| Shares in 401(k) plan | 33 | 33% |
| Shares indirectly owned | 29 | 30% |
| Shares purchased on open market | 29 | 29% |
| Not disclosed | 29 | 29% |
| Deferred Compensation | 25 | 25% |
| Vested but unexercised options | 6 | 6% |
| Unearned performance shares | 5 | 5% |
| Unvested options | 1 | 1% |
Note: Percentages add up to greater than 100% due to multiple types of equity counted by various companies.
Among CEOs, most companies (82%) express their guidelines as a multiple of base salary and 17% of companies express their guidelines in fixed share amounts. The fixed share approach is more prevalent among financial services and technology companies.
The median guideline for all company CEOs in our study sample is a 5x multiple of base salary or a fixed share guideline of 150,000 shares. The median value of these guidelines is $6,700,000.
| CEO Stock Ownership Guidelines (n=99) |
Prevalence |
25th Percentile Level | Median Level | 75th Percentile Level |
| Multiple of Base | 82% | 5.0x | 5.0x | 6.0x |
| Fixed Share | 17% | 100,000 | 150,000 | 300,000 |
| Fixed Value | 1% | $5,000,000 | $5,000,000 | $5,000,000 |
| Total Value | – | $5,389,894 | $6,700,000 | $8,600,000 |
15% of companies disclose some type of penalty for non-compliance with stock ownership guidelines. The most common penalties disclosed include mandatory payment of a portion of the annual bonus in stock and requiring executives to hold shares after an option exercise or the vesting of stock awards.
Stock Holding Requirements Detail
Having stock holding or stock retention requirements in addition to stock ownership guidelines is a growing trend. In our sample of 111 companies, 30 companies (27%) disclose some type of stock holding requirement. Over half of the 30 companies have a stand-alone stock holding requirement. This type of requirement is most prevalent among financial services companies in place at 75% of financial services companies.
Most of these companies (46%) require executives to hold equity after vesting or exercise for 1 year. Holding shares until retirement (33%) is the second most prevalent holding period, although it is relatively rare. 70% of companies disclose that the equity to be held is the net after-tax shares retained by the executive after option exercise/equity vesting. See below for further detail:
| Definition of LTI subject to Hold | % of Cos. | |
| No. of Cos. | n=30 | |
| RS/RSUs | 25 | 83% |
| Options | 22 | 73% |
| Performance Shares | 12 | 40% |
| Net after tax shares | 21 | 70% |
Note: Percentages add up to
Notable 2010 Findings
Total Board Compensation
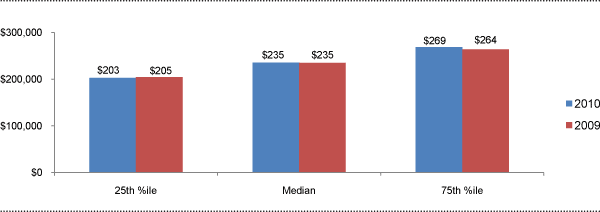
At median, pay levels for non-employee directors were flat from 2009-10. Year-over-year, median Total Board Compensation remained steady at $235,000 i.
Total Board Compensation ($000s)
In line with emerging practices among large companies, use of Board meeting fees was minority practice in 2010, with only 23% of companies paying meeting fees.
Pay Mix
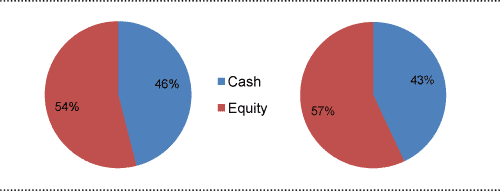
On average, the cash vs. equity pay mix was generally consistent between 2009 and 2010. The majority of compensation delivered to non-employee directors continues to be in the form of equity.
2010 Pay Mix | 2009 Pay Mix
CAP Perspective:
Over the next few years, we expect the following trends in director compensation to take place: 1) low to mid single-digit annual increases in Total Board Compensation; 2) more companies moving to fixed cash pay structures; 3) a continued emphasis on full-value equity awards.
Equity Compensation
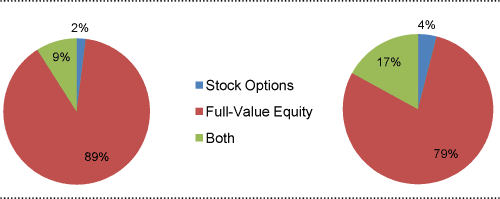
On average, an increased portion of 2010 equity-based compensation for non-employee directors was paid in the form on full-value awards, as compared to 2009.
2010 Equity Awards | 2009 Equity Awards
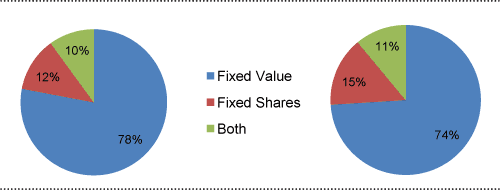
Year-over-year (2010 vs. 2009), equity awards denominated as a fixed value increased in prevalence, as opposed to those based on a fixed number of shares.
2010 Equity Awards | 2009 Equity Awards
Committee Compensation
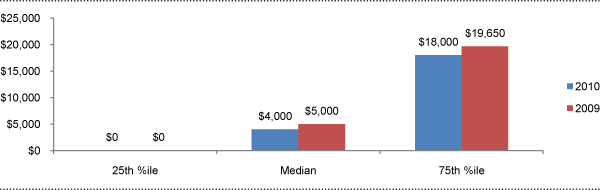
During 2010, median committee member compensation was generally consistent with 2009ii. Our research also found that approximately one-third of companies studied pay no committee-specific fees to members of any of the 3 major committeesiii.
Committee Member Compensation
CAP Perspective:
We expect the trend away from committee member fees to continue, with the value being rolled into board cash or equity retainers, as many companies now view all Board members as active participants in committee-level work.
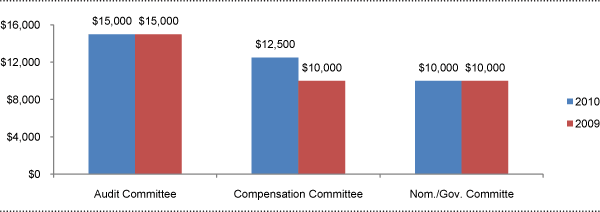
At median, additional compensation for committee Chairs remained flat for the Audit and Nominating / Governance committees, and rose by 25% for the Compensation Committee, driven by increased time requirements and scrutiny of executive compensation.
Median Additional Compensation for Committee Chairs
Lead/Presiding Directors and Non-Executive Chairs of the Board
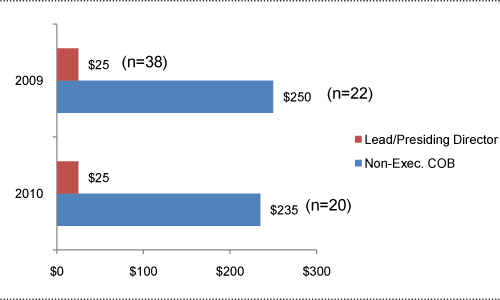
During 2010, the prevalence of additional compensation for Lead/Presiding Directors and non-Executive Board Chairs remained flat as compared to 2009. While, at median, additional compensation for Lead/Presiding Directors remained flat, additional compensation for non-Executive Chairs decreased slightly.
Median Additional Compensation for Board Leadership Roles ($000s) (excl. 0s)
CAP Perspective:
While not all non-executive Board leaders receive additional pay for the role, prevalence of additional compensation for these roles is expected to increase over time. The differential in pay between Lead/Presiding directors and non-Executive Chairs is in line with the typically different responsibilities of each position.
Conclusion
As shown above, there was nominal change in director pay levels and practices year-over-year (2010 vs. 2009) among the largest public U.S. corporations.
It is important for companies to regularly evaluate their overall non-employee director compensation program, or risk falling behind the curve in regards to desired relative market positioning and best in class program design. While reviews should be conducted regularly, it is usually unnecessary for design or pay level changes to take place more often than every 2-3 years.
CAP will release its full report on non-employee director compensation during Fall 2011. The report will provide a detailed analysis of year-over-year changes in pay levels, pay practices and other program design considerations, as well as a discussion of best in class director compensation program setting process.
- i Compensation reflects all cash and equity compensation for Board and committee service, excluding compensation for additional leadership roles such as committee Chair, Lead/Presiding director, or non-executive Chair of the Board.
- ii Reflects all compensation for committee member service (excludes additional fees for leadership roles), across all Board committees.
- iii Audit, Compensation and Nominating / Governance committees.
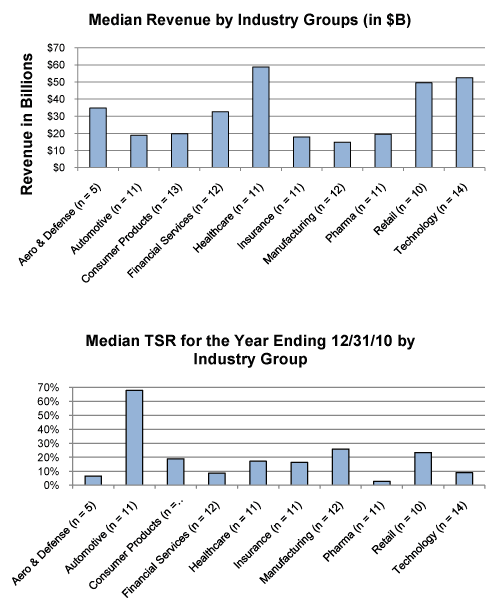
For the 111 company sample, median revenue was $27B, market capitalization was $30B and Total Shareholder Return (TSR) was 16% for 2010.
What We Found
Highlights of our research findings are below. Most companies did not make sweeping changes to their executive compensation programs. But many companies continued to refine annual and long-term incentive plans to strengthen the alignment between executive rewards and financial performance and to focus executives on the overall health of the organization.
Compensation Strategy Changes
Similar to 2009, most companies did not make significant changes to their compensation strategy. Financial Service firms were more likely to make changes to the strategy (e.g., increase at-risk pay) as they emerged from compensation restrictions imposed by TARP.
Peer Groups Used For Benchmarking
In 2010, companies continued to review and modify their peer group, although wholesale changes were not the norm. Approximately 40% of companies made some modification to their peer group by selecting peers that more closely aligned with their size and business mix. Pharmaceutical companies, in particular, continued to make changes to the peer group as industry consolidation continued.
Base Salary Actions
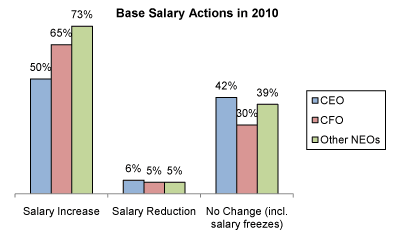
2010 saw the return of salary increases for senior executives with a majority of companies providing salary increases to Named Executive Officers (NEOs) in 2010 (vs. 20% in 2009) as the economy improved. Within the NEO ranks, companies provided increases more frequently to executives below the CEO as they focused on retaining top talent and remaining competitive with the market. Salary reductions were most prevalent in companies that emerged from TARP, as these companies reverted to a compensation mix that provides a greater emphasis on incentive-based pay. Fewer companies froze base salaries for NEOs in 2010; companies in the Consumer Goods, Retail and Technology industry groups were more likely to maintain salaries at 2009 levels.
Annual Incentive Plan Design
Approximately 50% of companies disclosed a change in 2010 or planned changes for 2011 to their annual incentive plan design. Companies continued to refine the metrics and weightings that determine plan funding and payout as pay for performance remains a major focus for companies. 26% of companies increased the target annual incentive opportunity for at least one NEO illustrating that companies are focusing on the competitive market given the improvements in the economy. Although changes to annual incentive plans vary by company, there continues to be an attempt to reward executives based on appropriate indicators of company success.
The chart below presents the reported AIP changes:
| % of Cos. Reporting Changes | |||
| Type of Change Reported in CD&A | No. of Cos. | 2010 (n = 57) | 2009 (n = 34) |
| Change in performance metrics used to fund awards | 19 | 33% | 44% |
| Change in performance metric weighting mix* | 10 | 18% | n/a |
| Increased target award opportunities | 15 | 26% | 26% |
| Adopted / amended annual incentive plan | 13 | 23% | 6% |
| Modified performance scale | 6 | 11% | n/a |
| Reduced maximum award payout leverage | 2 | 4% | 12% |
| Other changes | 9 | 16% | 9% |
Note: Percentages do not add up to 100% due to multiple responses.
* Not captured separately in 2009 and is included in preceding category.
Change in Performance Metrics
Of the 19 companies that made changes to performance metrics, most (10 companies) added metrics to the plan design. Additionally, 10 companies changed the weighting of the AIP metrics. In general, these changes were focused on basic company performance indicators such as profitability and cash flow. For example,
- Computer Sciences: Added free cash flow as a measure to emphasize the importance of liquidity and profitability
- Morgan Stanley: Added capital adequacy and credit rating measures to the metrics used to determine financial achievements
- Visteon: Added product quality and free cash flow as performance metrics
Many companies added cash flow as an annual incentive metric in 2010 indicating that in the wake of the recent economic downturn, companies are balancing profitability with liquidity.
Annual Incentive Plan Metrics
In 2010, the most common metrics used across all industry groups were revenue or revenue growth, EPS and cash flow. Cash flow was one of the three most common metrics in five industry groups (Automotive, Consumer Goods, Manufacturing, Pharmaceuticals and Technology). More than other industries, annual incentive metrics for insurance companies tend to focus on industry-specific measures. The most prevalent metrics in the Automotive industry are cash flow and return on assets (ROA) denoting a focus on company operating performance during the economic recovery.
The three most prevalent metrics for each industry group are detailed below:
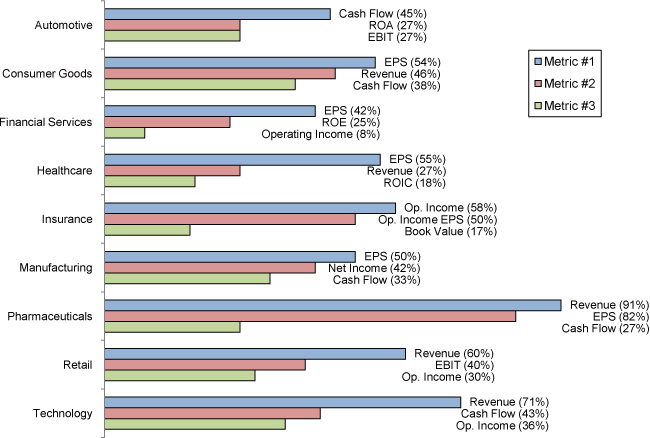
Note: Excludes Aerospace and Defense due to limited sample size (n = 5).
2010 Bonus Payout Details
Nearly all companies (95%) paid a bonus to an NEO for 2010. Most companies (90%) used financial performance to calculate the payout, although many of these companies (19%) also used discretion (positive and negative) to account for non-financial performance. Actual bonus payouts for CEOs on average were approximately 135% of the target incentive opportunity for 2010, indicating a rebound in financial performance in 2010 over 2009.
Long-Term Incentive Plan Design
A majority of companies (approximately 70%) reported making changes to their long-term incentive plan designs in 2010 or for 2011. Similar to the annual incentive plan changes, many companies (32%) reported changes to the performance metrics used to determine award payouts. 26% of companies reported changes to the LTI vehicle mix, with companies placing more emphasis on performance-based awards. This suggests that companies are focusing executives on longer-term goals. The table below outlines the reported changes:
| % of Cos. Reporting Changes | |||
| Type of Change Reported in CD&A | No. of Cos. | 2010 (n = 77) | 2009 (n = 60) |
| Changed long-term performance metric | 24 | 31% | 38% |
| Adopted / amended long-term incentive plan | 24 | 31% | n/a |
| Changed mix of LTI award vehicles | 20 | 26% | 55% |
| Added or eliminated LTI vehicle* | 22 | 29% | n/a |
| Changed LTI award opportunity level | 14 | 18% | 20% |
| Changed performance metrics/weighting | 6 | 8% | n/a |
| Other | 17 | 22% | 35% |
Note: Percentages do not add up to 100% due to multiple responses.
* Not captured separately in 2009 and is included in preceding category.
Long-Term Award Mix
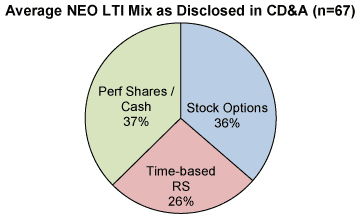
From companies making changes to their LTI award mix, a majority (60%) disclosed that they increased the emphasis on performance by shifting a portion of total LTI value from time-based awards (options and restricted stock) to performance-based vehicles. On average, companies are providing approximately 25% of the total LTI awarded to NEOs in time-based restricted stock with the remaining value equally split between performance-based LTI and stock options.
| % of Cos. Reporting Changes | |||
| Type of Change Reported in CD&A | No. of Cos. | 2010 (n = 20) | 2009 (n = 33) |
| Greater emphasis on performance-based awards | 12 | 60% | 55% |
| Reduced emphasis on time-based restricted stock | 7 | 35% | n/a |
| Reduced emphasis on stock options | 5 | 25% | n/a |
| Other | 5 | 25% | 45% |
Long-Term Incentive Prevalence
Although companies making a change indicated they are placing a greater emphasis on performance-based awards, equity awards with time-based vesting continue to be prevalent. The prevalence of stock options and restricted stock with time-based vesting remained relatively flat in 2010, with 74% and 65% of companies using these vehicles, respectively.
Below is the breakdown of overall LTI vehicle prevalence for NEOs in 2010 vs. 2009:
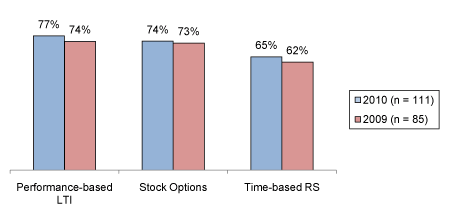
Note: Percentages do not add up to 100% due to multiple responses.
Companies typically grant multiple LTI vehicles to NEOs to offer a balanced program with different performance metrics and time horizons. Most companies (77%) grant two or three award vehicles to provide LTI to executives.
Performance-Based LTI Metrics
For companies using performance-based LTI, TSR (38%) and EPS (35%) continue to be the most prevalent metrics. More companies are incorporating return on capital or return on equity as a metric in 2010 to increase the focus on longer term health/stability and the quality of earnings. The use of revenue and cash flow remained relatively flat year over year.
The chart below displays the prevalence of LTI metrics for performance-based awards in 2010 and 2009:
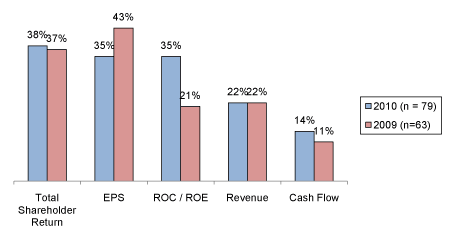
Note: Percentages do not add up to 100% due to multiple responses.
Treatment of Dividend Equivalents
Approximately 40% of companies that grant restricted stock (either time-based or performance-based) and 20% of companies that grant performance shares / units disclose that they pay dividend equivalents to executive officers. Companies typically pay dividends when the shares have vested or are earned.
Conclusions
2010 saw changes to annual and long-term incentive plan design in response to the rebounding economy, greater shareholder scrutiny, as a result of say on pay, and an attempt to further align pay and performance. With the economy on the rebound companies provided more frequent salary increases to NEOs in 2010 and were less likely to freeze base salaries. Companies modified incentive plan metrics, focusing on both company profitability and cash flow. The executive LTI mix continues to shift, with companies reporting more emphasis on performance-based awards. We expect to see companies continue to refine pay programs overall with the objective of strengthening pay and performance linkages and transparency.
To determine if this trend is continuing, Compensation Advisory Partners conducted a study to determine how CFO pay has changed over the last three years and how the year-over-year trends in compensation compare to trends in CEO pay. The study analyzes executive pay data disclosed by early proxy filers and includes 55 US public companies with revenues ranging from $1 billion to $150 billion, with median revenues of $10 billion. Only companies with the same incumbent CEO and CFO from 2008 to 2010 were included in order to focus on year-over-year changes for an individual. Financial services firms were excluded from the study as this industry, in particular, saw the emergence of several atypical compensation arrangements and special awards that were both temporary and unique to the financial services industry.
Our findings, summarized below, indicate that CFO pay is generally moving at the same rate as CEO pay. Salaries are increasing at a slightly faster rate for CFOs but incentive compensation, both annual and long-term, is moving at the same rate for CFOs and CEOs, illustrating that incentive levels are tied to company results. For 2010, incentives are up for both CFOs and CEOs, reflective of a slowly rebounding economy.
Study Results
Salaries
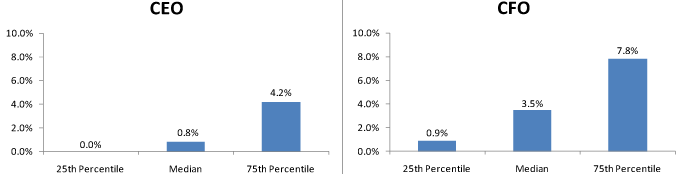
In 2010, 78% of CFOs received salary increases at a rate of 3.5% at median and 7.8% at the 75th percentile. In comparison, only 55% of CEOs received salary increases at lower levels (0.8% at median and 4.2% at the 75th percentile). The prevalence of no salary increases also rose among CEOs from 40% in the 2008-2009 period to 46% in the 2009-2010 period while for CFOs, the prevalence of no salary increases decreased to 22% in the 2009-2010 period versus 31% in the 2008-2009 period.
Salary Increase Prevalence
| 2008-2009 | 2009-2010 | |||
| No Increase | Increase | No Increase | Increase | |
| CEO | 40.0% | 60.0% | 45.5% | 54.5% |
| CFO | 30.9% | 69.1% | 21.8% | 78.2% |
2010 Salary Increases
Actual Pay Levels
Overall, actual total direct compensation (salary plus actual annual incentive plus the present value of long-term incentives) for both CFOs and CEOs slightly declined in 2009 and subsequently rebounded in 2010, as illustrated by the chart below. CFO pay fell at a slightly higher rate in 2009 and increased at a higher rate in 2010 compared to CEO pay. The rise in 2010 pay levels was primarily due to increases in incentive (performance-based) compensation. Bonuses increased by approximately 16% and LTI increased by 14% – 19%. These increases in incentive compensation are most likely reflective of the recovering economy, improvements in company financial performance and rebounding stock prices.
Median Percentage Change in Pay Components
| 2008-2009 | 2009-2010 | |||
| CEO | CFO | CEO | CFO | |
| Salary | 0.7% | 2.0% | 0.8% | 3.5% |
| Actual Bonus | -3.1% | 3.5% | 16.3% | 15.6% |
| Long-Term Incentives | -2.4% | -5.7% | 13.7% | 18.6% |
| Actual Total Direct Comp. | -4.7% | -5.2% | 18.3% | 23.3% |
Financial Performance (Median Levels)
| Year | Total Shareholder Return (as of 12/31) | 1-Year Revenue Growth | 1-Year Revenue Growth |
| 2008 | -32% | 8% | 2% |
| 2009 | 26% | -8% | -6% |
| 2010 | 21% | 9% | 19% |
While movement in pay among CFOs and CEOs was directionally similar, on average, CFO actual total direct compensation was generally 30 – 35% of CEO actual total direct compensation over the last three years.
Target Pay Mix
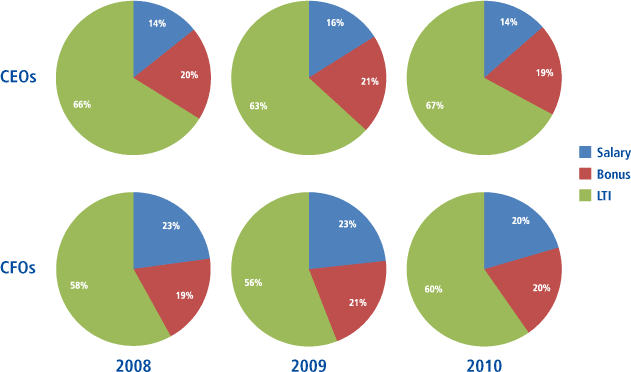
When considering compensation at target levels, the pay mix remained largely unchanged from 2008 to 2010, with a greater emphasis on at-risk pay for CEOs than for CFOs. The pay mix for CFOs slightly shifted towards incentive-based compensation (from 77% in 2008 to 80% in 2010) showing that the pay mix for CFOs is moving closer to that of CEOs.
Long-Term Incentive (LTI) Vehicle Prevalence
The majority of companies awarded LTI to both CEOs and CFOs using at least two vehicles. The prevalence of stock options in the LTI mix declined over the 3-year period while the prevalence of performance-based awards increased. Overall, 83% of CFOs and 85% of CEOs received some form of performance-based awards as part of their LTI program in 2010.
Number of LTI Vehicles Used in 2010
| % in Total | ||
| CEO | CFO | |
| 1 | 13% | 15% |
| 2 | 61% | 54% |
| 3 | 26% | 31% |
| Average | 2 | 2 |
Long-term Incentive Mix
The majority of LTI continues to be delivered in the form of stock options and performance-based LTI, with less emphasis on restricted stock.
LTI Mix
| 2008 | 2009 | 2010 | ||||
| CEO | CFO | CEO | CFO | CEO | CFO | |
| Stock Options | 44% | 41% | 39% | 39% | 34% | 31% |
| Time Vested Restricted Stock | 16% | 22% | 17% | 20% | 17% | 20% |
| Perf. Based LTI | 40% | 37% | 43% | 41% | 49% | 48% |
Conclusion
In the last two years, trends in CFO pay have been directionally aligned with trends in CEO pay. The target pay mix for CFOs has slightly increased the emphasis on incentive compensation relative to fixed compensation, moving closer to the pay mix of CEOs. Salaries are increasing at a faster rate for CFOs but incentive compensation is increasing at about the same pace for both CFOs and CEOs, indicating a link to company performance results, and emphasizing that the role of the CFO continues to be important. We expect companies to continue to ensure that they have the right skill set in the CFO role and develop compensation programs that attract and motivate key talent.
Please contact us at (212) 921-9350 if you have any questions about the issues discussed above or would like to discuss your own executive compensation issues. You can access our website at www.capartners.com for more information on executive compensation.
Annual Incentive Plan Metrics
In our June 25, 2010 CAPflash, we noted that the most frequently reported modification in 2010 CD&As was changing performance metrics used to fund annual incentive awards (reported by 15 companies, or 44% of the 34 companies making annual incentive plan changes).
The chart below shows that for all industry groups, the two most common metrics used in annual incentive plan funding are Revenue/Revenue Growth and various measures of earnings, such as Operating Income, EBIT or EPS. In four of the six industry groups, the most prevalent metric used is Revenue/ Revenue Growth. Among Insurance and Healthcare companies, Operating Income and EPS, respectively, are the most prevalent metrics. Strategic goals are used by 67% of the Pharmaceutical companies. Return metrics are rarely used as key funding criteria. ROIC is one of the top metrics in the Healthcare industry, but other industry groups do not commonly use return measures. Excluding financial services companies, 60 companies (82% of 73 companies) use more than one metric to fund annual incentives.
The chart summarizes the three most prevalent metrics used in each industry group:
| Industry | No. of Cos. | Annual Incentive Funding – Most Prevalent Metrics Used | ||
| #1 | #2 | #3 | ||
| Consumer Goods | Rev. / Rev. Growth | EPS | Operating Income | |
| # of Cos. | 13 | 9 | 8 | 7 |
| % of Cos. | 69% | 62% | 54% | |
| Healthcare | EPS | Operating Income | ROIC | |
| # of Cos. | 11 | 4 | 4 | 2 |
| % of Cos. | 36% | 36% | 18% | |
| Insurance | Operating Income | Operating Income EPS | Operating Income ROE | |
| # of Cos. | 12 | 9 | 6 | 6 |
| % of Cos. | 75% | 50% | 50% | |
| Pharmaceuticals | Rev. / Rev. Growth | EPS | Strategic Goals | |
| # of Cos. | 12 | 10 | 10 | 8 |
| % of Cos. | 83% | 83% | 67% | |
| Retail | Rev. / Rev. Growth | EBIT/ EBITDA | Operating Income | |
| # of Cos. | 10 | 3 | 3 | 2 |
| % of Cos. | 30% | 30% | 20% | |
| Technology | Rev. / Rev. Growth | Operating Income | Cash Flow | |
| # of Cos. | 15 | 10 | 5 | 4 |
| % of Cos. | 67% | 33% | 27% | |
| All Industry Groups | Rev. / Rev. Growth | Operating Income | EPS | |
| # of Cos. | 85 | 39 | 28 | 23 |
| % of Cos. | 46% | 33% | 27% | |
Note: Excludes financial services companies due to limited disclosure related to TARP participation/ restrictions. Four companies use a non-GAAP EPS metric.
As financial services companies increasingly come out of TARP, we expect their bonus pool funding to be linked to company profitability and performance expressed in bottom-line metrics as well as risk and capital adequacy metrics. In addition to financial services, many companies are making efforts in their plan design to offset any potential inappropriate risk taking by focusing on metrics used, time horizons, deferrals and performance sensitivities.
Long-Term Incentive Vehicles
In our June CAPflash, we found that the biggest change reported by companies with regard to long-term incentive practices was the mix of award vehicles.
Stock options are the most prevalent LTI vehicle used among the 85 companies studied, used by 62 companies (or 73%). Both Time Based Restricted Stock (“TBRS”) and Long-term Performance Plans (“LTIPs”) are also frequently seen, used by 53 and 51 companies, respectively (62% and 60%).
Here is the breakdown of overall LTI vehicle prevalence:
| Long-Term Incentive Vehicle Prevalence | No. of Cos. | % of Cos. (n=85) |
| Stock Options | 62 | 73% |
| Time-Based Restricted Stock (TBRS) | 53 | 62% |
| LTIP | 51 | 60% |
| Performance-Based Restricted Stock (PBRS) | 31 | 36% |
| Performance-Based Stock Options (PBSO) | 5 | 6% |
Note: Percentages do not add up to 100% due to multiple responses.
As companies continue to make changes to LTI programs they are balancing time-based equity with performance-based equity. Of the 85 companies, 48 use two LTI vehicles in their executive program (56%), 20 use three vehicles (24%), 17 use one vehicle (20%). The two most prevalent vehicle combinations used are:
- 2 vehicles: stock options and LTIP/or PBRS, used by 24 companies (28% of 85 companies), and
- 3 vehicles: stock options, TBRS and LTIP/or PBRS, used by 20 companies (24% of 85 companies)
Below is the breakdown of the combination of LTI vehicles awarded:
|
Combination of LTI Vehicles Used |
||
| # of LTI Vehicles Granted | No. of Cos. | % of Cos. (n=85) |
| 2 Vehicles (Options, LTIP/PBRS) | 24 | 28% |
| 2 Vehicles (Options, RS) | 13 | 15% |
| 2 Vehicles (TBRS, LTIP/PBRS) | 11 | 13% |
| 3 Vehicles (Options, RS, LTIP/PBRS) | 20 | 24% |
| 1 Vehicle (LTIP/ PBRS) | 8 | 9% |
| 1 Vehicle (TBRS) | 5 | 6% |
| 1 Vehicle (Options) | 4 | 5% |
We expect the use of performance-based LTI to continue to increase, modestly, in 2011 and beyond. Stock options will continue to be a part of the LTI mix, but with less emphasis. As the economy stabilizes and recovers, we also expect to see less time-based restricted stock granted at senior executive levels.
Performance-Based Long-Term Incentive Metrics
Of the 65 companies that use an LTIP or Performance Based Restricted Stock or Options, 27 companies use EPS (42%) and 23 companies use Relative TSR (35%) as metrics. We have seen a slight uptick in the use of Relative TSR, given its simplicity and clarity of measurement in a volatile market. Due to the difficultly in goal setting, companies continue to recalibrate performance metrics.
The breakdown of the most prevalent performance based LTI metrics used is as follows:
| LTIP / PBRS / PBSO Metric | No. of Cos. | % of Cos. (n=65) |
| EPS | 27 | 42% |
| Relative TSR | 23 | 35% |
| Revenue / Revenue Growth | 14 | 22% |
| ROC / ROE | 13 | 20% |
| Cash Flow | 7 | 11% |
| Operating Income | 6 | 9% |
Note: Percentages do not add up to 100% due to multiple responses.
Further, of those companies using EPS and Relative TSR, they are most common in certain industries:
- EPS is common in healthcare, consumer goods, pharmaceutical companies
- Relative TSR is common in technology, consumer goods, pharmaceutical companies
Of the companies that use an LTIP or PBRS, 52 companies (83%) pay out in stock.
| LTIP / PBRS Payout | No. of Cos. | % of Cos. (n=63) |
| Stock | 52 | 83% |
| Cash | 25 | 40% |
| Both (Stock and Cash) | 5 | 8% |
Note: Percentages do not add up to 100% due to multiple responses.
Other Long-Term Incentive Provisions
Consistent with broad market norms we also found that a three year time frame for performance measurement and or vesting is common:
- Among the companies that use an LTIP/PBRS, the most common performance period is 3 years (86% of those providing)
- 37% of companies granting stock options use 3 year installment vesting
- 36% of companies granting time based RS use a 3 year vesting period, with cliff vesting somewhat more prevalent than installment vesting
Conclusions
Companies are continuing to evaluate and modify executive annual incentive and long-term incentive plans. We expect to see continued modest shifts in LTI programs, as companies continue to evaluate the appropriateness of specific LTI vehicles in light of the recovering market, accounting cost vs. employees’ perceived value, and overall pay strategy. The increased emphasis on performance-based compensation will prevail through 2011 as shareholders continue to demand clear alignment between pay and performance.
Please contact us at (212) 921-9350 if you have any questions about the issues discussed above or would like to discuss your own executive compensation issues. You can access our website at www.capartners.com for more information on executive compensation.
- A review of current director pay practices among the largest public U.S. corporations, generally considered trend setting organizations
- Observations regarding trends and outlook
- The Report’s Best in Class Director Compensation Process / Practices, listed below, provide a strong foundation for non-employee director compensation programs at organizations of any size/industry
- This report was authored by Dan Laddin and Matt Vnuk, with research assistance from Shaun Bisman, Meredith St. Lawrence, Deep Patel, Harsha Raghunath, and Devika Ray. Questions and comments should be directed to Dan Laddin or Matt Vnuk at [email protected] or (212) 921-9359, [email protected] or (212) 921-9364
Additional information on Compensation Advisory Partners can be found in the Company Profile section of the Appendix
Table of Contents
Executive Summary
Pay Levels
- Board Member Total Compensation
- Board Cash Retainers
- Board Meeting Fees
- Committee Member Compensation
- Total Board Cash Compensation
- Value of Equity Awards
- Committee Chair Compensation
- Non-Executive Board Leadership (additional compensation)
Pay Practices
- Mix
- Equity Vehicle Type
- Denomination of Equity Awards (fixed value vs. fixed shares)
- Vesting of Equity Awards
- Non-Executive Board Leadership (additional compensation)
Other Program Design Considerations
- Total Company Cost (of Board oversight)
- Board Membership and Meetings
- Committee Membership and Meetings
- Stock Ownership Guidelines (requirements)
- Benefits and Perquisites
Appendix
- Board Member Total Compensation (industry medians)
- Methodology
- Public Fortune 100 Companies
- Company Profile (Compensation Advisory Partners)
Executive Summary
- Best in Class Director Compensation Process / Practices
- Notable Findings / Outlook
- Elements Studied
Executive Summary | Best in Class Director Compensation Process / Practices
Process – Independent Directors Should:
- Establish a process to determine director pay levels and structure in an informed, deliberate and objective way, with consideration given to market data, trends and outlook
- Define target market positioning for total pay
- Target should typically align with executive compensation philosophy
- “Market” should reflect the peer group used for executive compensation benchmarking and/or size-appropriate general industry data; at times, other reference points may also be appropriate
- Use compensation as a tool to align the interests of non-employee directors and long-term shareholders
Practices – Compensation / Governance Committees Should:
- Align pay levels with an organization’s size and complexity; in turn, provide appropriate pay for time and responsibilities
- Review director pay programs focusing on aggregate pay (Total Board Compensation), with consideration given to:
- The ratio of cash compensation to equity compensation
- Additional pay for Board leadership roles
- Structure pay so that equity represents at least half of the total; however, the pay program should:
- Not be highly leveraged
- Be viewed as a “management fee”
- Establish meaningful equity ownership requirements that must be achieved within, at most, 5 years
- Eliminate benefit / perquisite programs unless there is a strong business case for maintaining them
- Provide detailed disclosure of the director compensation philosophy and rationale for the program
Executive Summary | Notable Findings / Outlook
Looking Back – While workload increased over the past couple of years, dramatic economic changes and poor performance increased scrutiny and debate in regard to director pay programs. Therefore, it is not surprising that this year’s study found:
- Conservative increases in pay levels; from 2008 to 2009 Total Board Compensation increased 4 percent, at median
- Year-over-year, no change in median pay mix
- Reduction in the prevalence of meeting fees, which were already minority practice
- Increase in the prevalence of full-value equity awards, with a corresponding decrease in the prevalence of stock options
- Increase in the prevalence of equity awards based on a fixed value, with a corresponding decrease in equity awards based on fixed number of shares
- At least one full-value equity award will not be transferred until retirement at approximately 50% of companies studied
Looking Ahead – Over the next few years, changes in director compensation will take place in terms of both pay levels and program design; specifically:
- Low-to-mid single digit annual increases in Total Board Compensation
- More companies moving to a fixed cash pay structure, with related:
- Decreases in the prevalence of meeting fees, especially Board meeting fees
- Slow / gradual decrease in the prevalence of committee member compensation
- Continued growth in prevalence of full-value equity awards, with corresponding decreases in the prevalence of stock option awards
- Increases in equity awards based on a fixed value, with corresponding reductions in equity awards based on fixed number of shares
- Increased use of, and modifications to, stock ownership guidelines / requirements
- Continued growth in the prevalence of hold until / transfer at retirement equity award provisions
It is important for companies to comprehensively evaluate their director compensation programs regularly, or risk falling behind the curve in regards to desired relative market positioning and best in class program design. While reviews should be conducted regularly, it is usually unnecessary for major design changes to take place more often than every 2 –3 years.
Note: there will be a follow-up CAPFlash made available in early 2011 discussing the top 5 director compensation considerations for the next year.
Executive Summary | Elements Studied
CAP’s consulting staff reviewed current director compensation programs for each of the public Fortune 100 companies.
- The Fortune 100 reflects the largest U.S. corporations based on annual revenue (93 are public companies); see Appendix for a list of the 93 companies in this year’s survey
- “CAP Observations,” included throughout this report, provide commentary on trends and outlook
Elements Studied:
- Annual Cash Retainer
- Total Board Meeting Fees; per meeting fee times the number of meetings
- Committee Member Compensation; all meeting fees and retainers
- Total Board Cash Compensation; sum of cash retainer, total Board meeting fees and average committee member compensation
- Equity Awards (stock retainer); full-value shares/equivalents and stock options
- Total Board Compensation; sum of Total Board Cash Compensation and Equity Awards
- Total Company Cost (of Board oversight); Total Board compensation times number of non-employee directors plus additional/premium pay for committee leadership (Chair) roles and additional/premium pay for independent Board leadership roles (presiding / lead director or non-executive chair)
2010 Study Also Provides Data / Analysis On:
- Equity grant practices, compensation for leadership positions, stock ownership guidelines, perquisites/benefits, and industry pay practices
Note: Total Board Cash Compensation includes committee member compensation (excludes additional/premium meeting fees or retainers paid for chairing a committee) as the trend is towards companies building fees for basic committee service into annual Board fees/retainers. Further, committee member compensation is typically cash-based.
Executive Summary | Elements Studied (Continued)
While this analysis of Fortune 100 data focuses on the group of companies as a whole, industry specific practices were also reviewed (click here to see the list).
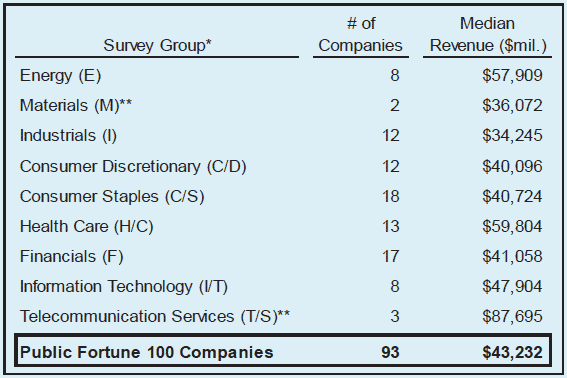
* Industry groups were determined by GICS code.
** Due to limited number of companies, revenue listed reflects industry average, not median.
Pay Levels
- Board Member Total Compensation
- Board Cash Retainers
- Board Meeting Fees
- Committee Member Compensation
- Total Board Cash Compensation
- Value of Equity Awards
- Committee Chair Compensation
- Non-Executive Board Leadership (additional compensation)
Pay Levels | Board Member Total Compensation
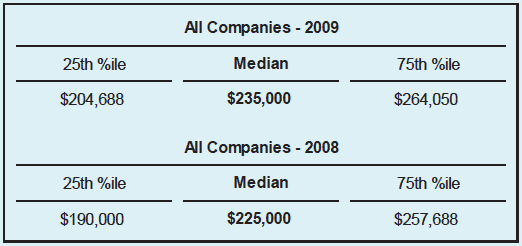
Between 2008 and 2009, basic compensation for service as a Board member (Total Board Compensation) increased approximately 4 percent, from $225,000 to $235,000 (at median).
- Reflects all cash and equity compensation, excluding compensation for additional leadership roles such as committee Chairman, Lead/Presiding director or non-executive Chairman of the Board
- CAP’s director compensation best practices (p.5) state that director compensation should be reviewed focusing on aggregate pay
CAP Observation:
- Director compensation levels increased substantially several years ago following the new demands of Sarbanes-Oxley, but pay has recently leveled off
- As a result of increased director workloads, during each of the next few years, we expect to see low-to-mid single-digit increases in Total Board Compensation
- We also expect to see more companies adopt a fixed cash pay structure
Pay Levels | Board Cash Retainers
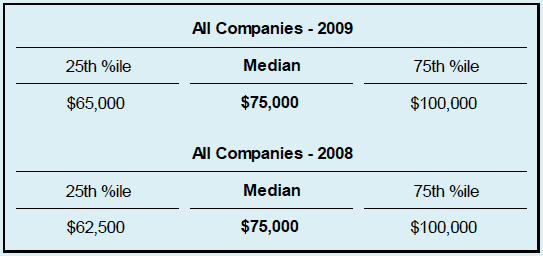
The value of annual Board cash retainers remained constant over the past 2 years, at median.
- 98 percent of companies studied provide an annual cash retainer
CAP Observation:
- Once 2010 director pay levels are available, in part due to more companies moving to a fixed cash pay structure, we expect to see a small to moderate increase in the median value of annual cash retainers, as compared to 2009
Pay Levels | Board Meeting Fees
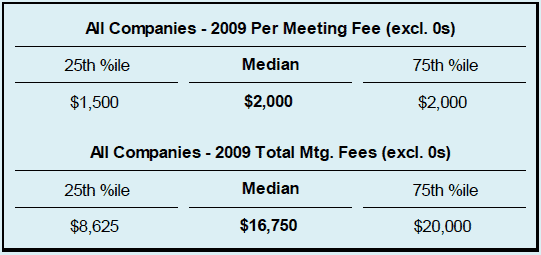
Board meeting fees are a minority practice, provided by only 23 percent of companies studied in 2009. Therefore, the median Board meeting fee in 2009 was zero.
- Of the companies studied that provide Board meeting fees, some only do so for special meetings or for meetings in excess of a minimum number
- Only 19 percent of companies studied provided Board meeting / attendance fees for all regular Board meetings
- This is down from 21 percent in 2008
- Among those companies paying meeting fees for all regular Board meetings, the median fee in 2009 was unchanged from 2008
CAP Observation:
- The practice of using Board meeting fees continues to decline in prevalence, partly in reaction to difficulties in defining what constitutes a “meeting” (e.g., ad hoc teleconferences)
- Companies that eliminate meeting fees typically provide an increased Board cash or equity retainer
- We expect to see more companies simplify their director compensation programs and eliminate meeting fees, moving towards a more fixed cash pay structure / “management fee”
Pay Levels | Committee Member Compensation
From 2008 to 2009, committee member compensation increased slightly, about 5 percent at median; reflects average compensation received by a director for all committee member service (includes 0s).
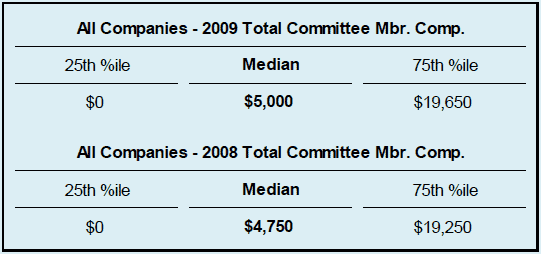
- Over 35% of companies studied pay no committee-specific fees to members of any of the 3 major committees
- The median committee meeting fee for each of the Audit, Compensation and Nominating / Governance committees is $0
- The median committee member retainer at the Audit Committee is $10,000, but is $0 at the Compensation and Nominating / Governance committees
- Most often, the Audit Committee involves the largest workload; however, over recent years workload has been becoming less differentiated between the 3 major Board committees
CAP Observation:
- Many companies are shifting, or have shifted, committee member fees to the annual Board cash or equity retainer, viewing all Board members as active participants in Board matters / committee-level work
- In 2010, we may see moderate decreases in committee member compensation, primarily due to additional companies shifting committee-specific (member) fees to the annual Board cash or equity retainer
Pay Levels | Total Board Cash Compensation
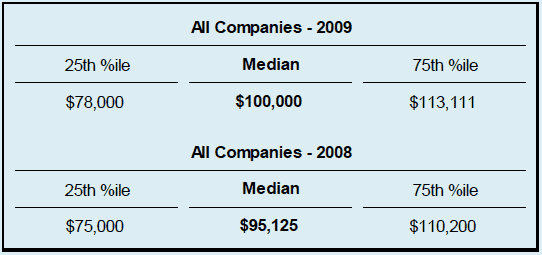
From 2008 to 2009, Board cash compensation[1] increased approximately 5 percent.[2]
- 98 percent of companies studied provide annual cash compensation to non-employee directors
CAP Observation:
- In 2010, we expect to continue to see moderate increases in Board cash compensation
Pay Levels | Value of Equity Awards
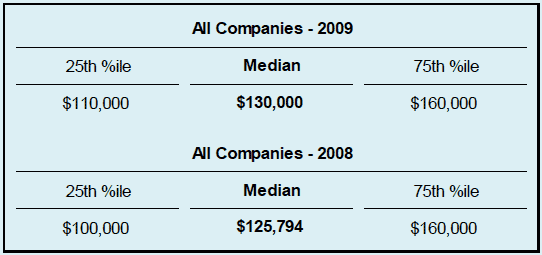
Despite rebounding equity markets, from 2008 to 2009 the median value of equity awards increased only 3 percent, due largely to the majority practice of granting equity awards based on a fixed value.
- Granting equity awards is as near universal practice, with about 95 percent prevalence among companies studied
- Initial at-election equity awards, meant to “ramp up” director equity ownership and alignment with shareholders, as well a recruitment tool, are a minority practice (under 20 percent of companies studied)
- From 2008 to 2009, there was a small decrease in the prevalence of initial at-election equity awards
- During 2009 a small number of companies (ex: Apple and Caterpillar) intentionally reduced or eliminated equity awards
- Apple switched from granting a fixed number of stock options annually to a fixed value award of restricted stock units
- Caterpillar discontinued annual equity awards, but instituted a stock ownership requirement
CAP Observation:
- From 2009 to 2010, we expect to see a:
- Moderate increase in annual equity award values
- Continued decrease in the prevalence of initial at-election equity awards
Pay Levels | Committee Chair Compensation
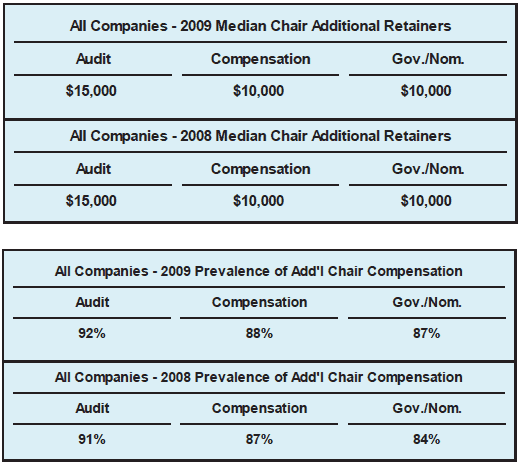
From 2008 to 2009, the median value of additional retainers for committee Chairs (retainer value in-addition to that provided to committee members) remained constant.
- The total value of Chair retainers was also reviewed, and also remained constant from 2008 to 2009
- Chart below excludes zeros
CAP Observation:
- If workload between the major Board committees continues to become less differentiated, there may be less differentiation in additional / premium retainers for the Chairs of the major Board committees
- In 2009, approximately 20 percent of Fortune 100 companies did not differentiate additional / premium pay for the Chairs of the 3 major Board committees, and about another 10 percent of Fortune 100 companies did not differentiate additional / premium pay between the Chairs of the Audit and Compensation committees
Pay Levels | Non-Executive Board Leadership (additional compensation)
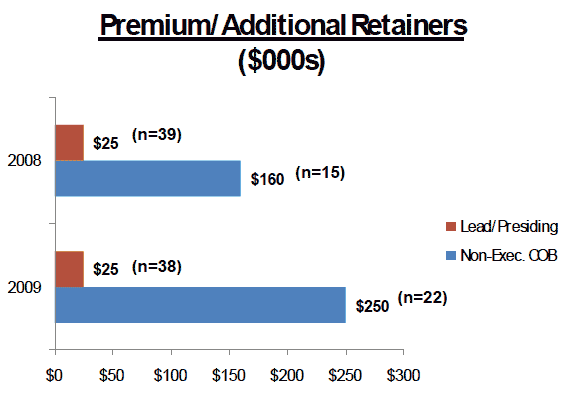
At median, the premium / additional retainer paid to non-executive Chairmen is 10 times that paid to Lead / Presiding directors.
- The median additional retainer for Lead / Presiding directors was consistent from 2008 to 2009 (excludes zeros)
- The median additional retainer paid to non-executive Chairman increased from 2008 to 2009 (excludes zeros); year-over-year, there were also more non-exec. COBs receiving additional pay
- While it is common to pay an additional retainer to independent Board leaders, not all receive an additional retainer
- It is most common to provide additional pay to a non-executive Chairman, and less common to do so for Presiding directors
- Prevalence of additional pay for Board leadership roles increased year-over-year
- Under 5 percent of companies providing additional pay do so for both a Lead / Presiding director and a non-executive Chairman
CAP Observation:
- When determining compensation for a Board leadership position, it is important to consider:
- Does the role merit a premium based on scope of responsibilities, workload, visibility, influence, etc.?
- How do the role / responsibilities relate to that of committee Chairs?
- While not all non-executive Board leaders receive additional pay for the role, prevalence is expected to continue increasing
- The differential in pay between Lead / Presiding directors and a non-executive Chair is in-line with the typically different responsibilities of each position
Pay Practices
- Mix
- Equity Vehicle Type
- Denomination of Equity Awards
(fixed value vs. fixed shares) - Vesting of Equity Awards
- Non-Executive Board Leadership
(additional compensation)
Pay Practices | Mix
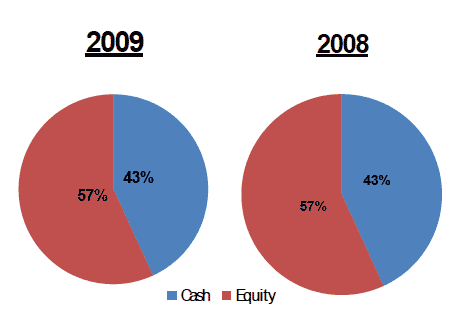
Over the past 2 years, cash versus equity pay mix has remained constant, with equity representing a majority of pay.[3]
- Reflects all cash and equity compensation, excluding compensation for additional leadership roles such as committee Chairman or independent Board leader (Lead / Presiding Director or non-executive Chairman of the Board)
- CAP’s Best in Class Director Compensation Process / Practices (p.5) state that independent directors should structure pay so that equity represents the majority of compensation
Both on average and at median, the weighting of the various elements of Total Board Compensation was nearly consistent between 2008 and 2009.
- Includes cash retainer, Board meeting fees, stock options, full-value equity awards, and committee member compensation
CAP Observation:
- Once 2010 director pay levels are available, we expect to see the portion of pay delivered in equity-based compensation to be similar to 2008 and 2009, with a slight increase possible
- Equity-based compensation aligns director pay with wealth created or lost for shareholders, especially when the equity-based pay is required to be held for an extended period of time
- Additionally, during 2010 we expect that the overall pay mix will remain relatively constant; however, over the next few years, we expect the weighting of stock options and committee member compensation to decrease even further, with a corresponding increase in full-value equity awards and cash retainer
Pay Practices | Equity Vehicle Type
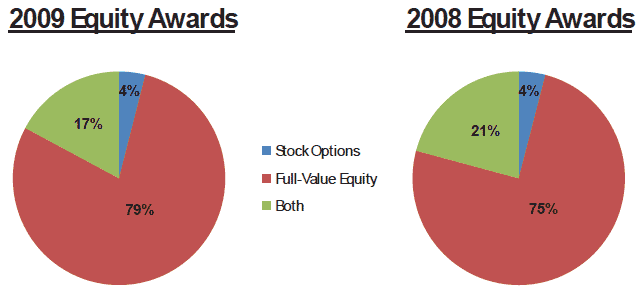
From 2008 to 2009, the prevalence of stock option awards declined (less companies granted both full-value equity awards and stock options), with a corresponding increase in the prevalence of full-value equity awards.
- As compared to full-value awards, stock options are both more leveraged and more likely to be granted based on fixed number of shares (rather than based on a fixed value)
- Stock option values and equity awards based on a fixed number of shares are strongly affected by swings in stock price
- Two companies granted performance-based equity awards to directors in 2009, Intel and Coca-Cola
CAP Observation:
- As companies move more towards viewing director compensation as somewhat of a “management fee,” combined with a strong focus on risk management, we expect to see a continued move toward increased use of full-value equity awards
- However, practices vary by industry and we do not expect the use of stock options to stop completely; i.e., in some industries the prevalence of stock option awards is greater than others and/or that seen in general industry data
- While two companies studied granted performance-based equity awards to directors during 2009, we do not expect this to become a trend
Pay Practices | Denomination of Equity Awards (fixed value vs. fixed shares)
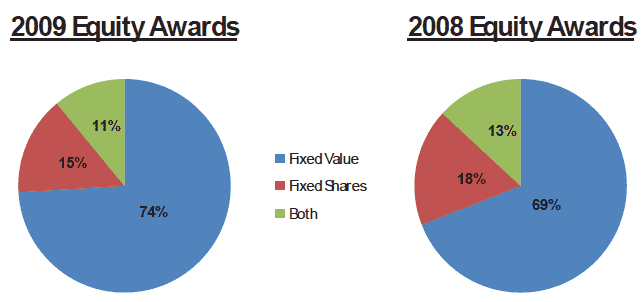
Director equity awards are based on either a fixed value or a fixed number of shares. From 2008 to 2009, the prevalence of fixed value equity awards increased 5 percent, accounting for nearly three quarters of all equity awards.
- When equity awards are based on a fixed value, the number of shares / options granted changes each year, but the grant date value remains constant; however, when equity awards are based on a fixed number of shares, the value of the award changes each year mostly due to changes in stock price, but the number of shares granted remains constant from one year to the next
- Therefore, director compensation is more predictable from one year to the next when equity awards are based on a fixed value
CAP Observation:
- Part of the year-over-year shift is due to the declining prevalence of stock option awards
- Stock options are more likely than full-value equity awards to be based on a fixed number of shares
- Over the past few years, volatile stock prices have helped drive a trend towards fixed value equity awards
- Fixed value equity awards can be viewed as prudent risk management, a predictable way to reach expectations related to director stock ownership, linking long-term director interests with those of shareholders
Pay Practices | Vesting of Equity Awards
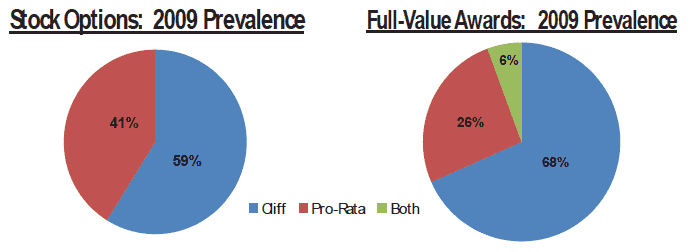
A majority of both stock option and full-value equity awards cliff vest.
- Year-over-year, the percent of stock options with cliff vesting increased, while the percent of full-value equity awards with cliff vesting remained constant
- Both stock options awards and full-value equity awards typically vest after 1 year, at median
- At least one full-value equity award at approximately 50 percent of companies studied will not be transferred to directors until retirement
- Since 2008, the prevalence of this practice has increased
CAP Observation:
- For a number of years, there has been a trend towards declassification of Boards; i.e., one year terms
- Short vesting periods line up with the term of declassified Boards
- Short vesting periods and hold until / transfer at retirement provisions, for director equity awards, are often viewed as best practices
- We expect short vesting periods to remain majority practice, and the prevalence of hold until / transfer at retirement provisions to increase in 2010 and beyond
- Already, the high prevalence of hold until / transfer at retirement provisions is notable
Pay Practices | Non-Executive Board Leadership (additional compensation)
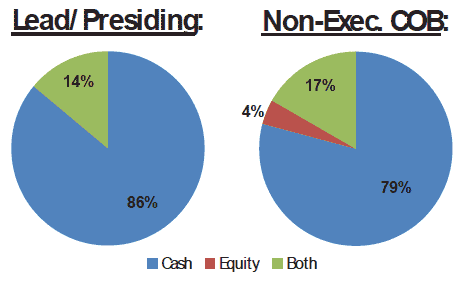
Additional / premium retainers for independent Board leadership roles are most often delivered through additional cash compensation.
CAP Observation:
- We expect cash to continue to be the dominant vehicle for delivering additional compensation for serving in an independent Board leadership role, with the possibility for an increase in equity-based compensation in coming years
Other Program Design Considerations
- Total Company Cost (of Board oversight)
- Board Membership and Meetings
- Committee Membership and Meetings
- Stock Ownership Guidelines (requirements)
- Benefits and Perquisites
Other Program Design Considerations | Total Company Cost (of Board oversight)
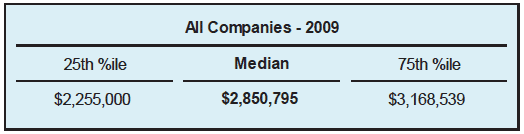
Total Company Cost can be a useful secondary reference point when reviewing non-employee director compensation.
- Includes the sum of cash retainers, equity awards, committee fees, and Board leadership fees received by each non-employee director
CAP Observation:
- Generally, the cost of Board oversight drops as the size of an organization increases, measured as a percent of revenue
Other Program Design Considerations | Board Membership and Meetings
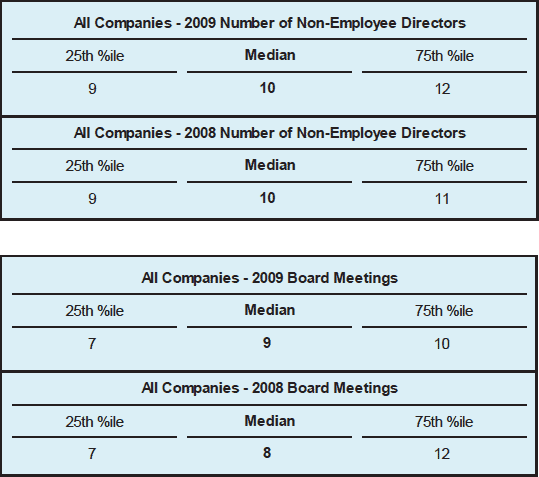
Between 2008 and 2009, at median, the size of Boards remained constant; however, Board activity marginally increased based on median number of meetings.
CAP Observation:
- Over the past decade, the typical size of a Board shrunk, in part based on new proxy disclosure requirements; i.e., increased discussion of qualifications, required discussion of any director attending less than 75 percent of meetings, etc.
- As the year-over-year data shows, the size of Boards seems to have stabilized
- Currently, the size of Boards is manageable
- Work loads have generally been increasing
- It is typical for all directors to be take part in Board work / activities / decision making
Other Program Design Considerations | Committee Membership and Meetings
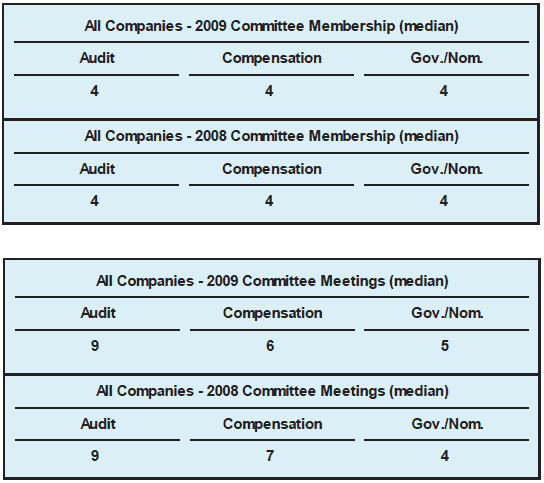
Across the 3 major committees, membership / size is consistent; however, activity based on median number of meetings is not consistent, with the Audit Committee being the most active.
CAP Observation:
- An increasing amount of work is being done outside of official committee meetings, and not all meetings are created equal (in terms of time spent, topics covered, etc.)
- Therefore, we find that number of meetings is only one component of judging total committee activity / time commitment / workload
Other Program Design Considerations | Stock Ownership Guidelines (requirements)
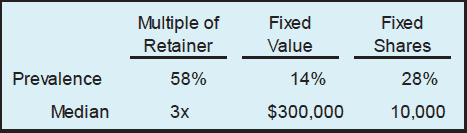
Nearly 90 percent of companies studied have stock ownership guidelines, and nearly 80 percent of companies studied have formal stock ownership guidelines.
- Formal stock ownership guidelines reflect requirements stated as either: (i) a multiple of the annual Board cash retainer, the annual Board equity retainer, or both; (ii) a fixed value; or (iii) a fixed number of shares
- Most often, formal stock ownership guidelines are defined as a multiple of the annual cash retainer
- Most companies with formal stock ownership guidelines require non-employee directors to meet the ownership hurdle within 5 years of joining the Board; the next most common period is 3 years
- Non-formal stock ownership guidelines reflect retention ratios and equity awards that are held/deferred until retirement
- The number of companies with retention ratios and/or deferring equity awards until retirement, in addition to formal stock ownership guidelines, has been increasing
CAP Observation:
- Due to volatility, some companies that use either a fixed value-based or fixed share-based formal stock ownership guideline have been implementing an either or approach; either a certain dollar value or a certain number of shares must be owned within a certain number of years
- Other design features that can alleviate the volatility issue are the idea of ownership value vs. investment value and measuring stock price over an extended period of time, rather than at fiscal year-end
- ISS (formerly RiskMetrics Group), regarding non-omnibus director-specific equity plans, expects a minimum ownership multiple of 3 times the annual retainer to be achieved within 5 years of joining a Board
Other Program Design Considerations | Benefits and Perquisites
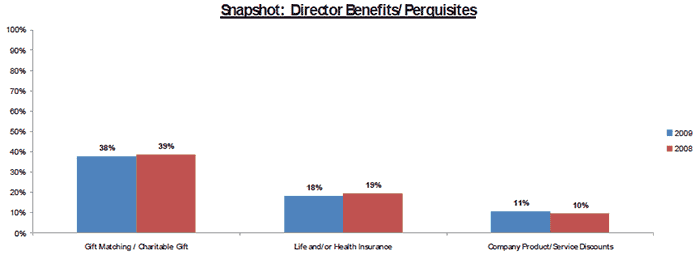
While there was a small decrease in the prevalence of certain director benefit / perquisites (below) over the past year, during both 2009 and 2008 about two thirds of companies studied provided directors with some form of benefit /perquisite.
CAP Observation:
- Many companies have reduced or eliminated perquisites and benefit programs for outside directors, similar to their executives
- We expect that both the prevalence and value of benefits and perquisites will continue to decline; however, where a business case exits, some perquisites / benefits will be maintained
Appendix
- Board Member Total Compensation (industry medians)
- Methodology
- Public Fortune 100 Companies
- Company Profile
Appendix | Board Member Total Compensation (industry medians)
Pay levels and practices were also reviewed, and differ somewhat, by industry.
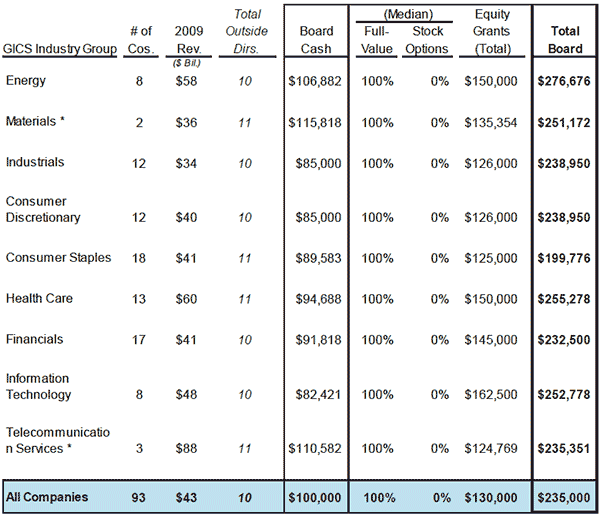
Appendix | Methodology
- It was assumed that every director served on the Board for the entire year and attended all meetings
- Meeting fees were calculated based on the actual number of meetings held
- Annual equity awards were assumed to have occurred on the annual meeting date; stock options were valued based on the FASB Topic 718 (FAS 123R) Black-Scholes value
- Initial at-election equity awards were annualized over 5 years
- Committee compensation includes all Board committees, reflecting actual committee assignments
- If the proxy statement disclosed forward-looking information regarding changes to the compensation structure, the most recent data was used
Appendix | Public Fortune 100 Companies
Company Names & Industry
- IndustryAbbott Laboratories (H/C)
- Costco Wholesale Corporation (C/S)
- Intel Corporation (I/T)
- Prudential Financial, Inc. (F)
- Aetna Inc. (H/C)
- CVS Caremark Corporation (C/S)
- International Assets Holding Corporation (F)
- Publix Super Markets, Inc. (C/S)
- Allstate Corporation, The (F)
- Dell Inc. (I/T)
- International Business Machines Corporation (I/T)
- Raytheon Company (I)
- Amazon.com, Inc. (C/D)
- Delta Air Lines, Inc. (I)
- Johnson & Johnson (H/C)
- Rite Aid Corporation (C/S)
- American Express Company (F)
- Dow Chemical Company, The (M)
- Johnson Controls, Inc. (C/D)
- Safeway Inc. (C/S)
- American International Group, Inc. (F)
- E. I. du Pont de Nemours and Company (M)
- JPMorgan Chase & Co. (F)
- Sears Holdings Corporation (C/D)
- AmerisourceBergen Corporation (H/C)
- Enterprise GP Holdings L.P. (E)
- Kraft Foods Inc. (C/S)
- Sprint Nextel Corporation (T/S)
- Apple Inc. (I/T)
- Express Scripts, Inc. (H/C)
- Kroger Co., The (C/S)
- Sunoco, Inc. (E)
- Archer-Daniels-Midland Company (C/S)
- Exxon Mobil Corporation (E)
- Lockheed Martin Corporation (I)
- SUPERVALU Inc. (C/S)
- AT&T Inc. (T/S)
- Federal Home Loan Mortgage Corporation, The (F)
- Lowe’s Companies, Inc. (C/D)
- Sysco Corporation (C/S)
- Bank of America Corporation (F)
- Federal National Mortgage Association, The (F)
- Marathon Oil Corporation (E)
- Target Corporation (C/D)
- Berkshire Hathaway, Inc. (F)
- FedEx Corp. (I)
- McKesson Corporation (H/C)
- Time Warner Inc. (C/D)
- Best Buy Co., Inc. (C/D)
- Ford Motor Company (C/D)
- Medco Health Solutions, Inc. (H/C)
- Travelers Companies, Inc., The (F)
- Boeing Company, The (I)
- General Dynamics Corporation (I)
- Merck & Co., Inc. (H/C)
- Tyson Foods, Inc. (C/S)
- Cardinal Health, Inc. (H/C)
- General Electric Company (I)
- MetLife, Inc. (F)
- United Parcel Service, Inc. (I)
- Caterpillar Inc. (I)
- Goldman Sachs Group, Inc., The (F)
- Microsoft Corporation (I/T)
- United Technologies Corporation (I)
- Chevron Corporation (E)
- Hartford Financial Services (F)
- Morgan Stanley (F)
- UnitedHealth Group Incorporated (H/C)
- CHS Inc. (C/S)
- Hess Corporation (E)
- News Corporation (C/D)
- Valero Energy Corporation (E)
- Cisco Systems, Inc. (I/T)
- Hewlett-Packard Company (I/T)
- Northrop Grumman Corporation (I)
- Verizon Communications Inc. (T/S)
- Citigroup Inc. (F)
- Home Depot, Inc., The (C/D)
- PepsiCo, Inc. (C/S)
- Walgreen Company (C/S)
- Coca-Cola Company, The (C/S)
- Honeywell International Inc. (I)
- Pfizer Inc. (H/C)
- Wal-Mart Stores, Inc. (C/S)
- Comcast Corporation (C/D)
- Humana Inc. (H/C)
- Philip Morris International Inc. (C/S)
- Walt Disney Company, The (C/D)
- ConocoPhillips (E)
- Ingram Micro Inc. (I/T)
- Procter & Gamble Company, The (C/S)
- WellPoint Inc. (H/C)
- Wells Fargo & Company (F)
Key
- Energy (E)
- Materials (M)
- Industrials (I)
- Consumer Discretionary (C/D)
- Consumer Staples (C/S)
- Health Care (H/C)
- Financials (F)
- Information Technology (I/T)
- Telecommunication Services (T/S)
Appendix | Company Profile
Compensation Advisory Partners LLC (CAP) is an independent consulting firm specializing in executive and director compensation, and related corporate governance matters, with a unique combination of deep expertise and intense client focus. Comprised of senior industry veterans from Mercer and KPMG, CAP’s consultants have served as independent advisor to Boards and senior management at many of the world’s largest and leading companies in the areas of compensation governance, strategy and program design.
- Formed in 2009, CAP’s founding principle is that compensation should be a management tool to help support business strategy. Our consulting experience enables our team to assist companies in creating and implementing defensible, performance-oriented executive compensation programs that meet high governance standards in a changing regulatory environment
- The staff has strong industry sector knowledge and a broad client base, ranging from the largest Fortune 100 multi-nationals to start-up companies across all major industries
- The firm’s breadth of experience and clientele keep it at the forefront of trends and practices in all areas of executive and director compensation
- Compensation Advisory Partners provides Boards of Directors and Compensation Committees best-in-class advice, while also meeting the increasing need to demonstrate the independence and objectivity of that advice from a truly independent platform
- Please contact us at 212-921-9350 if you would like to discuss your own executive or director compensation issues. You can also access our website at www.capartners.com for more information
[1]Sum of cash retainer, total Board meeting fees and average committee member compensation.
[2] Total Board Cash Compensation includes committee member compensation (but excludes additional/premium meeting fees or retainers paid for chairing a committee) as the trend is towards companies building fees for basic committee service into annual Board fees/retainers. Further, committee member compensation is typically cash-based.
[3] Nearly 75 percent of companies studied allow directors the option of exchanging their cash retainer for additional equity-based compensation; this refers to a voluntary value-for-value exchange/deferral, and does not reflect any premium.
[4] Reflects both annual equity awards and initial at-election equity awards.
[5] Reflects both annual equity awards and initial at-election equity awards.
[6] Prevalence at companies with formal stock ownership guidelines.
[7] Due to limited number of companies, data/value reflects an average rather than a median.