Last year, the study showed an increase in compensation for both CEOs and CFOs, but at much lower levels than the prior year. This leveling off of pay was partially driven by a stabilizing economy and increased confidence in goal setting, leading to less volatility in corporate performance results in incentive plans. To determine if this trend is continuing, we conducted a similar study in 2013 using a sample set of 62 US public companies. The study analyzes executive pay data disclosed by companies with revenues ranging from $1 to $145 billion, with median revenues of $9 billion. Only companies with the same CEO and CFO incumbents from 2010 to 2012 were included in order to focus on year-over-year changes for an individual incumbent. Similar to our methodology in prior years, financial services firms were excluded from the study, as this industry’s compensation practices continue to evolve in the years post the financial crisis.
Our findings, summarized below, indicate that overall, increases in total compensation levels for both CEOs and CFOs slowed in 2011-2012 compared to double-digit pay increases in the 2009-2010 period and mid-single-digit increases in the 2010-2011 period. This dramatic slowdown suggests that the halting economic recovery is having an impact. Percentage pay increases in all three years were higher for CFOs compared to CEOs, driven by slightly higher increases in long-term compensation and smaller decreases in annual bonus. The slower rate of growth in CEO compensation may be driven by the continued focus on CEO pay by shareholders and proxy advisory firms and the increased demand for pay and performance alignment. On an absolute basis, CFO pay continues to be approximately one-third of CEO pay.
Study Results
Salaries
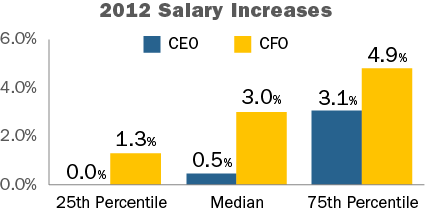
In 2012, approximately 85% of CFOs received salary increases. The median increase was 3.0% and the 75th percentile increase was 4.9%. In comparison, only 53% of CEOs received salary increases and the increases were smaller — 0.5% at median and 3.1% at the 75th percentile. The prevalence of salary increases for CFOs remained similar to last year with about 85% of incumbents receiving a salary increase. Among CEOs, approximately 55% received a salary increase, similar to 2010.
|
Salary Increase Prevalence |
||||||
|
|
2009 – 2010 |
2010 – 2011 |
2011 – 2012 |
|||
|
|
No Increase |
Increase |
No Increase |
Increase |
No Increase |
Increase |
|
CEO |
43.8% |
56.3% |
34.4% |
65.6% |
46.8% |
53.2% |
|
CFO |
25.0% |
75.0% |
12.5% |
87.5% |
14.5% |
85.5% |
Actual Pay Levels
Overall, actual total direct compensation (salary plus actual annual incentive plus the grant date value of long-term incentives) for CEOs and CFOs leveled off in 2011-2012. These lower, single-digit changes in pay levels are consistent with the increased focus on pay for performance we have seen over the last few years. They also likely reflect the slow pace of economic recovery. At the median, salary increases were higher for CFOs than CEOs in 2011-2012. Bonus levels decreased for both CEOs and CFOs and long-term incentives increased modestly (2%) for CFOs and remained flat (0%) for CEOs.
|
Median Percentage Change in Pay Components |
||||||
|
|
2009 – 2010 |
2010 – 2011 |
2011 – 2012 |
|||
|
Pay Components |
CEO |
CFO |
CEO |
CFO |
CEO |
CFO |
|
Salary |
1.0% |
3.7% |
1.8% |
3.5% |
0.5% |
3.0% |
|
Actual Bonus |
19.0% |
22.7% |
0.0% |
3.5% |
-2.8% |
-1.2% |
|
Long-Term Incentives |
10.1% |
14.8% |
10.0% |
10.3% |
0.0% |
2.0% |
|
Actual Total Direct Comp. |
14.4% |
20.0% |
3.6% |
7.5% |
-0.3% |
1.4% |
|
Financial Performance (Median Levels) |
|||
|
Year |
Total Shareholder Return (as of 12/31) |
1-Year Revenue Growth |
1-Year Net Income Growth |
|
2010 |
24% |
10% |
19% |
|
2011 |
5% |
9% |
13% |
|
2012 |
14% |
3% |
2% |
While movement in pay among CFOs and CEOs was directionally aligned, absolute CFO total direct compensation levels, on average, have been approximately 30% of CEO total direct compensation levels over the last three years.
Target Pay Mix
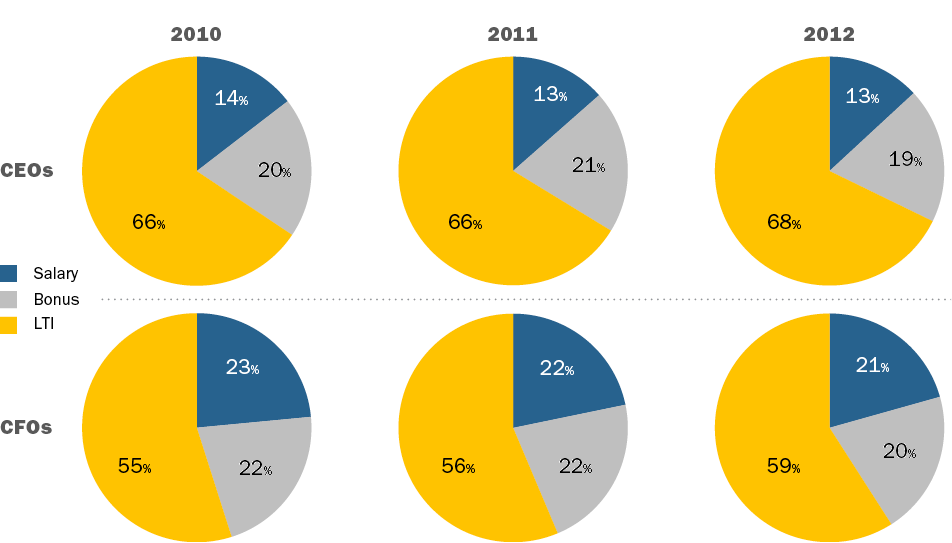
In terms of target compensation levels, the overall pay mix remained largely unchanged from 2010 to 2012, with a greater emphasis on at-risk pay for CEOs than for CFOs.
Long-Term Incentive (LTI) Vehicle Prevalence and Mix
The use of at least two long-term incentive vehicles continues to be the majority practice when awarding LTI to CEOs and CFOs. The role of stock options has remained steady in the overall mix with companies delivering about 30% of LTI using this vehicle. On average, performance-based LTI continues to comprise approximately 50% of LTI for CEOs and CFOs. Data shows that 80% of CFOs and 85% of CEOs received some form of performance-based awards as part of their LTI program in 2012.
|
Number of LTI Vehicles Used in 2012 |
||
|
|
% in Total |
|
|
CEO |
CFO |
|
|
1 |
24% |
17% |
|
2 |
47% |
53% |
|
3 |
27% |
28% |
|
Average |
2 |
2 |
|
LTI Mix |
||||||
|
2010 |
2011 |
2012 |
||||
|
Vehicle |
CEO |
CFO |
CEO |
CFO |
CEO |
CFO |
|
Stock Options |
33% |
30% |
32% |
32% |
30% |
32% |
|
Time Vested Restricted Stock |
20% |
23% |
17% |
22% |
16% |
20% |
|
Perf. Based LTI |
48% |
47% |
51% |
46% |
53% |
48% |
Conclusion
As companies and Boards focus on the alignment between pay and performance, and the economic recovery continues at a slow pace, it is not surprising that pay increases have slowed over the last 3 years. The rates of increases continue to be for higher CFOs compared to CEOs; however, the increases for both have slowed dramatically in 2011-2012. We expect future changes in compensation for these positions to continue to be closely linked to overall company performance, as well stock price performance, since the majority of pay for CEOs and CFOs is delivered through long-term incentives.
If a separate Chair role is desired, the position may be occupied by either an executive or a non-executive. An Executive Chair is frequently a founder or a recently retired CEO who continues on as Chair for a transition period. In a few cases, particularly where a high level of Board independence is necessary, an outsider is hired into the role. In contrast, a non-executive Chair is often a sitting member of the Board whose role is expanded.
At companies where the roles of Chair and CEO are combined, the Lead Director position has become common. In CAP’s annual survey of director compensation at the 100 largest U.S. public companies, the percentage of companies with a Lead Director increased from 38% to 47% in three years, from 2009 to 2011. The percentage of companies reporting a separate non-executive Chair has stayed more stable over the period, at approximately 20%. (In public companies where there is not an independent non-executive Chair or Lead Director, there will be an independent Presiding Director, at times a rotating position.)
When determining the appropriate Board leadership structure, directors must consider which structure will be optimal for their company and its culture. If a Lead Director or a separate Chair is elected, it is essential that the separate roles are clearly defined. This will allow the Board to work more effectively with the CEO and other members of the management team, as well as to best determine the appropriate compensation for the role.
Typical Responsibilities of Various Board Leadership Roles
Typical responsibilities are summarized below. As the typical responsibilities and related time commitment can vary substantially, so does the typical compensation for each role.
|
Role |
Responsibilities |
|
Executive Chair |
Provides counsel to the CEO on organization structure, financial structure and related topics Plays integral part in strengthening relationships with external stakeholders, including shareholders and regulatory bodies Develops and executes the company strategy with the CEO |
|
Non-Executive Chair |
Takes primary responsibility for shaping Board agendas, with input from the CEO Facilitates discussions between independent directors on key issues outside of Board meetings Has a critical role in succession planning May represent the organization to external stakeholders and employees (at the board’s discretion) Does not typically have a direct role in the company’s operations |
|
Lead Director |
Chairs executive sessions of the Board Works with the Chairman & CEO to set agendas for Board meetings Serves as liaison between the Board and the CEO Facilitates discussions between independent directors on key issues outside of Board meetings Does not typically represent the company to external stakeholders Does not typically have a role in the company’s operations |
Executive Chairman
The role of Executive Chair is often viewed as a transitional role. The role’s influence on the business can vary dramatically from company to company. As such, compensation practices vary widely across companies and will reflect each company’s specific circumstances, including:
- Balance of responsibilities between the CEO and the Executive Chair
- Time commitment/involvement (e.g., 1 vs. 3 days per week)
- Expected tenure of the Executive Chair
- Tenure and experience of the CEO
- Equity ownership – equity grants are less likely if the Executive Chair already has a large ownership stake or if the position is viewed as short-term in nature
- Founder vs. non-founder status
For an Executive Chair, compensation levels often reflect the individual’s prior pay package as CEO, as well as the compensation program and pay levels of the current CEO.
- Typical pay elements include base salary, annual bonus opportunity and long-term incentive awards
- Base salary levels may reflect the salary earned in the individual’s prior position. If the time commitment is reduced, a salary reduction may also apply
- Long-term incentive opportunities of an Executive Chair are normally lower than what the CEO receives
- Long-term incentive vehicles granted may vary from the company’s core executive compensation program, due in part to the expectation of a shorter tenure and less ability/time to impact long-term results
CAP consultants reviewed compensation data among 57 general industry companies with an Executive Chair, comparing Executive Chair pay to that of the CEO. We found that, at median, Executive Chair compensation (including salary, bonus and long-term incentives) was approximately 70% of the CEO’s compensation.
|
2012 Executive Chair Data |
Exec Chair Salary |
Exec Chair TCC |
Exec Chair TDC |
||||||
|
25th |
Median |
75th |
25th |
Median |
75th |
25th |
Median |
75th |
|
|
57 General Industry Cos. (Median Revenues of $2.4B) |
70% |
90% |
100% |
65% |
85% |
105% |
35% |
70% |
100% |
For reference, below is a breakout of the pay package for three recent, high profile Executive Chairs.
|
Recent Executive Chairman Compensation Packages at Large Organizations |
|||
|
Company |
Hewlett-Packard |
Kraft Foods Inc. |
Sara Lee |
|
Revenue |
$127.2B |
$54.3B |
$8.7B |
|
Executive Chairman |
Raymond J. Lane |
John T. Cahill |
Jan Bennink |
|
Date Hired as Executive Chairman |
September 2011 |
January 2012 |
January 2011 |
|
Previous Role |
Non-Executive Chair |
Outside / New Hire |
Non-Employee Director |
|
Base Salary |
None |
$0.75M |
$1.00M |
|
Target Bonus |
None |
$0.75M (100% of base) |
$1.75M (175% of base) |
|
Long-Term Incentives |
$8.44M (1) |
$4.50M |
$5.25M |
|
Target Total Direct Compensation (TDC) |
$8.44M |
$6.00M |
$8.00M |
|
TDC as a % of CEO |
46% |
97% |
129% |
|
LTI Award Vehicle LTI Grant Frequency (annual, one-time) |
20% Time-Based Stock Options 80% Performance-Based Stock Options One-Time(2) |
75% RSUs 25% Stock Options Not disclosed |
50% RSUs 50% Stock Options Not disclosed |
|
Vesting |
Time-Based: 3 Year Ratable Vesting Performance-Based: Requires 120-140% price appreciation |
3 Year Cliff Vesting (RS) 3 Year Ratable Vesting (SO) |
2 Year Cliff Vesting |
|
LTI Award Vehicles Different from Executive LTI Program |
Yes |
Yes |
Yes |
- Excludes fees as non-executive Chair, including $2.19M RSU award
- 1M stock options were awarded (200,000 options with 3-year ratable vesting; 400,000 options vest upon stock price appreciation of 120% from grant price; 400,000 options vest upon stock price appreciation of 140% from grant price).
Non-Executive Chairman / Lead Director Compensation
Compensation packages for non-executive Chairs and Lead Directors typically consist of the core compensation program for non-employee directors along with an additional stipend (or premium) that reflects the responsibilities and time commitment of the role. This approach appropriately recognizes the differential between a leadership position and other directors, with the magnitude of the premium reflecting the additional responsibilities.
CAP’s market data indicates that all companies with a non-executive Chair provide a premium for the role, and 69% of companies provide a pay premium for the Lead Director role.
Non-executive Chair pay is typically delivered in one of two ways:
- An additional retainer paid in cash or stock, in addition to the regular outside director pay program
- A separate fixed dollar amount provided in cash, stock or a combination, in lieu of the regular outside director pay program
As indicated below, the premium provided to a Lead Director is often much smaller than the premium provided to a non-executive Chair. Our data indicates that a non-executive Chair receives a median premium of +65% compared to a regular outside director’s package. For a Lead Director, the median premium is +10%.
|
Non-Executive Chairman and Lead Director Premium Compensation General Industry Companies with Median Revenues of $2.3B |
|||||
|
Leadership Position |
No of Cos. |
Prevalence of Cos. Providing Additional Compensation |
Multiple of Non-Employee Director Compensation (Median) Primary Reference |
Additional Premium – Median |
Additional Premium – Range |
|
Non-Executive Chairman |
42 |
100% |
1.65x |
$100,000 |
$20k – $577K |
|
Lead Director |
114 |
69% |
1.10x |
$20,000 |
$5K – $140K |
Conclusions
The structure and amount of compensation paid to Executive Chairs differ from non-executive Chairs and Lead Directors, a direct reflection of the roles, duties and time commitment required for each position.
Executive Chairs participate in the company’s executive compensation programs. Base salary, annual incentive and long-term incentives are commonly offered, yet pay programs are situation-specific and frequently transitional in nature. The Executive Chair’s expected tenure and perceived ability to influence longer term results are considerations that impact the amount and form of incentive compensation used.
As companies increasingly focus on improving Board independence, it will be important to evaluate whether or not separate Chair and CEO roles are appropriate. Companies should assess which organization structure makes sense given its unique circumstances. Companies anticipating a transition period due to executive turnover, the need to improve governance or a corporate transaction should re-assess the appropriate structure necessary to best navigate through turbulent times.
For the 114 company sample, median revenue was $30B, median market capitalization was $29B and median Total Shareholder Return (TSR) was 3% for 2011.
What We Found
Companies have modified their stock ownership guidelines and stock retention (or holding) requirements to enhance their governance practices. Median value of CEO stock ownership guideline has increased to 6x base salary, also more in line with Institutional Shareholder Services’ (ISS) definition of “robust” stock ownership. Overall, the use of stock retention requirements increased to approximately 1/3 of companies, while the use of stock retention requirements alone is flat year over year.
Prevalence Of Stock Ownership Guidelines And Stock Retention Requirements
The prevalence of stock ownership guidelines (approximately 90%) among companies in our database remained relatively flat in 2011 compared to findings in 2010. Companies with both stock ownership guidelines and stock retention requirements increased to 36% (from 22%), demonstrating increased efforts towards good corporate governance. However the prevalence of companies with stock retention requirements only stayed relatively flat year over year at 4%.

Of the 46 companies with stock retention requirements, nearly half (52%) of the companies report retention requirements that are linked to stock ownership guidelines (e.g., companies must hold shares until the stock ownership guideline level is achieved). Companies with stand-alone stock retention requirements that are not linked to stock ownership guidelines decreased slightly to 48% in 2011 (vs. 57% in 2010).

Stock Ownership Requirement
Similar to 2010, most companies (approximately 80%) express stock ownership guidelines as a multiple of salary and 15% express guidelines as a fixed number of shares. Fixed share guidelines are more prevalent in the Financial Services (57%), Technology (31%) and Retail (27%) industries.
|
CEO Stock Ownership Requirement Prevalence |
2011 (n = 104) |
2010 (n = 99) |
||
|
# of Cos |
% of Cos |
# of Cos |
% of Cos |
|
|
Multiple of Salary |
84 |
81% |
80 |
81% |
|
Fixed Shares |
15 |
14% |
15 |
15% |
|
Lesser Of Approach |
3 |
3% |
2 |
2% |
|
Other |
2 |
2% |
2 |
2% |
Stock ownership guidelines for CEOs increased from 2010, with the median CEO requirement increasing from a 5x multiple of salary to 6x salary in 2011 (See chart below for details). The median fixed share guideline also increased to 175,000 shares from 150,000 shares in 2010. This median requirement suggests that companies may be increasing their guidelines to respond to shareholders and provide more favorable optics. For several industries, however, (i.e., Automotive, Financial Services, Healthcare and Retail) the median CEO stock ownership guidelines of 5x salary was the same year over year.
The median stock ownership requirement value for the CEO increased modestly to $7.0M in 2011.
|
CEO Stock Ownership Requirement |
2011 (n=104) |
2010 (n=99) |
||||
|
25th %ile |
50th %ile |
75th %ile |
25th %ile |
50th %ile |
75th %ile |
|
|
Multiple of Salary |
5x |
6x |
6x |
5x |
5x |
6x |
|
Fixed Shares |
120,000 |
175,000 |
300,000 |
100,000 |
150,000 |
300,000 |
|
Total Value |
$5.7M |
$7.0M |
$9.7M |
$5.4M |
$6.7M |
$8.6M |
Most companies require executives to achieve the guideline requirement within 5 years. 20% of companies in our database disclose a penalty for not achieving the required ownership. Common penalties for non-compliance include restrictions on selling shares, requiring annual bonus or performance cash awards to be paid in shares and reducing future total compensation.
74 of 104 companies disclose the type of shares that count toward the guideline. While approximately 40% of companies count unvested restricted stock toward the requirement, less than 10% of companies count unearned performance shares or unvested stock options. These findings are similar to our findings in 2010.
|
Shares Counting Toward Guideline Requirement |
2011 (n = 104) |
2010 (n = 99) |
||
|
# of Cos |
% of Cos |
# of Cos |
% of Cos |
|
|
Shares directly owned |
72 |
69% |
55 |
56% |
|
Shares in 401(k) plan |
49 |
47% |
33 |
33% |
|
Unvested RS |
43 |
41% |
33 |
33% |
|
Shares indirectly owned |
36 |
35% |
29 |
29% |
|
Deferred Compensation |
33 |
32% |
25 |
25% |
|
Vested but unexercised options |
11 |
11% |
6 |
6% |
|
Unearned performance shares |
7 |
7% |
5 |
5% |
|
Unvested options |
5 |
5% |
1 |
1% |
|
Not disclosed |
30 |
29% |
29 |
29% |
Note: Percentages add up to greater than 100% due to multiple types of equity counted by various companies.
Stock Retention Requirement
Companies with stock retention requirements most often require executives to hold net shares from option exercises or restricted stock share/unit vesting. Fewer companies, less than 50%, subject net shares from performance-based equity awards to stock retention requirements.
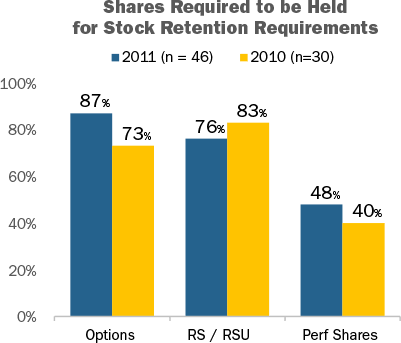
Note: Percentages add up to greater than 100% due to some companies requiring that multiple forms of equity be held.
Most companies require executives to hold net shares after exercise or vesting for a period of 1 year (41%) or through retirement (25%). Few companies require executives to hold shares post-retirement (13%), although the prevalence has increased from 2010.
|
Period Subject |
2011 (n = 32) |
2010 (n = 24) |
||
|
# of Cos |
% of Cos |
# of Cos |
% of Cos |
|
|
1 year post exercise/vest |
13 |
41% |
11 |
46% |
|
2 years post exercise/vest |
1 |
3% |
1 |
4% |
|
Retirement |
8 |
25% |
8 |
33% |
|
Post-retirement |
4 |
13% |
1 |
4% |
|
Other |
4 |
13% |
4 |
17% |
|
Not disclosed |
3 |
9% |
1 |
4% |
Note: Reflects companies with stock retention requirement only. Percentages add up to greater than 100% due to one company requiring different holding periods for CEO and other NEOs.
Disclosed Stock Ownership Guideline Changes
Approximately 20% of companies disclose changes to their stock ownership guideline requirements for 2011 or for 2012. A majority of these companies (55%) increased the ownership requirement for at least one NEO. Other notable changes include the addition of retention requirements (32%) and requiring a more stringent definition of shares that count toward the stock ownership guideline (9%).
|
Changes to Stock Ownership Guidelines |
2011 (n = 22) |
2010 (n = 25) |
||
|
# of Cos |
% of Cos |
# of Cos |
% of Cos |
|
|
Increased guideline requirement |
12 |
55% |
12 |
48% |
|
Added holding requirement |
7 |
32% |
6 |
24% |
|
Modified shares counting toward guideline |
2 |
9% |
n/a |
n/a |
|
Modified penalty for non-compliance |
1 |
5% |
5 |
20% |
|
Newly adopted |
1 |
5% |
1 |
4% |
|
Adopted mandatory holding of shares through retirement |
1 |
5% |
1 |
4% |
|
Extended Participation |
1 |
5% |
n/a |
n/a |
|
Decreased guideline requirement |
1 |
5% |
n/a |
n/a |
Note: Percentages add up to greater than 100% due to multiple changes by several companies.
Summary
In 2011, companies made modest changes to their stock ownership guideline requirements; most often in an effort to make them more robust. Additionally, companies continue to implement stock retention requirements, albeit at a relatively slow pace, to enhance their governance practices. We expect companies to continue to adopt and implement stock retention (holding) requirements and to increase their stock ownership guidelines. Both of these policies address issues that are important to shareholders and proxy advisory groups, and further align senior executives with shareholders.
Companies have modified their stock ownership guidelines and stock retention (or holding) requirements to enhance their governance practices.
While approximately 40% of companies count unvested restricted stock toward the requirement, less than 10% of companies count unearned performance shares or unvested stock options. These findings are similar to our findings in 2010.
In 2011, companies made modest changes to their stock ownership guideline requirements; most often in an effort to make them more robust. We expect companies to continue to adopt and implement stock retention (holding) requirements and to increase their stock ownership guidelines.
We are pleased to present the 3nd annual report on non-employee director (NED) compensation produced by Compensation Advisory Partners LLC (CAP). The report provides a review of current director pay practices among the largest public U.S. corporations (trend setting organizations) and Observations regarding trends and outlook.
For the 114 company sample, median revenue was $30B, median market capitalization was $29B and median Total Shareholder Return (TSR) was 3% for 2011.
What We Found
With the majority of companies in our sample holding annual Say-on-Pay votes, we are seeing companies review various aspects of their pay programs/practices more frequently and make incremental changes. Given the intense pressure from shareholders and proxy advisory firms, companies and their Compensation Committees and outside consultants are annually re-evaluating pay programs. Companies need to stay ahead of the curve and track emerging “best practices” in order to satisfy shareholders. In line with our findings last year, we are continuing to see comprehensive risk assessments, modification of clawback policies and elimination of perquisites and supplemental retirement benefits.
Compensation Risk Disclosure
Of the 114 companies in our study, 113, or 99% made some type of affirmative disclosure on risk assessment in the most recent proxy. This is up from 95% of companies in our 2010 analysis. This affirmative disclosure responds to shareholders who want to be assured that compensation programs are not encouraging risky behavior. Similar to 2010, none of the companies disclosed that their incentive programs create material adverse risks.
Most companies make their risk-related disclosure in the CD&A of the proxy statement, with the corporate governance section of the proxy statement ranking as the second most common place to provide risk disclosure. The table below summarizes where risk disclosures were made:
|
|
2011 |
2010 |
||
|
Section of the Proxy Statement |
No. of Cos. |
% of Cos. n=113 |
No. of Cos. |
% of Cos. n=105 |
|
CD&A |
45 |
40% |
49 |
47% |
|
Corporate Governance Section (Section 407) |
31 |
27% |
25 |
24% |
|
CD&A and Corporate Governance Section (Section 407) |
19 |
17% |
14 |
13% |
|
Separate Stand Alone Section |
13 |
12% |
11 |
10% |
|
CD&A and Compensation Committee Report |
4 |
3% |
4 |
4% |
|
Compensation Committee Report |
1 |
1% |
2 |
2% |
Responsibility for completing the risk assessment process varies by company. Of the companies disclosing a risk assessment, 40 companies (35%) reported that management and the Compensation Committee worked together to conduct the assessment, while 25 companies (23%) reported that the Compensation Committee worked alone to conduct the assessment. This year 96% of companies disclosed who conducted the risk assessment. The table below provides further detail on which groups were involved in the compensation risk review.
|
|
2011 |
2010 |
||
|
Approach to Compensation Risk Reviews |
No. of Cos. |
% of Cos. n=113 |
No. of Cos. |
% of Cos. n=105 |
|
Management and Compensation Committee |
40 |
35% |
35 |
33% |
|
Compensation Committee |
25 |
23% |
17 |
16% |
|
Compensation Committee and Consultant |
17 |
15% |
15 |
14% |
|
Management, Compensation Committee and Consultant |
15 |
13% |
12 |
11% |
|
Management |
8 |
7% |
13 |
12% |
|
Not Disclosed |
5 |
4% |
5 |
5% |
|
Management & Consultant |
3 |
3% |
8 |
8% |
Clawbacks
While the SEC initially planned to implement rules for recouping executive compensation during the first half of 2012, their proposed schedule has been eliminated and no new timetable has been set. Even with no SEC timetable, companies continue to be proactive in adopting clawback policies that go beyond Section 304 of Sarbanes-Oxley, which applies to CEOs and CFOs and the top 25 executives at companies under TARP. Further, while most companies were waiting for final rules, before changing their programs, we are seeing many companies make changes now to respond to the intensifying executive compensation environment.
A significant majority of our research companies – 98 of 114 (86%) – have some form of clawback provision, compared to 80% in 2010. In 2011, 16 of the 98 companies adopted a new clawback policy or amended their existing one: 8 companies adopted a new policy and the other 8 modified existing provisions.
As was the case in 2009 and 2010, a financial restatement is required to trigger a clawback in nearly all cases (84 companies or 86% of those with a clawback, compared to 83% in 2010). Further, 78 companies (80% of those with a clawback, compared to 74% in 2010) disclosed that misconduct is a triggering event and 49 companies (50% of those with a clawback, compared to 51% in 2010) disclosed fraud as a trigger.
It is most common for companies with a clawback policy to include the ability to clawback or recoup compensation previously granted. While it is not currently prevalent for companies to adjust future incentive compensation, this may change based on final rules by the SEC.
|
2011 |
2010 |
|||
|
Compensation Subject to Clawback |
No. of Cos. |
% of Cos. n=98 |
No. of Cos. |
% of Cos. n=89 |
|
Prior LTI |
95 |
97% |
79 |
89% |
|
Prior Annual Incentive |
92 |
94% |
81 |
91% |
|
Adjust Future Annual Incentive |
16 |
16% |
20 |
22% |
|
Adjust Future LTI |
15 |
15% |
14 |
16% |
Note: Percentages add up to greater than 100% due to multiple responses.
Clawback policies cover proxy named executive officers (“NEOs”) in 92% of companies, similar to our findings in 2010, with company’s typically defining coverage as, “executive officers, officers, senior executives or senior management.” The other 8% of companies do not define specific coverage. It is not, however, required to disclose this level of program detail in the proxy, and at many companies the use of clawbacks is broad-based.
Similar to our findings for 2010, a minority of companies (22 companies or 22%) indicate the time period which compensation can be recovered after a financial restatement. Of the 22 companies that disclosed a time frame, the most common is 1 year (41% of companies) from the date of restatement and the range is 1-3 years. Interestingly, some companies are also disclosing different time periods for annual incentives and long-term incentives.
The most comprehensive clawback policies seen in our research apply to executives in financial services companies. Large banks now typically have provisions that extend well beyond those required by SOX or suggested in Dodd-Frank. These detailed programs are likely due to the regulators involvement in the compensation design process, as a result of the financial crisis and TARP. Many of the large banks have multiple programs that can impact different employee populations or pay elements for varying reasons (i.e. financial restatement, fraud, misconduct, inattention to risk, inaccurate performance measurement or unacceptable performance). Morgan Stanley’s policy serves as an example of a comprehensive policy:
Morgan Stanley: “The clawback can be triggered if an individual’s act or omission causes a restatement of the Company’s consolidated financial results or constitutes a violation of the Company’s risk policies and standards, whether such action results in a favorable or unfavorable impact to the Company’s financial results. PSUs are subject to clawback following payment if the Committee determines that the payout was based on materially inaccurate financial statements or other performance metric criteria. Deferred-cash based awards are subject to clawback if an individual’s act or omission causes, or is reasonable expected to cause, a substantial financial loss on trading strategy, investment, commitment or holding in either the current year or any prior year.”
We believe most companies are waiting for the SEC to adopt final rules before changing their clawback provisions. But in light of the SEC’s delayed schedule and the attention of shareholders and the media on this topic, companies will continue to modify their programs to respond to current conditions. Currently, the proposed rules apply to both current and former executives and cover all incentive compensation within 3 years of a financial restatement, regardless of whether intentional misconduct exists.
Perquisites
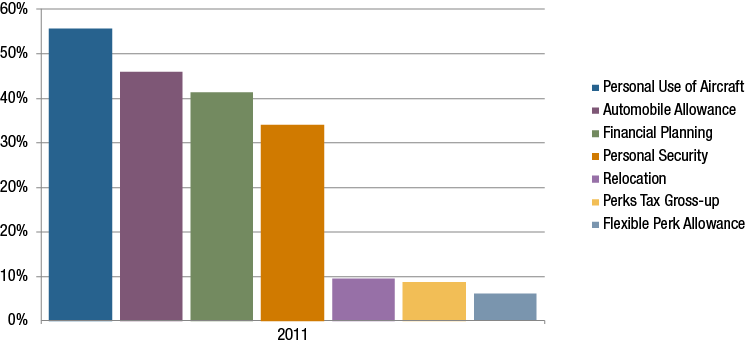
Notwithstanding the trend of decreasing executive perquisites, nearly all companies in our research provide some perquisites to CEOs that extend beyond the benefits provided to the broad employee population. Typical perquisites provided to the CEO include personal use of aircraft (54%), automobile allowance (46%), financial planning (41%) and personal security (35%).
While select perquisites are still somewhat prevalent for CEOs, the trend of reducing executive perks has continued in 2011. It is not surprising that as shareholders express concerns through annual Say-on-Pay votes, one area where companies are responding is by reducing perquisite programs in favor of more performance-based pay. Perquisites are often fairly low in total costs, but high in visibility and sensitivity. In 2011, 14 of 114 companies (12%) disclosed making a change to perquisite programs. Similar to 2009 and 2010, the most prevalent change was the elimination of certain perquisites.
|
|
2011 |
2010 |
||
|
Type of Change Reported in 2011 CD&A |
No. of Cos. |
% of Cos. n=14 |
No. of Cos. |
% of Cos. n=20 |
|
Eliminated perquisites |
9 |
64% |
11 |
55% |
|
Eliminated tax gross-ups on perquisites |
6 |
43% |
8 |
40% |
|
Reduced perquisites |
1 |
7% |
2 |
10% |
|
Changed perquisites |
0 |
0% |
3 |
15% |
Note: Percentages add up to greater than 100% due to multiple responses.
Among companies eliminating perquisites, the most common (in 4 of 9 companies) involved eliminating personal travel on the corporate aircraft or use of company automobile/automobile allowance. 2 of 9 (22%) eliminated home security benefits. Further, of the 9 companies that eliminated perquisites, 3 made up for the lost value in either annual base salary going forward or a one-time payment to cover the loss of the benefit.
Executive Retirement Benefits
16 of 114 companies (14%) disclosed making some type of change to executive retirement plans/benefits in 2011, a slight decrease from 2010 where 17% of companies disclosed a change. As was the case in 2010, t
Notable Findings
Total Board Compensation
At median, non-employee director compensation increased six percent in 2011, after being flat in 2009 and 2010. Year-over-year, median Total Board Compensation increased from $235,000 to $250,000{anchor anchor=’footnote-907-3′ text=’3′}.
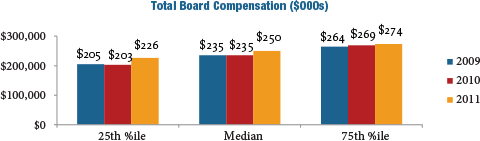
Use of Board meeting fees was a minority practice in 2011, with only 19 percent of companies paying meeting fees. This declined from 23 percent in 2010. In line with emerging practices, more and more large companies are relying on annual retainers to compensate outside directors.
Pay Mix
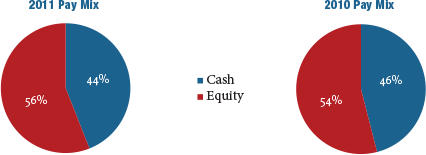
The mix of cash and equity paid to outside directors was generally consistent between 2010 and 2011. On average, the majority of compensation delivered to directors continues to be in the form of equity.
Equity Compensation
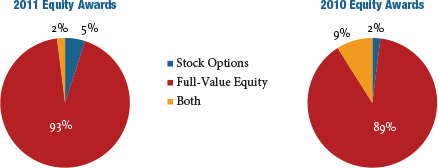
Full-value equity awards, including restricted stock units, restricted stock, deferred stock units and outright awards of common stock, continued to increase as a percentage of total equity delivered. In 2011, only seven percent of large companies granted stock options, down from 11 percent in 2010.
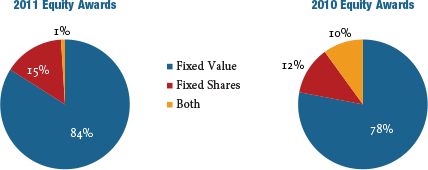
Year-over-year, equity awards denominated as a fixed value increased in prevalence, as opposed to awards based on a fixed number of shares.
CAP Perspective: Over the next few years, we expect the following changes in director compensation to take place: 1) low-to-mid single-digit annual increases in Total Board Compensation; 2) more companies moving to fixed retainer pay structures with a component in cash and a component in equity as opposed to paying meeting fees; and 3) a continued emphasis on full-value equity awards. Delivering a majority of compensation in the form of equity coupled with stock ownership/retention requirements creates strong alignment with long-term shareholders and is considered a best practice.
Committee Compensation
Companies are de-emphasizing committee member compensation and focusing on overall Board compensation. Our research found that just over 50 percent of companies studied pay no committee-specific fees to members of any of the three major committees{anchor anchor=’footnote-907-4′ text=’4′}, an increase from approximately one-third in 2010. During 2011, median committee member compensation decreased when compared with 2010{anchor anchor=’footnote-907-5′ text=’5′}. At median, committee member compensation is now $0.
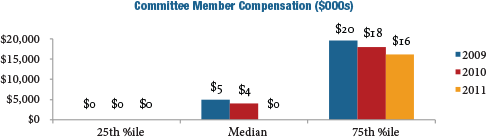
CAP Perspective: We expect the trend away from committee member fees to continue at a slow-to-moderate pace with the value being rolled into Board cash or equity retainers.
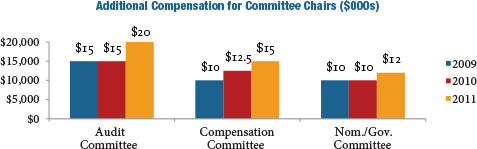
Unlike member compensation, median additional compensation for committee Chairs increased from 2010 to 2011: +33 percent for the Audit Committee; +20 percent for the Compensation Committee (following a 25 percent increase from 2009 to 2010); and +20 percent for the Nominating/Governance Committee. The increases have been driven by recognition of the differential between the time requirement of the leadership role versus that of a committee member.
Lead/Presiding Directors and Non-Executive Chair of the Board
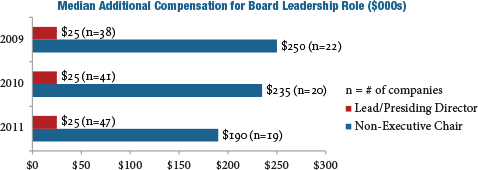
During 2011, the prevalence of providing additional compensation for Lead/Presiding Directors and non-Executive Board Chairs increased from approximately 65 percent in 2010 to approximately 70 percent in 2011. In terms of additional compensation for the role, median pay was unchanged at $25,000 in 2011 for Lead/Presiding Directors and decreased for non-Executive Chairs.
CAP Perspective: While not all non-executive Board leaders receive additional pay for the role, prevalence of additional compensation for these roles is expected to continue to increase over time. The differential in pay between Lead/Presiding Directors and non-Executive Chairs is in line with the responsibilities of each position.
Conclusion
The time commitment and potential for reputational and legal risk connected with service as a director has increased over the past few years, yet economic challenges and an uneven recovery have slowed the rate of growth in director compensation. Due to this, we have observed only moderate increases to director pay levels. However, pay practices for directors continue to evolve. We have observed a continuing and significant trend towards simplification, as director compensation becomes viewed more as an “advisory fee” than an “attendance fee.”
It continues to be important to comprehensively evaluate director pay programs on a regular basis or risk falling behind the curve in terms of desired market positioning and best in class program design. When programs are evaluated, the process and practices listed below should be considered.
|
Best in Class Director Compensation PROCESS |
Establish director pay levels and structure in an informed, deliberate and objective way, with consideration given to market data, trends and outlook Define target market positioning for total pay “Market” should reflect the peer group used for executive compensation benchmarking and/or size-appropriate general industry data Use compensation as a tool to align the interests of non-employee directors and long-term shareholders Disclose the director compensation philosophy and rationale for the program |
|
Best in Class Director Compensation PRACTICES |
Align pay levels with an organization’s size and complexity; in turn, provide appropriate pay for time and responsibilities Review director pay programs focusing on aggregate pay (Total Board Compensation), considering the ratio of cash compensation to equity compensation and additional pay for Board leadership roles Structure pay so that equity represents at least half of the total The pay program should be viewed as an “advisory fee” vs. an “attendance fee” Establish meaningful equity ownership requirements Eliminate benefit/perquisite programs unless there is a strong business case for maintaining them |
1 Analysis includes public Fortune 100 companies (excludes privately held companies).
2 Research assistance for this report was provided by Roman Beleuta, Armando Rivera and Kevin Scott.
3 Total Board Compensation reflects all cash and equity compensation for Board and committee service, excluding compensation for additional leadership roles such as committee Chair, Lead/Presiding Director, or non-executive Chair of the Board.
4 Audit, Compensation and Nominating/Governance committees.
5 Reflects all compensation for committee member service (excludes additional fees for leadership roles), across all Board committees.
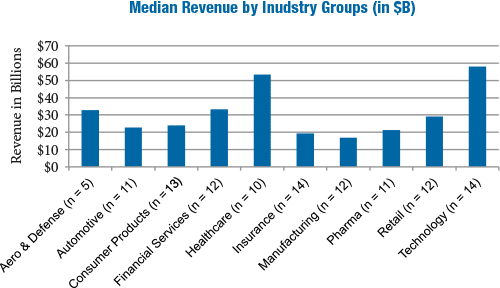
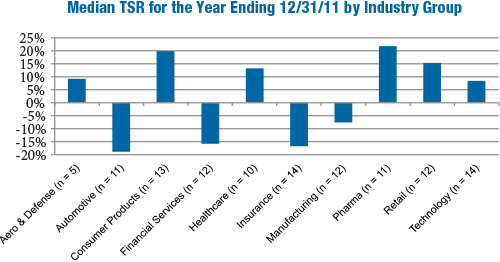
For the 114 company sample, median revenue was $30B, median market capitalization was $29B and median Total Shareholder Return (TSR) was 3% for 2011. As indicated in the charts below, significant variations in company size and performance occur by industry.
What We Found
During 2011, companies continued to make refinements to their executive compensation programs to improve the alignment between pay and performance. Compensation opportunities improved during 2011, as many companies in our sample resumed modest salary increases to the Named Executive Officers (“NEOs”), paid annual incentives for 2011 performance that were above target on average, and continued to shift long-term incentive opportunities into more performance-based vehicles.
Compensation Strategy
Compensation Strategy Changes
A few companies (7%) disclosed making changes to their compensation strategy in 2011. Of the eight companies that disclosed changes, five companies lowered their target pay positioning to be at median of the market (vs. above median) due, in part, to increasing scrutiny from shareholders and proxy advisory firms:
- Allstate: In 2010, the company targeted pay levels between 50th and 75th percentiles of the market. In 2011, Allstate received shareholder feedback that pay should not be targeted above the 50th percentile and, therefore, the company reduced its benchmark target to the median
- Amgen: Significantly reduced the grant value of regular annual LTI equity awards by lowering the benchmarking target by 25 percentage points to the median of the peer group to be responsive to stockholders
Two companies changed the mix between fixed and variable pay; Lincoln National and Prudential Financial increased the portion of total compensation based on variable pay.
Compensation Philosophy
66% of companies in our study disclosed their desired competitive pay positioning for the NEOs. Among these companies, approximately 60% target total direct compensation at median. Pay positioning varies among the industry groups. More companies in the Consumer Goods and Technology industries targeted total compensation above median (60% and 67%, respectively), while companies in the Manufacturing and Pharmaceutical industries tend to target pay at median (88% and 80%, respectively).
Pay Mix
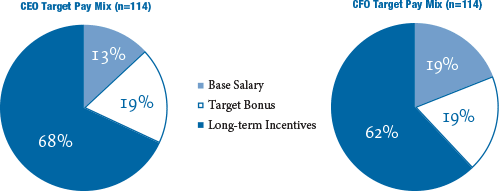
The target pay mix for CEOs includes a higher percentage of total pay in the form of long-term incentives, averaging 68% across industries. In contrast, the average CFO’s pay mix was composed of 62% in long-term incentives. This disclosed pay mix varies by industry with the Technology industry providing the highest proportion of CEO total compensation (75%) in long-term incentives.
Peer Groups Used For Benchmarking
In 2011, 30% of companies disclosed changes to their peer groups used to benchmark senior executive compensation levels. Many companies refined the peer group to better reflect their size and industry focus. More frequent peer group changes were due to, in part, greater shareholder scrutiny resulting from Say on Pay votes. We suspect that Institutional Shareholder Services’ (ISS) new approach to peer group development for their CEO pay-for-performance assessment also had an impact.
Approximately 50% of companies decreased the number of comparator companies in their peer group while 30% of companies increased the size of the peer group and 20% disclosed changes to their peer group but did not indicate an increase or decrease in the number of peer companies.
Base Salary Actions
As the economy continues its slow rebound, we found that more companies provided salary increases for senior executives. 47% of companies in our sample provided a salary increase for their CEO, while a majority of companies (78%) provided a salary increase for their CFO. Companies in the Automotive, Consumer Goods and Pharmaceutical industries were more likely to provide a salary increase to the CEO compared to the other industries reviewed. Companies typically cited the desire to provide a competitive merit increase (generally ranging from 3 – 5%) as the rationale. When companies provided salary increases above this range, market salary adjustments (40% of companies) and promotional increases (15% of companies) were often cited as the reasons.
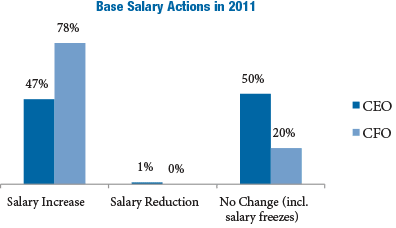
Note: Does not include new CEOs or CFOs hired in 2011. Therefore, percentages do not add up to 100%
Annual Incentive Plan Design
Nearly 40% of companies disclosed annual incentive plan design changes in 2011 or planned changes for 2012. Changes to the annual incentive plan were varied but most often reflected a refinement to enhance the pay for performance alignment and/or support the business strategy. Of companies that made changes to their annual incentive plan, 42% made changes to plan metrics that determine funding. 28% of companies increased the annual incentive target opportunity for the CEO and/or CFO to remain competitive with market practice.
The chart below presents the reported AIP changes:
|
% of Cos. Reporting Changes |
|||
|
Type of Change Reported in CD&A |
No. of Cos. |
2011 (n = 43) |
2010 (n = 57) |
|
Change in performance metrics used to fund awards |
18 |
42% |
33% |
|
Increased target award opportunities |
12 |
28% |
26% |
|
Change in performance metric weighting/mix |
9 |
21% |
18% |
|
Change in maximum award payout |
5 |
12% |
4% |
|
Added risk-based metrics |
2 |
5% |
n/a |
|
Other changes |
8 |
19% |
16% |
Note: Percentages do not add up to 100% due to multiple responses.
Change in Performance Metrics
Half of the companies that made changes to annual incentive plan metrics incorporated additional metrics to their plans in 2011/2012. Four companies reduced the number of metrics to focus executives on key criteria most aligned with the business strategy.
Three companies incorporated strategic measures to their annual incentive plan in addition to the financial metrics:
- Eli Lilly: Added achievement in new product pipeline milestones as an incentive plan metric
- Lowe’s Cos: Added the completion of three strategic incentives as additional performance goals
- Visteon: In addition to profitable growth, cash flow and quality, the 2012 annual incentive award will also be based on the accomplishment of key strategic actions
In 2011, two companies, Bank of New York Mellon and Manulife Financial, added risk-based adjustments to the annual incentive plan payouts, reinforcing the objective of minimizing any potential risk-related behavior that could have an adverse impact on the company.
Annual Incentive Plan Metrics
Revenue, EPS, operating income and cash flow were the most commonly used annual incentive plan metrics across all industry groups in 2011. Industries such as Insurance and Pharmaceutical tend to have industry specific metrics (e.g., Operating Income/EPS in the Insurance industry and Pipeline/R&D Development in the Pharmaceutical industry). Customer-focused industries (e.g., Consumer Goods, Pharmaceuticals, Retail and Technology) were more likely to have Revenue as an annual incentive metric.
The three most prevalent metrics for each industry group are detailed below:
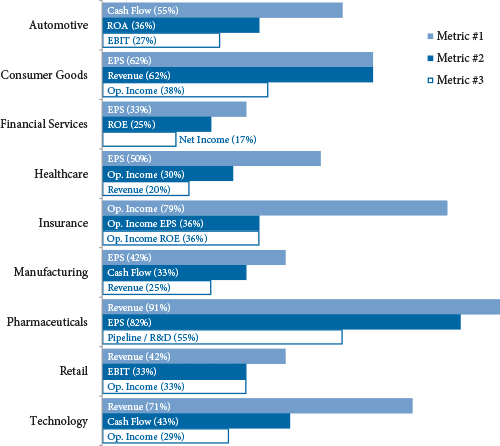
Note: Excludes Aerospace and Defense due to limited sample size (n = 5).
2011 Bonus Payout Details
Similar to last year, 96% of companies paid a bonus to NEOs for 2011 performance. A majority of companies (80%) used financial goals to determine annual incentive payouts and approximately 15% have a plan that provides a payout based on some degree of Compensation Committee or Board discretion. At median, CEOs received a payout that was 130% of target in 2011 (compared with 135% in 2010). In the Insurance and Technology industries, the median CEO payout approximated target suggesting performance was near the budget/plan for the companies in our review. Bonus payouts for the CEO’s in the Aerospace and Defense, Automotive, Manufacturing and Pharmaceuticals industries were generally 145 – 160% of target, likely reflecting stronger than expected performance in 2011.
All companies that paid a bonus in 2011 provided all or a portion of the award in the form of cash. 11% required executives to defer a portion of the annual incentive payout, with most of these companies deferring the payout in full value shares (e.g., restricted stock, restricted stock units, etc.) and one company, Morgan Stanley, providing a deferred cash payout. Approximately half of companies with mandatory deferrals are in the Financial Services industry, where it is more common for incentive pay (annual and long-term) to be deferred for a longer time period (i.e., at least 3 years).
Long-Term Incentive Plan Design
50% of companies made a change to their long-term incentive (“LTI”) plan design in 2011 or for 2012. 46% of these companies changed the LTI vehicle mix with a majority providing a greater emphasis on performance-based equity. Approximately 40% of companies eliminated and/or added LTI vehicles to their program. Companies were more likely to eliminate stock options or time-based restricted stock and add a performance share plan. The table below outlines the reported changes:
|
% of Cos. Reporting Changes |
|||
|
Type of Change Reported in CD&A |
No. of Cos. |
2011 (n = 57) |
2010 (n = 77) |
|
Changed mix of LTI award vehicles |
26 |
46% |
26% |
|
Added or eliminated LTI vehicle |
22 |
39% |
29% |
|
Changed long-term performance metric |
12 |
21% |
31% |
|
Changed LTI award opportunity level |
10 |
18% |
18% |
|
Changed performance plan comparison/peer group |
4 |
7% |
n/a |
|
Other |
13 |
23% |
22% |
Note: Percentages do not add up to 100% due to multiple responses.
Long-Term Incentive Prevalence
The prevalence of performance-based equity increased slightly in 2011 and the use of stock options and time-based restricted stock remained relatively flat. Further, companies continue to provide a larger portion of LTI in performance-based incentive vehicles.
Below is the breakdown of overall LTI vehicle prevalence for NEOs in 2009-2011:
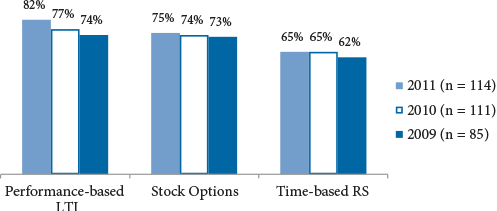
Note: Percentages do not add up to 100% due to multiple responses.
Companies use a balanced approach in delivering the executive LTI program. Nearly 55% of companies deliver LTI in the form of two vehicles and 35% use three vehicles.
Long-Term Award Mix
A majority of companies that made changes to the LTI program shifted a greater portion of LTI to performance-based awards.
|
% of Cos. Reporting Changes |
|||
|
Type of Change Reported in CD&A |
No. of Cos. |
2011 (n = 26) |
2010 (n = 20) |
|
Greater emphasis on performance-based awards |
17 |
65% |
60% |
|
Reduced emphasis on stock options |
11 |
42% |
35% |
|
Reduced emphasis on time-based restricted stock |
12 |
46% |
25% |
|
Other |
6 |
23% |
25% |
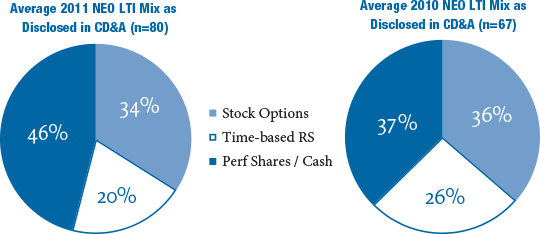
Of the 80 companies that disclosed a targeted LTI mix for 2011, the average CEO LTI mix included 46% in the form of performance shares or performance cash vs. 37% in 2010. The portion of LTI delivered in restricted stock decreased from 26% to 20% in 2011, a further reflection of the shift towards performance-based equity. The percentage of LTI in the form of stock options remained relatively flat year-over-year.
Performance-Based LTI Metrics
For companies that have a performance-based LTI plan, 36% use TSR and 34% use EPS, the most prevalent metrics used. More companies use absolute performance metrics than relative metrics. All companies using TSR disclose using it as a relative metric (vs. absolute) compared to a peer group or broader index.
The chart below displays the prevalence of LTI metrics for performance-based awards in 2011 and 2010:
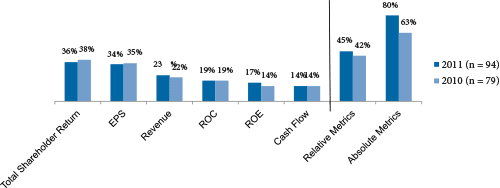
Note: Percentages do not add up to 100% due to multiple responses.
Treatment of Dividend Equivalents
49% of companies provide dividend equivalents on time-based restricted stock awards and approximately 30% do so for performance share awards. Of these companies, most pay dividends when shares are vested or earned (71% and 88%, respectively).
Conclusions
Companies are continuing to make changes to their compensation philosophy, primarily through targeting a more moderate (median) market pay position and making refinements to the peer group used for benchmarking. As the economy continues to slowly rebound, a strong majority of companies gave salary increases to NEOs in the past year. And as shareholders and shareholder advisory groups have an increasingly stronger voice in the compensation arena, companies are making notable program modifications that strengthen the pay and performance alignment, through refining annual incentive metrics or delivering more LTI in the form of performance-based awards.