Highlights
- The look and feel of proxy statements have changed
- Best practices for CD&A include a concise executive summary
- Pay mix charts, other charts, a list of “best practices” that the issuing company follows and a proxy summary are now commonly included
- Financial performance frames the discussion of executive compensation
- A trend in recent years is the disclosure of realized/realizable pay
Compensation Discussion & Analysis (CD&A)
Survey Sample
Compensation Advisory Partners (“CAP”) reviewed 2014 proxy disclosures at a sample of 100 companies among the Fortune 500, representing nine industry groups. Industry groups included: Automotive, Consumer Goods, Financial Services, Health Care, Insurance, Manufacturing, Pharmaceutical, Retail, and Technology. For the companies studied, the median revenue size and market capitalization was $32B and $52B, respectively. The median 2013 total shareholder return (TSR // change in stock price plus dividends) was 43%.
The Say on Pay vote has succeeded in improving and increasing communication with shareholders regarding executive compensation programs. Many companies have adopted what are commonly referred to as “best practices” for proxy disclosure.
|
Elements Included in 2014 Proxy Disclosure Among Fortune 500 companies |
||
|
# of Cos |
% of Cos |
|
|
Executive Summary |
89 |
89% |
|
Pay Mix Chart(s) |
79 |
79% |
|
Use of Other Charts and/or Graphics |
73 |
73% |
|
List of “Best Practices” |
67 |
67% |
|
Realized and/or Realizable Pay |
15 |
15% |
- Executive Summary: Most important part of the CD&A. Continued enhancement over past few years. Typically includes thorough discussion of financial performance and key company achievements, a summary of CEO compensation, and key changes to executive compensation programs, if any
- Pay Mix Charts: Very common. Typically reflect variable vs. fixed pay or performance-based vs. non-performance-based pay
- Use of Other Charts and/or Graphics: Very common. Most often used to directly, and concisely, describe company performance. May include absolute and/or relative performance
- Realized Pay and Realizable Pay: Emerging practice. Intended to illustrate the impact of performance outcomes on pay over time. In contrast, while the Summary Compensation Table reflects actual cash payments, equity awards reflect target values
- List of “Best Practices”: Very common. Often takes the form of “What We Do/Don’t Do” list. Eliminates need for shareholders to take the time to seek these things out
Another trend related to enhanced proxy disclosure of executive compensation programs and decision-making, is increased disclosure of incentive plan goals. Shareholders and proxy advisory firms have expressed the desire for more information on short- and long-term incentive compensation performance targets/goals. Two examples of companies that increased proxy-based incentive plan goal disclosure in reaction to shareholder input are Coca-Cola and Dow Chemical.
|
Company |
Shareholder Feedback |
Action by Company |
|
Coca-Cola |
|
|
|
Dow-Chemical |
|
|
Conclusions
We have observed companies more frequently modifying and enhancing their executive compensation and governance practices, given increasing influence and input of shareholders (and proxy advisory firms). Shareholder communication has also been enhanced, including the proxy statement.
During the 2015 proxy season, we expect more companies to disclose realizable and/or realized pay, particularly if TSR or Say on Pay support are low, and enhance transparency and highlight best practices in executive compensation disclosure. The goal is for executive compensation programs to best support business strategy, while aligning with shareholder interests. Disclosure is an opportunity to highlight all the good work and thought that goes into the design of these programs and the related decision-making.
Key CAP Findings
Board Compensation. little/no change
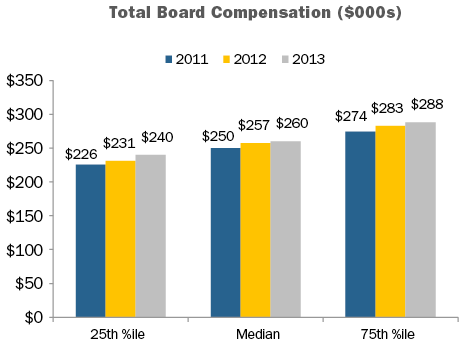
- Total Fees. At median, flat from 2012 to 2013 ($257K vs. $260K)2. Only increased four percent since 2011.
- Retainers. Pay programs have been simplified, now viewed more as an “advisory fee” than an “attendance fee.” In general, companies have moved to a fixed retainer pay structure, with a component in cash and a component in equity.
- Meeting fees. Provided by only 15 percent of companies, down slightly from 2012.
- Equity. Full-value awards (shares/units) are most common. Only five percent of companies use stock options. 92 percent of companies denominate equity awards (stock or options) as a fixed value, versus a fixed number of shares.
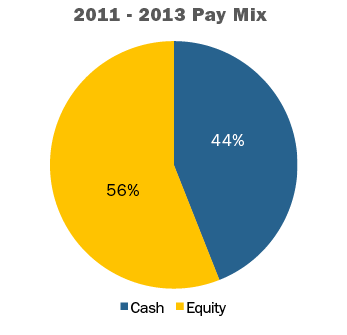
- Pay Mix. On average, 56% equity-based vs. 44% cash-based (consistent for past three years). Alignment with long-term shareholders is reinforced by delivering a majority of compensation in equity.
Committee Member Compensation. little/no change
- Less than half of companies paid committee-specific member fees3.
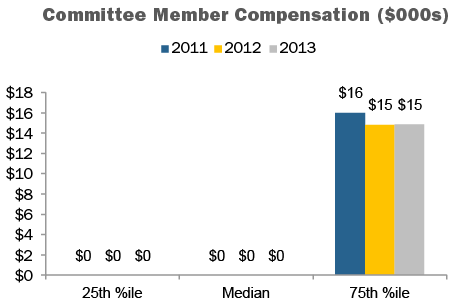
- At median, committee member compensation is $04. There has been a trend away from committee member fees; value typically rolled into Board cash or equity retainers.
Committee Chair Compensation. limited, but notable change
- Nearly all companies provided additional compensation to committee Chairs, versus committee members, typically through an additional retainer. The additional compensation recognizes additional time requirements, responsibilities, and reputational risk.
- At median, $20K in additional compensation (vs. members) was provided to Audit and Compensation Committee Chairs, and $15K to Nominating/Governance Chairs. This is the first year the premium, at median, provided to Compensation Chairs equaled that provided to Audit Chairs.
Independent Board Leader Compensation.
limited, but notable change
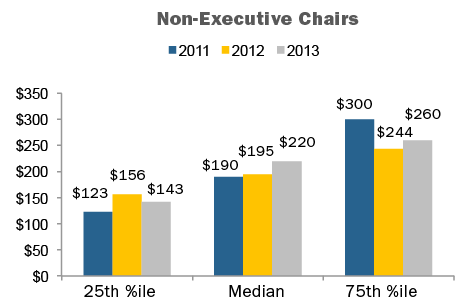
- Non-Exec Chair. Additional compensation is provided by all companies with this role, $220K at median.
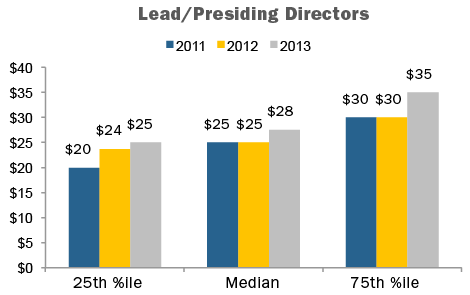
- Lead Director. Additional compensation is provided by nearly all companies with this role5, $28K at median. The differential in pay versus non-executive Chairs is in line with typical differences in responsibilities. Additional compensation was steady, at median, at $25K for the five years prior to 2013.
Perquisites. little/no change
- Overall, limited practice. One-third of companies continue to provide gift matching/charitable contribution.
Pay Limits. NEW to study
- Due mainly to advancement of litigation in Delaware court related to director compensation, several companies (23%) have adopted shareholder approved director compensation limits ($800K, at median). The limit most often applies only to equity-based compensation.
CAP Perspective
Board Pay Levels and Structure
We have hit somewhat of a “steady state” in terms of director pay levels. Over the next few years, we expect modest pay level changes; i.e., low-to-mid single-digit annual increases in Total Board Compensation6. among the broader data set. Individual companies typically make pay level changes every two-to-three years; when they do, the changes tend to be larger than those observed annually within the full data set.
In terms of practices, pay programs have continued a trend towards simplification, as director compensation has become viewed more as an “advisory fee” than an “attendance fee.” Companies have moved to fixed retainer pay structures, with a component in cash and a component in equity, as opposed to use of per-meeting fees.
Director Pay Limits
A number of companies have recently placed limits on director compensation. The limits are largely due to advancement of litigation in Delaware court. In these cases the issue has been that directors approve their own annual compensation, and the shareholder approved long-term incentive plan did not provide “meaningful limits” on the maximum award that could be granted to a director.
When seeking shareholder approval for amendment to an omnibus long-term incentive plan or director compensation plan, 23 percent of companies studied have included value- or share-based limits (13% and 10%, respectively) for non-employee director compensation. These limits range from $250K to $2 million, $800K at median, and typically apply to just equity-based compensation. Some companies have applied the limits to both cash and equity-based compensation while others have excluded initial at-election equity awards, committee Chair pay, and/or additional pay for Board leadership roles from the limit.
We expect prevalence of director pay limits to increase, becoming majority practice within the next three to four years.
Lead Director Compensation
The Lead Director role has evolved, oftentimes a more active role than three to five years ago. As a result, companies are looking at time commitment and responsibilities, and structuring compensation to appropriately reflect the current role and expectations. Boards are engaging in more outreach and meeting with shareholders to talk about governance practices, CEO succession and executive compensation, among other issues, and many investors want to hear from the Lead Director.
Prevalence of providing additional compensation for the Lead Director role has increased over the past five years. Currently, additional compensation is provided by nearly all companies studied with a Lead Director7.
Despite the increased activity of Lead Directors, additional compensation provided for the role continues to be quite different than non-executive Chairs. At median, $28K was provided for the Lead Director role, versus $220K for the non-executive Chair role. In terms of additional compensation, for Lead Directors the pay ranges from $25K to $35K and for non-executive Chairs it ranges from $143 to $260 at 25th and 75th percentiles, respectively. The differential in pay is in line with typical differences in responsibilities. Previously, additional compensation for Lead Directors was steady, at median, at $25K for the last five years. Still, differences exist, somewhat, in role/responsibilities across companies which can impact the level of premium compensation provided for the Lead director role.
Making the decision to provide additional compensation to the Lead Director can send a signal to investors regarding expectations for the role, including time commitment, responsibilities, and authority. Many times, companies have been able to settle (or argue against) shareholder proposals to split the CEO and Chairman roles by instituting (or emphasizing) a strong Lead Director and delineating the specific responsibilities of the position. Boards can also reassure investors concerned about overall governance practices at a company by increasing the Lead Director role/responsibilities. Stock Ownership Guidelines Based on our research, 83% of companies have formal stock ownership requirements. Approximately half of companies studied required directors to defer recognition of equity pay until retirement. The median value of required stock ownership level was $450K.
Detailed Findings
Total Board Compensation
At median, 2013 non-employee director compensation was $260K, generally consistent with 2012.
Pay Mix
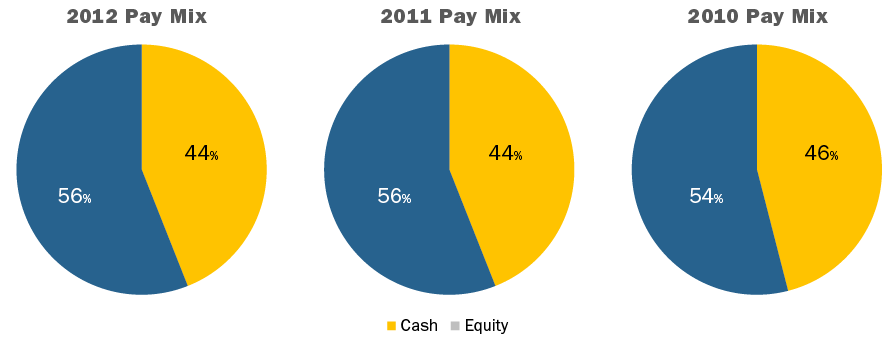
The mix of cash and equity paid to outside directors has remained the same for the last 3 years. On average, 56 percent of compensation was equity-based, and 44 percent was cash-based.
Equity Compensation
Full-value equity awards (stock/units) are the most common form of stock-based compensation. Only five percent of companies used stock options in 2013.
|
Vehicle |
2013 |
2012 |
2011 |
|
Full-Value Equity |
95% |
93% |
93% |
|
Stock Options |
2% |
2% |
5% |
|
Both |
3% |
5% |
2% |
Equity awards denominated as a fixed value, as opposed to awards based on a fixed number of shares, continue to increase in prevalence. In 2013, 92 percent of companies denominated equity awards – stock and/or options – based on a fixed value.
|
Award Type |
2013 |
2012 |
2011 |
|
Fixed Value |
88% |
82% |
84% |
|
FIXED Shares |
8% |
11% |
15% |
|
Both |
4% |
7% |
1% |
Committee Compensation
In 2013, just under half of companies studied paid fees specific to committee members (Audit – 48%, Compensation – 35%, and Nominating/Governance – 32%). Given this, at median, committee member compensation was $0. Among companies that do pay separate fees for committee member service, median compensation during 2013 was $15K.
During 2013, additional compensation (premium vs. member) was provided to 96 percent of Audit Committee Chairs, 90% of Compensation Committee Chairs, and 89% of Nominating/Governance Committee Chairs.
Unlike prior years, during 2013 the additional compensation provided to Audit Committee Chairs, at median, was equal to that provided to Compensation Committee Chairs ($20K). The premium provided to Chairs of Nominating/Governance Committees, at median, was lower ($15K).
Lead/Presiding Directors and Non-Executive Board Chairs
Additional compensation is typically provided to Lead/Presiding Directors and non-Executive Board Chairs.
During 2013, median additional pay provided to Lead Directors and non-executive Chairs increased to $28K and $220K, respectively. Previously, median compensation provided to Lead Directors had been flat for five years.
Best in Class Director Compensation Process & Practices
|
Best in Class Director Compensation PROCESS |
|
|
Best in Class Director Compensation PRACTICES |
|
- 1 Analysis excludes privately held companies.
- 2 Total Board Compensation reflects all cash and equity compensation for Board and committee service, excluding compensation for leadership roles such as committee Chair, Lead/Presiding Director, or non-executive Board Chair.
- 3 Audit, Compensation and/or Nominating and Governance committee members.
- 4 Reflects all compensation for committee member service (excludes additional fees for leadership roles), across all Board committees.
- 5 Excludes controlled companies. Also excludes instances where Lead Director role is assumed by Chair of Nominating and Governance Committee, who receives additional compensation for that role.
- 6 Total Board Compensation reflects all cash and equity compensation for Board and committee service, excluding compensation for leadership roles such as committee Chair, Lead/Presiding Director, or non-executive Board Chair.
- 7 Excludes controlled companies. Also excludes instances where Lead Director role is assumed by Chair of Nominating and Governance Committee, who receives compensation for the role.
The increases that CAP observed in 2013 are much higher than seen last year. In 2012, our study showed almost no change in CEO compensation (-0.3% at median) and a very modest increase in CFO total direct compensation (1.4% at median).
Our findings indicate that the rate of increase in total direct compensation levels for both CEOs and CFOs accelerated in 2012-2013 compared to flat pay increases in 2011-2012. This increase suggests that the economic recovery is having an impact. The higher increase in 2013 among CEOs was driven by larger increases in actual bonuses paid for 2013 and slight increases in long-term incentives (LTI). The slower rate of growth in CFO compensation may signal a leveling off of CFO pay increases – which has been increasing at a faster rate than CEO pay since 2010. On an absolute basis, CFO total direct compensation continues to total approximately one-third of CEO total direct compensation.
Methodology
Our findings are based on a sample of 92 public companies. Similar to prior years, the study analyzes executive pay data disclosed by companies with revenues ranging from $1 to $130 billion, and median 2013 revenues of $8 billion. Only companies with the same CEO and CFO incumbents in the past three years are included allowing us to measure year-over-year changes for individual incumbents. In the past, we excluded financial services firms from the study, since this industry’s compensation practices were evolving in the years after the financial crisis. This year we expanded our sample to include financial services companies in our analysis, because we believe that compensation in the financial services industry has stabilized over the last couple of years.
Study Results
Salaries
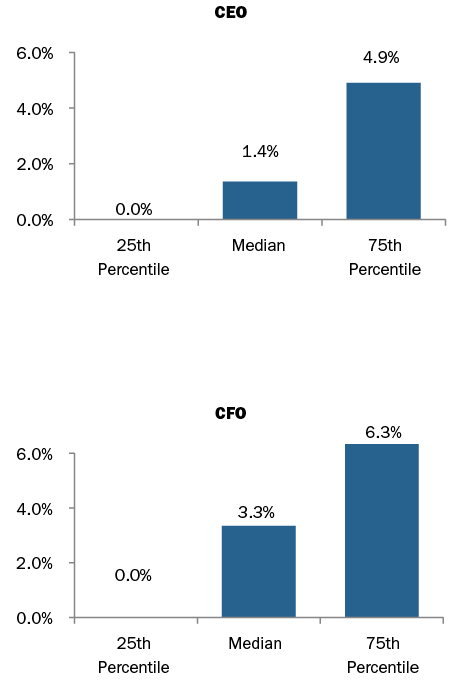
In 2013, approximately 73% of CFOs received salary increases compared to 85% in 2012. The median increase was 3.3% and the 75th percentile increase was 6.3%. In comparison, only 54% of CEOs received salary increases and the increases were smaller — 1.4% at median and 4.9% at the 75th percentile. The number of CEOs receiving a salary increase was similar to 2012. Less frequent and lower salary increases among CEOs may be explained by companies’ hesitancy to increase salaries beyond $1M.
|
% of Executives Receiving Salary Increases |
||||||
|
2010 – 2011 |
2011 – 2012 |
2012 – 2013 |
||||
|
No Increase |
Receiving Increase |
No Increase |
Receiving Increase |
No Increase |
Receiving Increase |
|
|
CEO |
34% |
66% |
47% |
53% |
46% |
54% |
|
CFO |
12% |
88% |
15% |
85% |
27% |
73% |
2013 Salary Increases
Actual Pay Levels
Our findings indicate that the rate of increase in total direct compensation levels for both CEOs and CFOs accelerated in 2012-2013 compared to flat pay increases in 2011-2012, supported by stronger performance in 2013. During 2012-2013, actual total direct compensation (salary plus actual annual incentive plus the grant date value of long-term incentives) for CEOs and CFOs increased by 5.2% and 3.2%, respectively. This year is the first year since 2010 that we see higher median increases in actual total direct compensation for the CEO versus the CFO. In addition to salary increases of 1-3%, annual bonuses were 4-5% higher at median and long-term incentives increased about 3% at median for both CEOs and CFOs.
Absolute CFO total direct compensation levels, on average, continue to be approximately 30% of CEO total direct compensation levels.
|
Median Percentage Change in Pay Components |
||||||
|
2010 – 2011 |
2011 – 2012 |
2012 – 2013 |
||||
|
Pay Components |
CEO |
CFO |
CEO |
CFO |
CEO |
CFO |
|
Salary |
1.8% |
3.5% |
0.5% |
3.0% |
1.4% |
3.3% |
|
Actual Bonus |
0.0% |
3.5% |
-2.8% |
-1.2% |
4.9% |
3.7% |
|
Long-Term Incentives |
10.0% |
10.3% |
0.0% |
2.0% |
3.2% |
3.3% |
|
Actual Total Direct Comp. |
3.6% |
7.5% |
-0.3% |
1.4% |
5.2% |
3.2% |
|
Financial Performance (Median Levels) |
|||
|
Year |
Total Shareholder Return (as of 12/31) |
1-Year Revenue Growth |
1-Year Net Income Growth |
|
2011 |
5% |
9% |
13% |
|
2012 |
14% |
3% |
2% |
|
2013 |
31% |
5% |
12% |
Since this was the first year financial services companies were included, we tested the results without financial services companies and found that the median increase in total direct compensation between the two data sets for CEOs and CFOs was within a 1% difference. However, total cash compensation yielded greater differences. For CFOs of non-financial services companies the median increase in total cash compensation was 1.9% vs. 4.6% median increase of the total sample. For CEOs the median increases were 3.1% vs. 4.2%, respectively. This is due to higher bonus payouts at financial services institutions in 2013.
2013 Median Salary Increase by Industry
2013 Median Actual Total Direct Compensation Increase by Industry
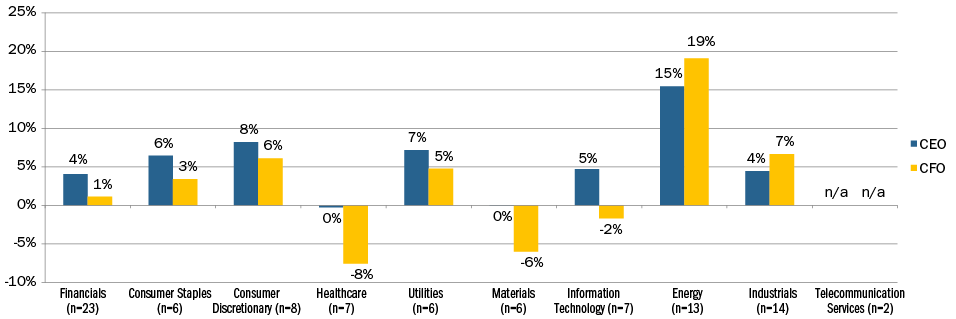
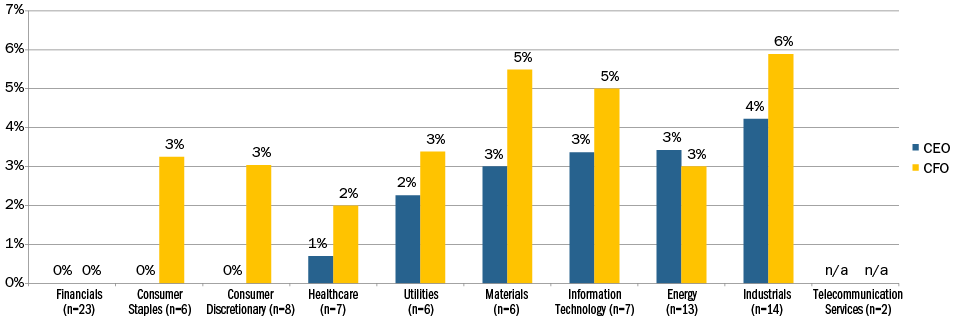
Our study breaks out 2013 CEO and CFO pay by industry classification (Financials, Consumer Staples, Consumer Discretionary, Healthcare, Utilities, Materials, Information Technology, Energy, Industrials, and Telecommunication Services). When looking at median increases in salary for both CEOs and CFOs, they tend to be in the range of 0-3%. Median salary increases over 3% occurred in the Materials and Information Technology industries for CFOs and in Industrials for both CEO and CFO. When looking at actual total direct compensation there is greater volatility in increases, which is primarily driven by industry and company performance.
Target Pay Mix
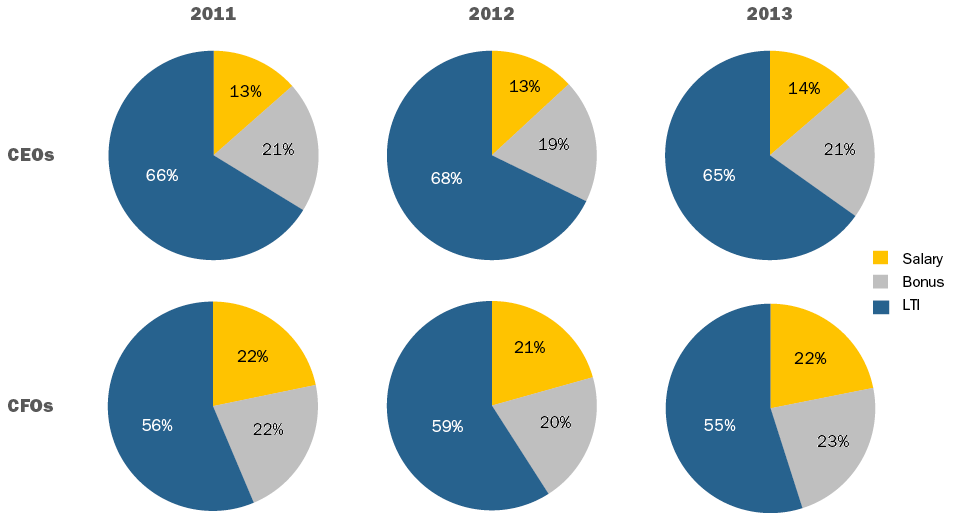
In terms of target compensation levels, the overall pay mix remained largely unchanged from 2011 to 2013. We continue to observe a greater emphasis on at-risk pay for CEOs than for CFOs.
Long-Term Incentive (LTI) Vehicle Prevalence and Mix
LTI vehicle prevalence and mix trends have been fairly consistent over the past few years. The use of at least two long-term incentive vehicles continues to be the majority practice for CEOs and CFOs. The role of stock options has been decreasing slowly in the overall mix with companies delivering about 30% of LTI using this vehicle. On average, performance-based LTI continues to comprise approximately 50% of LTI for CEOs and CFOs. Data continues to show that about 80% of CFOs and CEOs receive some form of performance-based awards as part of their LTI program.
|
# of LTI Vehicles Used |
% in Total |
|
|
CEO |
CFO |
|
|
1 Vehicle |
25% |
27% |
|
2 Vehicles |
49% |
43% |
|
3 Vehicles |
26% |
30% |
|
Average |
2 |
2 |
|
LTI Mix |
2011 |
2012 |
2013 |
|||
|
CEO |
CFO |
CEO |
CFO |
CEO |
CFO |
|
|
Stock Options |
32% |
32% |
30% |
32% |
29% |
29% |
|
Time Vested Restricted Stock |
17% |
22% |
16% |
20% |
19% |
22% |
|
Perf. Based LTI |
51% |
46% |
53% |
48% |
53% |
49% |
Conclusion
Given the improved economy and strong stock market it is not surprising that CEO and CFO pay levels increased in 2013. The fact that CEO pay increased at a faster rate than CFOs for the first time in four years, implies that Compensation Committees are recognizing CEO performance as overall company performance improves. In the future, we expect continued pay-for-performance alignment with CEOs experiencing a greater impact on compensation for good and bad performance.
CHANGES IN ANNUAL INCENTIVE PLAN DESIGN
Overall, 37% of companies made changes to their annual incentive plan design in 2012 or 2013. The most common changes were to increase the target incentive opportunity for the CEO and/or CFO (43% of companies making a change to increase target award opportunities) or to change to the annual incentive performance metrics (35%). Companies continue to review and enhance the pay-for-performance relationship through changes to the annual incentive program.
|
Type of Change Reported in CD&A |
2012 No. of Cos. |
% of Cos. Reporting Changes |
|
|
2012 (n = 37) |
2011 (n = 43) |
||
|
Increase target award opportunities (CEO and/or CFO) |
16 |
43% |
28% |
|
Change in performance metrics used to fund awards |
13 |
35% |
42% |
|
Change in performance metric weighting/mix |
4 |
11% |
21% |
|
Adopt mandatory deferral mechanism |
4 |
11% |
n/a |
|
Change in maximum award payout |
3 |
8% |
12% |
|
Other Changes |
8 |
22% |
19% |
Note: Due to multiple responses, does not add up to 100%.
Change in Target Bonus Opportunity
Last year median target bonus opportunities for the CEO and CFO positions increased by 6 and 1 percentage points to 159% and 101% of salary, respectively. The target bonus opportunity for CEOs in the Technology industry increased by 50 percentage points in 2012 due to an increase in the target opportunity at Apple (from 50% to 100% of salary) and Verizon (from 187.5% to 250%). Conversely, in the Consumer Goods industry, target bonus opportunities decreased year over year due to new incumbents in these roles.
|
Industry |
Median Target Bonus as a % of Salary |
|||||
|
CEO |
CFO |
|||||
|
2012 |
2011 |
Change in %age Pts. |
2012 |
2011 |
Change in %age Pts. |
|
|
Automotive |
138% |
130% |
+8% |
88% |
88% |
0% |
|
Consumer Goods |
160% |
170% |
-10% |
90% |
100% |
-10% |
|
Financial Services |
n/m |
n/m |
n/m |
n/m |
n/m |
n/m |
|
Health Care |
145% |
145% |
0% |
101% |
100% |
+1% |
|
Insurance |
200% |
200% |
0% |
130% |
120% |
+10% |
|
Manufacturing |
142% |
156% |
-14% |
93% |
95% |
-2% |
|
Pharmaceutical |
150% |
150% |
0% |
97% |
91% |
+6% |
|
Retail |
190% |
168% |
+12% |
90% |
85% |
+5% |
|
Technology |
250% |
200% |
+50% |
135% |
121% |
+14% |
|
Total Sample |
159% |
153% |
+6% |
101% |
100% |
+1% |
Note: Financial Services industry is excluded since most companies in our study do not disclose target bonus opportunities for the Named Executive Officers.
Change in Performance Metrics
Of the companies that changed or plan to change the performance metric:
- Nine (9) companies added metrics to the current plan
- Two (2) companies reduced the number of metrics, and
- Two (2) companies kept the same number of metrics but replaced a metric in the incentive plan.
Several companies indicated that their rationale for changing annual incentive metrics was, in large part, to better align executive pay with the business strategy and shareholder interests:
- Caterpillar: Incorporated Operating Profit After Capital Charge (OPACC) as a measure, to reflect how the Company is utilizing its assets in order to generate shareholder value
- CIGNA: Added a customer loyalty metric in 2013 to emphasize its business strategy and focus on the customers it serves
- Hewlett Packard: Introduced year over year improvement in Return on Invested Capital as an annual incentive metric to focus executives on the business turnaround
ANNUAL INCENTIVE PLAN DESIGN / PRACTICES
Award Leverage
Most companies reviewed did not disclose a threshold level of performance required to receive a bonus payment. Instead, these companies disclosed a minimum bonus of $0. For the 37 companies that did disclose a threshold bonus, 50% of target is the most prevalent payout percentage. However 20 companies, disclose a minimum bonus payout of less than 50% of target with a majority of these companies paying out for results based on one of multiple plan metrics. A majority of companies (58%) have a maximum bonus opportunity of 200% of target bonus. Thirteen (13) companies have a maximum bonus of 250% of target or higher. Four (4) of these companies are in the Consumer Goods industry and three (3) are in the Technology industry.
|
Threshold as a % of Target (n=37) |
||
|
Range |
# of Cos. |
% of Cos. |
|
< 25% |
10 |
27% |
|
25% < 50% |
10 |
27% |
|
50% |
12 |
32% |
|
50% < 75% |
1 |
3% |
|
75 <100% |
4 |
11% |
|
Maximum as a % of Target (n = 78) |
||
|
Range |
# of Cos. |
% of Cos. |
|
100% < 150% |
2 |
3% |
|
150% < 200% |
16 |
21% |
|
200% |
45 |
58% |
|
200% < 250% |
2 |
3% |
|
> 250% |
13 |
17% |
Of the six (6) companies that made changes to their maximum bonus potential in 2012/2013, three (3) companies increased the maximum bonus potential and three (3) companies reduced the maximum. Two (2) of these companies (Allstate and Colgate-Palmolive) changed the maximum payout for the CEO only.
Annual Incentive Plan Metrics
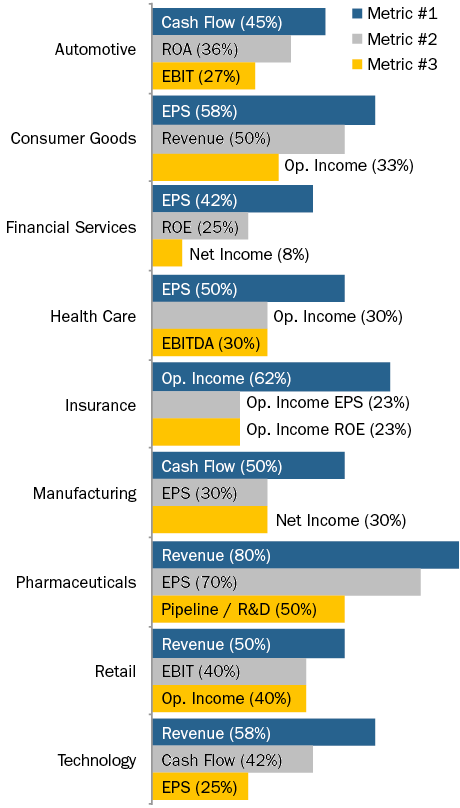
Similar to 2011, Revenue, EPS, Cash Flow and Operating Income continue to be the most prevalent metrics used across all companies, although we see some variation in metrics by industry. In 2013, 30% of companies disclose using two (2) metrics in their annual incentive programs, 29% use three (3) metrics, and 12% of companies use four (4) or more metrics. Approximately 85% of these companies use a profit-based metric in combination with Revenue and/or Cash Flow.
Refer to the chart below for the three (3) most prevalent metrics by industry:
|
Industry |
Actual Bonus as a % of Target Bonus – CEO |
|||||
|
2012 |
2011 |
|||||
|
25th%ile |
Median |
75th%ile |
25th%ile |
Median |
75th%ile |
|
|
Automotive |
69% |
102% |
131% |
130% |
153% |
186% |
|
Consumer Goods |
94% |
103% |
137% |
78% |
132% |
149% |
|
Financial Services |
44% |
80% |
120% |
111% |
114% |
130% |
|
Health Care |
103% |
127% |
157% |
116% |
127% |
159% |
|
Insurance |
112% |
130% |
144% |
85% |
106% |
130% |
|
Manufacturing |
100% |
107% |
146% |
119% |
136% |
162% |
|
Pharmaceutical |
125% |
142% |
156% |
130% |
144% |
161% |
|
Retail |
79% |
117% |
136% |
112% |
129% |
147% |
|
Technology |
90% |
99% |
124% |
75% |
100% |
149% |
|
Total Sample |
93% |
112% |
144% |
105% |
133% |
156% |
Note: Most companies in the Financial Services industry does not disclose target bonus. Figures for the Financial Services industry reflects actual bonus as a percentage of 3-year average actual bonus.
2012 Actual Bonus Payout
Similar to 2011, approximately 95% of companies awarded bonuses to their Named Executive Officers for 2012 performance. Overall, the median CEO bonus was 112% of target compared to 133% in 2011, indicating that 2012 performance generally exceeded par, but was not as strong as 2011 performance. Median 2012 bonus payouts in the Health Care, Insurance, Pharmaceutical and Retail industries exceeded target by 15 – 40 percentage points while payouts in the Automotive, Consumer Goods, Manufacturing and Technology industries were closer to target.
15% of companies in our study require executives to defer all or a portion of their annual incentive payout. Nearly 50% of companies that require a portion of the annual incentive award to be deferred are in the Financial Services industry. Among companies with mandatory deferrals outside of the Financial Services industry, two (2) companies pay a portion of the annual incentive in restricted stock units if the total payout exceeds a specific level:
- HCA Holdings: Any bonus payout above target is delivered 50% in cash and 50% in restricted stock units
- 3M: Annual incentive payouts in excess of 200% of target are paid in the form of restricted stock units
CONCLUSIONS
Companies are continuing to refine their annual incentive program to ensure executive pay is aligned with the Company’s business strategy and key success indicators. These recent trends also indicate that companies are modestly increasing CEO pay through the bonus opportunity and award leverage. Actual payouts for 2012, however, indicate stronger performance goals and moderately above target payouts, yet lower than the previous year. Revenue, EPS, Cash Flow and Operating Income continue to be the most prevalent annual incentive plan metrics with a majority of companies using two (30%) or three (29%) metrics to reward executives for company performance. We expect companies to continue to refine metrics and performance goals / leverage linkages in the annual incentive plan as shareholders and proxy advisory firms scrutinize the executive compensation program.
Among the 100 company sample, median revenue was $33B, median market capitalization was $37B and median Total Shareholder Return (TSR) was 19% in 2012.
What We Found
Although shareholder support for Say on Pay has been increasing year-over-year with a significant majority of companies receiving over 90% support, companies continue to regularly review and modify their executive compensation programs in response to shareholders, proxy advisory firms and good governance practices. Consistent with our findings last year, companies continue to modify clawback policies and scale back perquisites. New to our research in 2013, hedging /pledging polices have also gained traction as a result of Dodd-Frank and ISS’ policies.
Dodd Frank
The Dodd Frank Wall Street Reform and Consumer Protection Act (Dodd Frank) was signed into law in 2010 and will require the following governance practices:
- Companies must implement a clawback policy for executive officers that allows for recoupment of any incentive compensation, with a three-year look back, due to any restatements
- Companies must disclose whether they have a policy that prohibits hedging of company shares (e.g., through the purchase of derivatives that protect executives from stock price swings)
- Companies must disclose whether they have a policy to address pledging of company shares (e.g., as collateral for a loan)
The SEC has yet to release guidance on these areas and the timing of future guidance is uncertain. As such, many companies have taken steps to implement policies on their own.
Clawbacks
Dodd Frank requires a broader definition of clawbacks compared to Section 304 of SOX, which applies to CEOs and CFOs. When clawback policies were first adopted by Dodd Frank many companies took a “wait and see” approach; however, with the continued delay in final regulations, companies have been more proactive in modifying their policies.
Nearly all of our research companies – 94 of 100 (94%) – have some form of clawback policy, compared to 86% and 80% in 2011 and 2010, respectively. In 2012, 10 companies adopted a new policy and 11 modified existing provisions. The two industries that saw the most changes to their clawback polices included automotive (45% of companies) and financial services (45% of companies). Typically financial services firms expanded their clawback policies to cover all incentive awards and situations beyond just financial restatements.
As was the case in prior years, a financial restatement (83%) and misconduct (75%) are the most common triggers for a clawback.
Under nearly all policies, it is most common for companies to include the ability to recoup compensation previously granted and it is less prevalent to clawback any future incentive compensation. While the final rules are not expected to include future compensation, we expect companies that already have this provision may continue to include it.
|
Compensation Subject to Clawback |
2012 |
2011 |
2010 |
|||
|
No. of cos |
% of Cos. n=94. |
No. of cos. |
% of Cos. N=98 |
No. of Cos. |
% of Cos. n=89 |
|
|
Prior LTI |
88 |
95% |
95 |
97% |
79 |
89% |
|
Prior Annual Incentive |
86 |
92% |
92 |
94% |
81 |
91% |
|
Future Annual Incentive |
19 |
20% |
16 |
16% |
20 |
22% |
|
Future LTI |
18 |
19% |
15 |
15% |
14 |
16% |
Note: Percentages add up to greater than 100% due to multiple responses
Coverage extends to NEOs in 91% of companies, which is consistent with our findings in 2010 and 2011. Of the other 9% of companies, most define coverage as, “executive officers, officers, senior executives or senior management.” Companies are not required to disclose the level of program detail in the proxy, but we expect most program provisions are more broad-based.
Similar to our findings in 2010 and 2011, less than a quarter of companies indicate the length of the look-back period during which compensation can be recovered after a financial restatement. Of the 20 companies that disclosed a time frame, the most common is 1 year (47% of companies) from date of restatement, followed by 3 years (26% of companies). While not common practice, some companies disclose a different time period for annual incentives and long-term incentives.
While many companies are waiting for the SEC to adopt final rules before making comprehensive changes to their policies, companies have been proactive over the last 3 years in adopting clawback policies. On their own merits, such provisions:
- Provide the Board with flexibility to clawback for unforeseen circumstances
- Allow flexibility for the Board to access whether the reinstatement had implications for shareholders (e.g., economic issue or accounting issue)
- Increase executive accountability
- Garner positive reaction from shareholders
- Receive credit by ISS in the QuickScore evaluation (under Equity Risk Mitigation topic)
As we await for the SEC to propose final rules, there are several practical challenges to clawing back compensation, such as how to clawback equity gains, how to claw back from former employees and the tax implications of clawbacks.
HeDGING AND PLEDGING
Hedging and pledging have become shareholder/ corporate governance issues, especially now that ISS views any hedging and significant pledging by insiders to be indicative of a potential failure of risk oversight on behalf of a company’s Board. The Board’s policy regarding these practices is most commonly reflected in the company’s insider trading policy, but it can be addressed through Board resolutions or a stand-alone policy.
Hedging is viewed as a poor practice as it insulates executives from stock price movement and reduces alignment with shareholders. Pledging, in modest amounts, may not be viewed as negatively as hedging, yet can become problematic if there were a significant decline in stock price and which necessitated a sale of shares. Given the potential negative perception of insider hedging and pledging, companies have begun to adopt policies to limit these provisions. Anti-hedging and pledging policies are in place at 91% and 59% of companies studied, respectively; 59% of companies have both policies in place and 32% only have a hedging policy.
|
Hedging / Pledging Policy |
2012 |
|
|
No. of cos |
% of Cos. n=100 |
|
|
Hedging |
91 |
91% |
|
Pledging |
59 |
59% |
|
Both |
59 |
59% |
|
Hedging Only |
32 |
32% |
Note: Percentages add up to greater than 100% due to multiple responses
An example of typical disclosure of a prohibition on hedging/pledging is reflected in PepsiCo’s proxy disclosure:
“Our insider trading policy prohibits executive officers from using any strategies or products (such as derivative securities or short-selling techniques) to hedge against the potential changes in the value of PepsiCo Common Stock. In addition, executive officers may not hold PepsiCo securities in a margin account or pledge PepsiCo stock or PepsiCo stock options as collateral for a loan.”
Pledging was not addressed in Dodd-Frank per se, and we do not know what the SEC’s position will be in the future. We do however expect more companies to adopt pledging policies going forward given ISS’ 2012 policy statement that identified pledging of company stock by executives as a poor practice.
To improve Say on Pay results, many companies have already have already implemented policies that prohibit hedging and pledging.
Perquisites
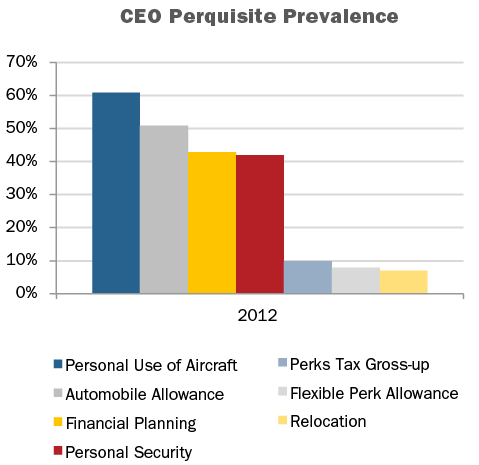
In 2012, companies in our research (91%) provided one or more perquisites to the CEO. Most commonly provided perquisites to the CEO include personal use of aircraft (61%), automobile allowance (51%), financial planning (43%) and personal security (42%).
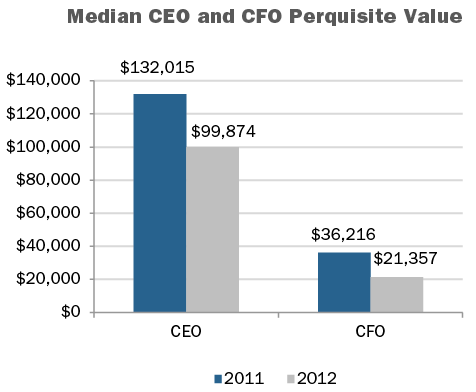
The value of perquisites offered to executives however, has continued to decrease. Median perquisite values disclosed for the CEO and CFO in 2012 were $99,874 and $21,357, respectively. This is a 32% decrease for CEOs and a 70% decrease in value for CFOs in our research. The manufacturing industry had the highest median perquisite values of $319,793 and $69,069 for the CEO and CFO, respectively.
Perquisites tend to be a small proportion of an executive’s total compensation, yet are often highly visible. Shareholders prefer to see pay delivered in performance-based vehicles vs. perquisite programs. Over the past few years, companies have been making changes to these programs in reaction to increased shareholder scrutiny and specific feedback received from shareholders or the likes of ISS or Glass Lewis. In 2012, 9 of 100 companies (9%) disclosed making a change to their perquisite program, a continuation of the trend to reduce perquisites that took hold several years ago.
|
Perquisite Change Reported in 2012 CD&A |
2012 |
2011 |
2010 |
|||
|
No. of Cos. |
% of Cos. n=9 |
No. of Cos. |
% of Cos. n=14 |
No. of Cos. |
% of Cos. n=20 |
|
|
Eliminated tax gross-ups on perquisites |
4 |
44% |
6 |
43% |
8 |
40% |
|
Eliminated perquisite |
2 |
22% |
9 |
64% |
11 |
55% |
|
Reduced perquisite program/value |
1 |
11% |
1 |
7% |
2 |
10% |
|
Changed perquisite program |
1 |
11% |
0 |
0% |
3 |
15% |
Note: Percentages add up to greater than 100% due to multiple responses
Occasionally, a company eliminates a perquisite and offsets some of the lost value or reduction through a salary increase or a one-time payment. An example from 2012 is Lear Corp, which disclosed the following:
“Effective January 1, 2012, we eliminated a separate annual perquisite allowance by adding this amount to the base salary of our Named Executive Officers. However, for purposes of determining incentive awards in 2012 and 2013, which are specified as a multiple of salary, the prior perquisite amount is excluded.”
Importantly, Lear excluded the amount of this increase for purposes of incentives, eliminating the potential to provide an even greater, unintentional increase, in total.
The changes in 2012 include two companies eliminating perquisite allowances, one company approving residential security measures for the CEO and one company reducing the allowance for personal use of aircraft for the CEO and CFO. We expect this trend to sustain as more and more companies are responding to the concerns of their shareholders, which can be voiced through a company’s Say on Pay vote.
Conclusions
With Say on Pay votes held annually for a majority of companies, we continue to see companies stay ahead of the curve and track “best practices” in order to satisfy shareholders and proxy advisory firms. This results in reevaluations of company pay and governance practices, and as our research shows, continued modification of perquisite programs and clawback policies, and adoption of hedging and pledging policies. The goal continues to be closer alignment of executive compensation with shareholder interests. We expect companies and Boards to more proactively monitor proxy advisory firm policies and Dodd-Frank legislation when considering changes to pay programs.
Among the 100 company sample, median revenue was $33B, median market capitalization was $37B and median Total Shareholder Return (TSR) was 19% in 2012. As indicated in the charts below, there is significant variation in company size and performance by industry.
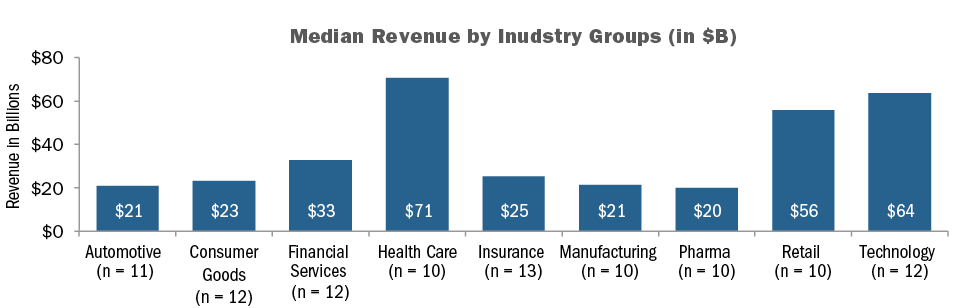
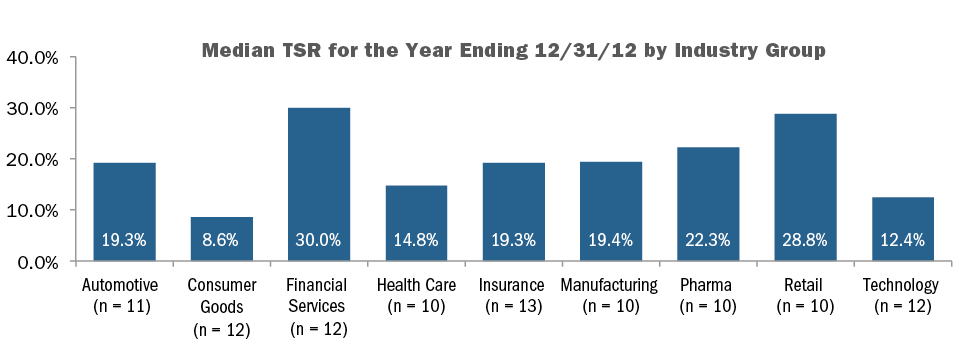
COMPENSATION PHILOSOPHY
Nearly 60% of companies in our study disclose a target total pay position for the Named Executive Officers (“NEOs”). Of these companies, approximately 75% target total pay at median, up from 60% a year ago; indicating that companies are shifting their compensation pay philosophy to a market median standard in reaction to increased scrutiny from shareholders and proxy advisory firms.
|
Target Total Compensation Pay Positioning (n=57) |
CEO |
CFO |
|
Below Median |
1% |
0% |
|
At Median |
74% |
75% |
|
Above Median |
25% |
25% |
CAP Perspective: Change in targeted pay position to median reflects movement to adopt more conservative target pay practices that demonstrate a strong link to performance.
PAY MIX
Overall, companies did not make significant shifts in the total pay mix in 2012 vs. 2011. CEO and CFO total pay continues to place significant emphasis on long-term incentives (“LTI”); on average, LTI reflects 66% of pay for CEOs and 63% for CFOs.
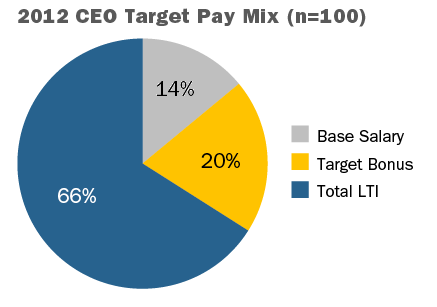
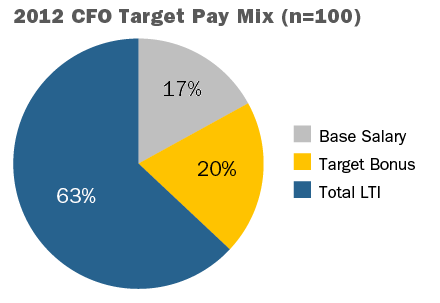
CHANGES IN TARGET PAY LEVELS
The chart below shows average year over year change in target pay levels for CEOs and CFOs in our study. 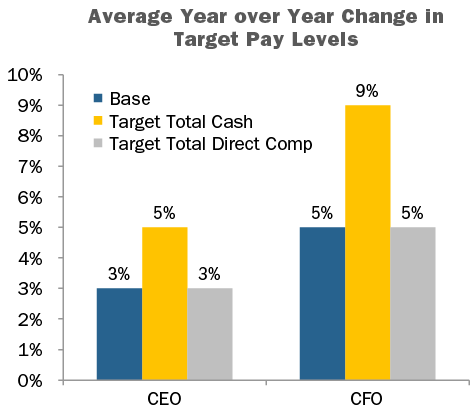
Note: Excludes newly hired/promoted executives and one-time sign-on/retention equity awards. Percentages include zeroes.
CAP Perspective: We see increases in target pay levels in the low single digits, though the most significant increase is in target annual incentive opportunities suggesting that companies are increasing performance-based pay to reinforce the pay-for-performance link.
Base Salary
CEO base salaries in 2012 increased 3%, on average, though only 46% of companies provided salary increases. Base salaries for CFOs increased by 5% though fewer companies provided an increase in 2012 (68%) vs. 2011 (78%) suggesting salary increases were made less frequently for senior executives than other employees.
Executives in the Health Care and Pharmaceutical industries were more likely to receive a salary increase (70% of CEOs in the Health Care industry and 90% of CFOs in the Pharmaceutical industry) than those in other industries. Financial Services, Insurance and Technology industries were less likely to provide a salary increase for the CEO in 2012.
|
Base Salary Action |
CEO |
CFO |
||
|
2012 |
2011 |
2012 |
2011 |
|
|
Increase |
46% |
47% |
68% |
78% |
|
No Change |
52% |
50% |
26% |
20% |
Note: Does not include newly hired CEOs or CFOs. Therefore, percentages do not add up to 100%.
Target Bonus
Target bonus for both the CEO and CFO increased modestly at median levels. At the 75th percentile, the bonus opportunity for CFOs increased by almost 20 percentage points. Target bonuses for CEOs in the Automotive, Consumer Goods and Technology industries increased the most in 2012. CFOs in the Automotive, Retail and Technology industries saw significant increases as well.
|
Summary Statistics |
Target Bonus as a % of Salary |
|||||
|
CEO |
CFO |
|||||
|
2012 |
2011 |
Change in %age Pts. |
2012 |
2011 |
Change in %age Pts. |
|
|
75th Percentile |
200% |
200% |
0% |
143% |
125% |
+18% |
|
Median |
157% |
153% |
+3% |
103% |
100% |
+3% |
|
25th Percentile |
133% |
135% |
-2% |
90% |
85% |
+5% |
Target Total Cash Compensation
Target total cash compensation increased for both the CEO (5%) and CFO (9%) in 2012, mainly due to increases in annual incentive opportunities.
Total Long-term Incentives (LTI)
Increases in total LTI in 2012, on average, were fairly modest; total LTI increased by 3% for CEOs and 5% for CFOs. However, some industries saw significant increases in LTI year over year: CEOs in the Health Care and Consumer Goods industries, on average, received increases in LTI of 30% and 20%, respectively. CFOs in the Technology and Retail industries received the highest increases of 24% and 9%, respectively.
Target Total Compensation
Target total compensation increased over 2011 levels primarily through increases in target annual incentives and, in some industries, through increases in LTI. These findings varied by industry. Financial Services, Pharmaceutical and Retail companies, on average, provided the most significant increases in target annual incentives over other pay components, while Consumer Goods and Health Care industries had the greatest increase in target LTI opportunities.
CONCLUSIONS
Overall, companies had modest increases in target pay levels for the CEO and CFO, through changes in annual and long-term incentives. The Consumer Goods and Health Care industries saw increases in the 15%-20% range driven by higher LTI opportunity while other industries saw more modest changes in total pay levels. Compensation philosophies continue to migrate to median as companies adopt a more conservative pay philosophy. Overall pay mix for the CEO continues to maintain a strong LTI component (66% of pay) with salary representing smaller component of pay (14%), on average. We expect shareholders and proxy advisory firms to continue to influence company pay strategy, as companies to continue to provide modest increases in target total pay mainly through incentive compensation.
|
Industry |
Average Year over Year Change in CEO Target Pay – Top 3 Industries and Overall Sample |
|||
|
Base |
Target Bonus |
LTI |
Target Total Compensation |
|
|
Health Care |
2% |
4% |
30% |
19% |
|
Consumer Goods |
3% |
13% |
20% |
17% |
|
Automotive |
4% |
7% |
7% |
6% |
|
Overall Sample |
3% |
8% |
3% |
3% |
Notable Findings
Total Board Compensation
At median, non-employee director compensation increased three percent in 2012, to $257K, after a six percent increase in 2011 and a flat period in 2010. Year-over-year, median Total Board Compensation increased from $250,000 to $257,0003.
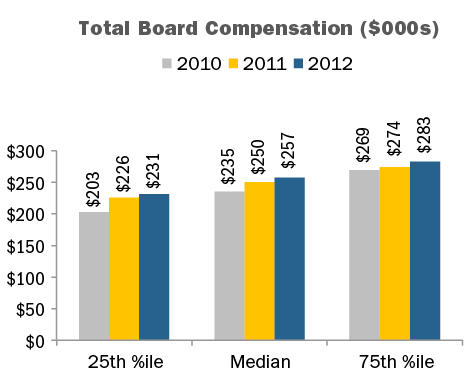
In line with emerging practices, large companies are relying on annual retainers to compensate outside directors. Use of Board meeting fees remained a minority practice in 2012, with only 18 percent of companies paying board meeting fees. This is similar to 2011 and 2010, where 19 percent and 23 percent of companies provided meeting fees, respectively.
Pay Mix
The mix of cash and equity paid to outside directors was generally consistent between 2010 and 2012. On average, the majority of compensation delivered to directors continues to be in the form of equity.
Equity Compensation
Full-value share equity, including restricted stock units, restricted stock, deferred stock units and outright awards of common stock, continues to be by far the most common form of equity delivered to non-employee directors, with only seven percent of companies using stock options as part of the director compensation package.
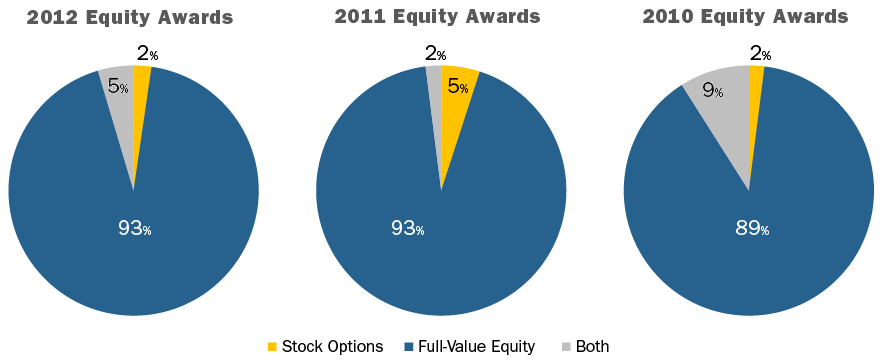
In the recent years, equity awards denominated as a fixed value increased in prevalence, as opposed to awards based on a fixed number of shares.
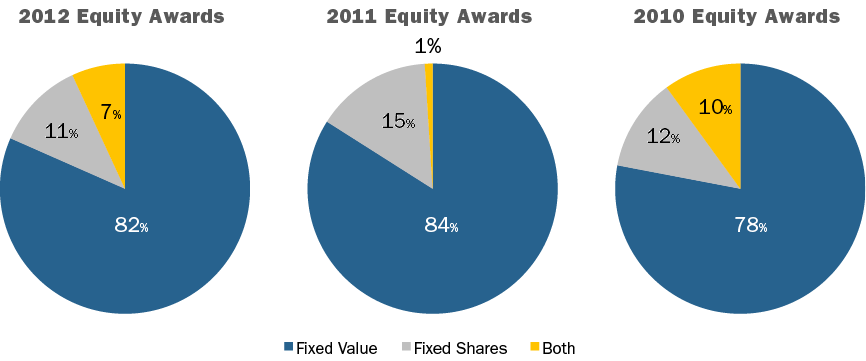
CAP Perspective: Over the next few years, we expect the following changes in director compensation to take place: 1) low-to-mid single-digit annual increases in Total Board Compensation; 2) more companies moving to fixed retainer pay structures with a component in cash and a component in equity as opposed to paying meeting fees; and 3) a continued emphasis on full-value equity awards. Delivering a majority of compensation in the form of equity coupled with stock ownership / retention requirements creates strong alignment with long-term shareholders and is considered a best practice.
Committee Compensation
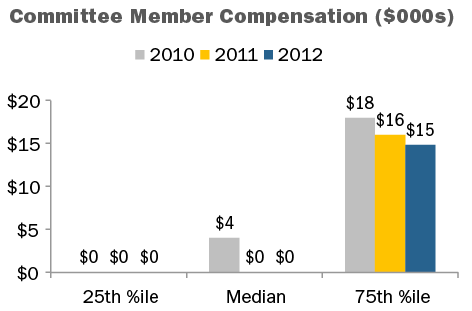
Companies have de-emphasized committee member compensation, instead focusing on overall Board compensation. Our research found that just over 50 percent of companies pay no committee-specific fees to members of any of the three major committees4, similar to 2011 and up from just over one-third in 2010. Since a slight majority of companies do not pay separate fees for committee service, at median committee member compensation is now $05. Among companies that do pay separate fees for committee service, median committee member compensation is $16K.
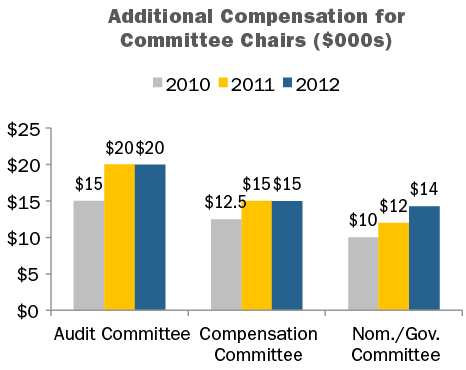
From 2011 to 2012, median additional compensation for committee Chairs remained flat for the Audit and Compensation committees, and increased +17 percent for the Nominating / Governance Committee. Relatively flat year-over-year changes may be associated with a better understanding of the time requirement of the leadership role versus that of a committee member.
CAP Perspective: We expect the trend away from committee member fees to continue, at a slow-to-moderate pace, with the value being rolled into Board cash or equity retainers.
Serving as a committee Chair is generally viewed as a Board leadership role, with additional time requirements, responsibilities, and reputational risk; as a result, additional compensation is often provided for the role.
Near-term, we expect a differential to continue between the additional compensation paid to the Chair of the three major board committees.
Lead/Presiding Directors and Non-Executive Chairmen of the Board
During 2012, the prevalence of providing additional compensation for Lead/Presiding Directors and non-Executive Board Chairs increased to nearly 80 percent, up from approximately 70 percent in 2011 and 65 percent in 2010. In terms of additional compensation for the role, median pay was unchanged at $25,000 in from 2010 to 2012 for Lead/Presiding Directors, and increased slightly for non-Executive Chairs.
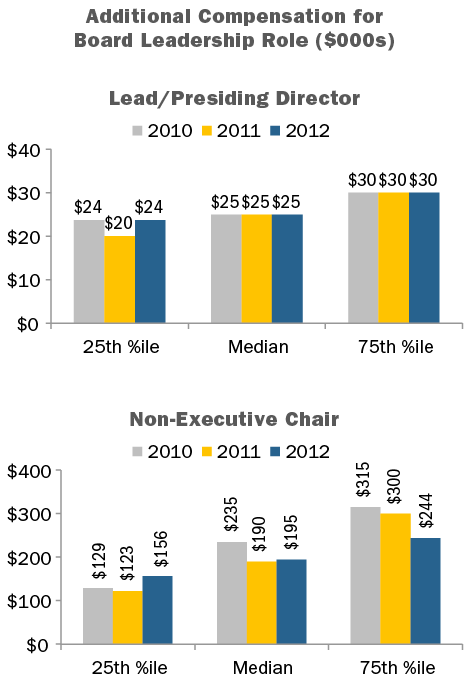
CAP Perspective: While not all non-executive Board leaders receive additional pay for the role, prevalence of additional compensation for these roles is expected to continue to increase over time. The differential in pay between Lead/Presiding directors and non-Executive Chairs is in line with the typical responsibilities of each position.
Conclusion
With the increased scrutiny Boards are under and the time commitment required, in the last five years we have seen a relatively significant increase in non-employee director compensation, though at this point we have hit more of a “steady state” and expect more modest pay level changes going forward. In terms of practices, pay programs have continued a trend towards simplification, as director compensation has become viewed more as an “advisory fee” than an “attendance fee.”
It continues to be important to comprehensively evaluate director pay programs on a regular basis or risk falling behind the curve in terms of desired market positioning and best in class program design. When programs are evaluated, the process and practices listed below should be considered.
|
Best in Class Director Compensation PROCESS |
|
|
Best in Class Director Compensation PRACTICES |
|
1 Analysis includes public Fortune 100 companies (excludes privately held companies).
2 Research assistance for this report was provided by Alex Stahl, Kevin Scott, Armando Rivera and Ryan Colucci.
3 Total Board Compensation reflects all cash and equity compensation for Board and committee service, excluding compensation for additional leadership roles such as committee Chairman, Lead/Presiding director, or non-executive Chairman of the Board.
4 Audit, Compensation and Nominating / Governance committees.
5 Reflects all compensation for committee member service (excludes additional fees for leadership roles), across all Board committees.