- Perquisites represent only a small portion of the total pay program for a CEO or CFO. However, perquisite based pay is – and we expect will continue to be – highly scrutinized
- In 2014 83% of companies provided perquisites to their CEO, and 81% of companies provided perquisites to their CFO
- The four most common CEO/CFO perquisites in 2014 were: personal use of corporate aircraft, auto allowance, personal security and financial planning
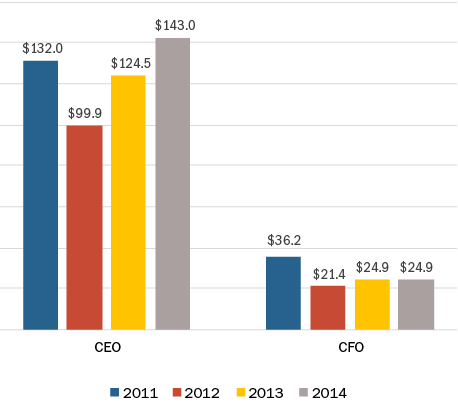
- The median value of total perquisites provided to CEOs increased by approximately 15% to $143,000 in 2014, and was flat at approximately $25,000 for CFOs
Our Survey Sample
Compensation Advisory Partners (“CAP”) reviewed 2015 proxy disclosures at a sample of 100 companies among the Fortune 500, representing nine industry groups. Industry groups included: Automotive, Consumer Goods, Financial Services, Health Care, Insurance, Manufacturing, Pharmaceutical, Retail, and Technology. For the companies studied, the median revenue size and market capitalization was $34 billion and $56 billion respectively.
What We Found
The percentage of companies in our research sample providing perquisites to their CEO stayed constant at 83% from 2013 to 2014. The percentage of companies providing perquisites to CFOs increased 5% from 2013 to 2014 to 81%.
In 2014, the four most common CEO perquisites were: personal use of corporate aircraft (56%), automobile allowance (31%), personal security (29%) and financial planning (24%). While the prevalence of personal use of corporate aircraft was generally flat from 2012 to 2014, the prevalence of automobile allowances, personal security and financial planning decreased sharply (approximately 30– 40%) over the past two years.
CEO Perquisite Prevalence
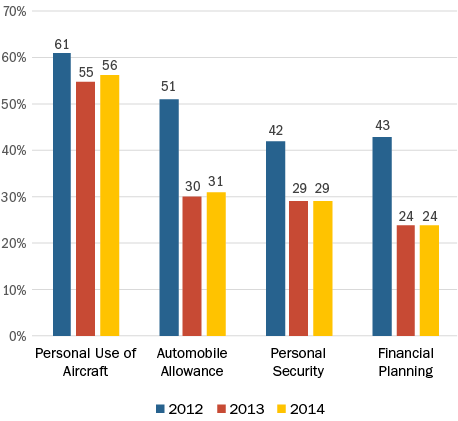
Although the prevalence of major perquisites remained steady in 2014 for CEOs compared to the prior year, the median total value for CEO perquisites increased 15% to $143,000. This value has ranged from $100,000 to $143,000 over the last four years. In contrast, the median value of perquisites for CFOs was relatively flat year-over-year, and has ranged from $21,000 to $36,000 since 2011.
Median CEO and CFO Perquisites Value ($000s)
Perquisites represent only a small portion of an executive’s total compensation, yet are often highly scrutinized. Shareholders prefer that pay be delivered in performance-based vehicles instead of through perquisites. Over the past few years, a number of companies changed their perquisite programs in reaction to increased shareholder scrutiny and specific feedback received from shareholders or proxy advisory firms. However, given fairly consistent prevalence over the past 2 years, data suggests that changes to company perquisite programs may have leveled off. PNC was the only company making a change to a perquisite program in our sample for 2014, increasing their annual perquisite limit from $10,000 to $20,000 for each NEO, other than for the CEO.
|
Perquisites Change Reported in CD&A |
2014 n=1 |
2013 n=7 |
2012 n=9 |
2011 n=14 |
||||
|
# of Cos. |
# of Cos. |
# of Cos. |
# of Cos. |
# of Cos. |
# of Cos. |
# of Cos. |
# of Cos. |
|
|
Eliminated perquisites |
0 |
0% |
6 |
75% |
2 |
22% |
9 |
56% |
|
Eliminated tax gross-ups on perquisites |
0 |
0% |
1 |
13% |
4 |
44% |
6 |
38% |
|
Reduced perquisite program/value |
0 |
0% |
1 |
13% |
2 |
22% |
1 |
6% |
|
Changed perquisite program |
1 |
100% |
0 |
0% |
1 |
11% |
0 |
0% |
Note: Percentages do not add up to 100% due to multiple changes by companies
Conclusion
While Compensation Committees continue to monitor the appropriateness (and competitiveness) of perquisite programs, as well as dollar values and overall executive usage, the degree to which executive perquisites are provided appears to have leveled off. We expect that companies will continue to closely align executive compensation with shareholder interests by limiting non-performance-based compensation, such as perquisites. We caution that any potential (perceived) misuse of executive perquisites will continue to raise the ire of shareholders and proxy advisory firms and provide for headline news.
Annually, Compensation Advisory Partners (CAP) evaluates pay levels for Chief Financial Officers (CFOs) and Chief Executive Officers (CEOs). This year’s analysis is based on a sample of 108 companies with median revenues of $12.4 billion. For more information on how we developed the sample of companies, please see below under Sample Screening Methodology.
Highlights
- Salary increases were provided much more frequently to CFOs, with approximately 70% receiving a salary increase, than to CEOs
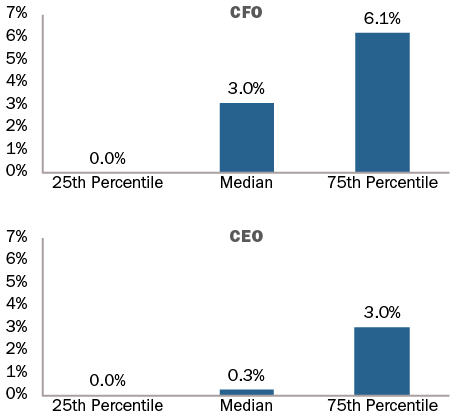
- The median salary increase was only 0.3% for CEOs, while CFO salaries grew by 3.0%
- Similar to last year, the median increases in actual total direct compensation (i.e., cash plus equity) for both CEOs and CFOs, were in the low single-digits
- 2014 median increases in actual total direct compensation were 3.2% for CEOs and 5.2% for CFOs
- Slightly higher pay growth for CFOs was partially driven by higher annual bonus target opportunities in 2014
- On an absolute basis, CFO total compensation continues to approximate one-third of CEO total compensation
- Little or no changes observed in how long-term incentives are delivered to CEOs and CFOs; Long-term incentive mix continues to emphasize performance-based equity
Study Results
Salaries
In the last 2 years, approximately 70% of CFOs received salary increases. The median salary increase for CFOs was 3.0% and the 75th percentile salary increase was 6.1%. In comparison, only about half of CEOs received salary increases. The median salary increase for CEOs was only 0.3% at median and the 75th percentile salary increase was 3.0%.
|
% of Executives Receiving Salary Increases |
||||
|
|
2012 – 2013 |
2013 – 2014 |
||
|
|
No Increase |
Receiving Increase |
No Increase |
Receiving Increase |
|
CEO |
52% |
48% |
49% |
51% |
|
CFO |
31% |
69% |
28% |
72% |
2014 Salary Increases
Actual Pay Levels
Our findings indicate a median rate of increase in actual total direct compensation levels for both CEOs and CFOs in the low-single digits. The median increases over the last two years ranged between 3% and 5%. During 2013-2014, actual total direct compensation (salary plus actual annual incentive plus the grant date value of long-term incentives) for CEOs and CFOs increased by 3.2% and 5.2%, respectively.
Industry Trends
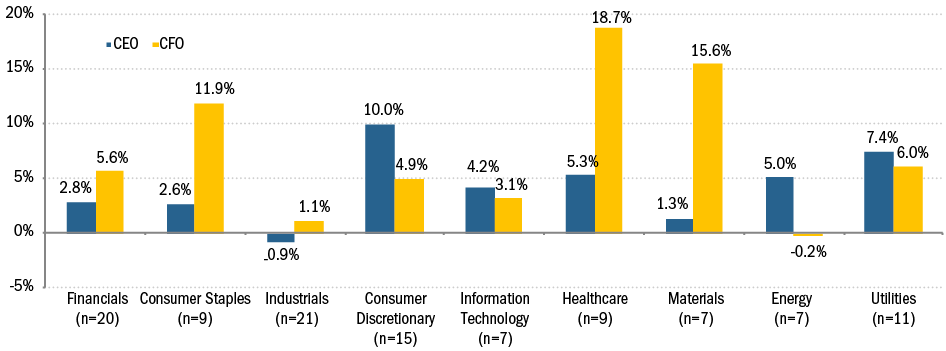
2014 Median Salary Increase by Industry
2014 Median Actual Total Compensation Increase by Industry
|
Median Percentage Change in Pay Components |
||||
|
|
2012 – 2013 |
2013 – 2014 |
||
|
Pay Components |
CEO |
CFO |
CEO |
CFO |
|
Salary |
0% |
3.0% |
0.3% |
3.0% |
|
Actual Bonus |
4.1% |
3.7% |
4.3% |
7.8% |
|
Long-Term Incentives |
2.3% |
3.1% |
3.7% |
4.2% |
|
Actual Total Direct Compensation |
3.7% |
3.6% |
3.2% |
5.2% |
As seen in the table above, the median 2014 increase in actual bonus for CFOs was double the median increase for CEOs. This large increase in annual bonus is partially driven by higher bonus target opportunities in 2014 for CFOs, with the median target bonus increasing from 90% to 100% of salary. In contrast, CEO target bonus opportunities remained relatively flat at approximately 150% of salary.
|
Target Bonus as % of Salary |
||||
|
|
2013 |
2014 |
||
|
Pay Components |
CEO |
CFO |
CEO |
CFO |
|
25th Percentile |
125% |
75% |
125% |
80% |
|
Median |
147% |
90% |
150% |
100% |
|
75th Percentile |
170% |
100% |
165% |
105% |
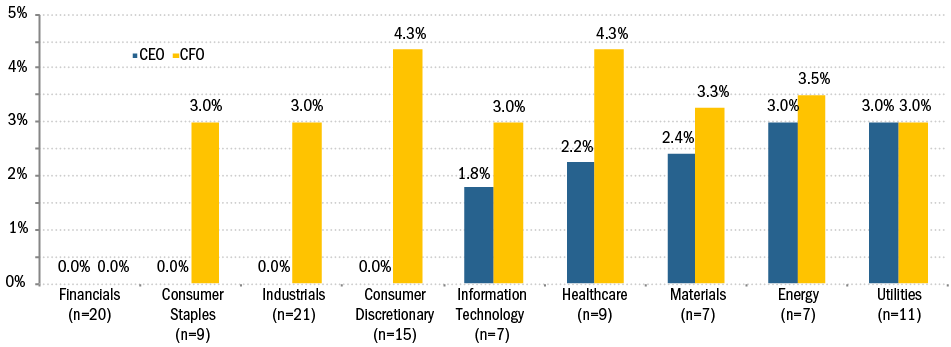
When analyzed by industry, median increases in salary for CEOs are generally less than 3%. Median salary increases to CFOs are much more robust, generally in the range of 3-4%. Median salary increases over 3% are seen for CFOs in the following industries: Consumer Discretionary, Energy, Healthcare, and Materials. The Financials industry is the only industry were the median change in salary was 0% for both CEOs and CFOs.
When we look at actual total direct compensation by industry, greater volatility is observed. The volatility in year-over-year changes is primarily driven by industry and company performance. Some of the largest increases in compensation levels are seen in Consumer Staples, Healthcare and Materials.
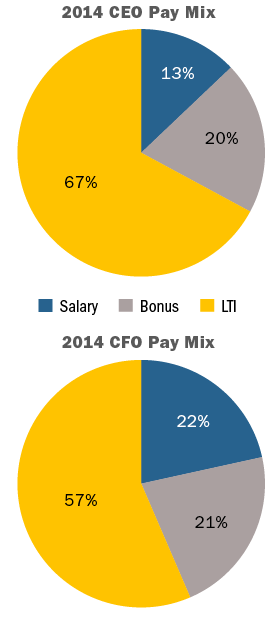
Target Pay Mix
The average total target compensation pay mix remained largely unchanged. At-risk pay continues to be more emphasized for CEOs than for CFOs.
Long-Term Incentive (LTI) Vehicle Prevalence and Mix
Equity mix and vehicles used for LTI awards remained fairly consistent for the past several years. The majority of companies continue to use two different vehicles to deliver long-term incentives to CEOs/CFOs and a quarter of companies studied use all three equity vehicles (time-based stock awards, awards under a performance plan, and stock options)
Performance plans account for roughly 50% of LTI awards, about 25% is delievered in stock options, and about 25% in time-vested restricted stock awards. The overall percentage of performance-based awards (performance plans and stock options) for both CEOs and CFOs continues to range between 75% – 80%.
|
LTI Mix |
||||
|
|
2013 |
2014 |
||
|
|
CEO |
CFO |
CEO |
CFO |
|
Stock Options |
27% |
27% |
26% |
25% |
|
Time Vested Restricted Stock |
17% |
22% |
21% |
26% |
|
Performance Plans |
56% |
51% |
53% |
49% |
Conclusion
In terms of performance, 2014 was a good year for our sample of companies with median total shareholder return of 15%, median revenue growth of 5% and median net income growth of 9%. We believe the 2014 pay changes were aligned with performance for the year. For CEOs, salary increases were modest, but increases in actual bonus and long-term incentives contributed to a median increase in actual total direct compensation of 3.2%. Pay progression opportunities for CFOs were even stronger, with a median increase of 7.8% in actual bonus and 4.2% in long-term incentives yielding a 5.2% median increase in actual total direct compensation.
In terms of compensation program design for senior executives, we saw relatively little change. The increase in annual target bonus opportunity for CFOs was noteworthy, but long-term incentives practices are similar to last year’s study. The increase in performance-based long-term incentives is significant and we expect this to remain the mainstream practice.
Sample Screening Methodology
Based on the screening criteria below, we arrived at a sample of 108 public companies with median 2014 revenue of $12.4B.
|
Revenue |
At least $5B in revenue for fiscal year 2014 |
|
Fiscal year-end |
Fiscal year-end between 9/1/2014 and 12/31/2014 |
|
Proxy Statement Filing Date |
Proxy statement filed before 3/31/2015 |
|
Tenure |
No change in CEO and CFO incumbents in the past three years |
|
Industry |
All industries have been considered for this analysis |
Key Takeaways
- Compensation Committees face intense scrutiny with respect to executive annual bonus payouts and their alignment with performance
- Over a multi-year period, executives tend to earn an annual incentive payout approximately 90% of the time
- As a general rule of thumb, based on analysis of the past 6 years, the degree of difficulty, or “stretch”, embedded in performance goals translates to:
- A 90% chance of achieving Threshold performance
- A 70% chance of achieving Target performance
- A 15% chance of achieving Maximum performance
- This pattern indicates that threshold and target performance goals are set at attainable levels, but maximum payouts commonly reflect rigorous goals and superior performance
- Annual incentive payouts have generally been aligned with financial performance over the past six years for the companies reviewed
Background
Goal setting is one of the most challenging aspects of the compensation process. Compensation Committees struggle with this critical activity and try to determine if they are “getting it right”. Goals tied to annual incentive compensation face scrutiny from both internal and external stakeholders, pressuring Committees to achieve a balance between the rigor and the attainability of their goals. Appropriate performance targets will motivate and retain executives while driving corporate performance and creating returns for shareholders.
Summary of Findings
Plan Design
Annual incentive plans can be categorized as either “Goal Attainment” plans or “Discretionary” plans. Goal attainment plans contain traditional performance and payout scales that consist of a pre-determined minimum, target and maximum level of performance and corresponding payouts. Discretionary annual incentive plans allow the Committee to determine payouts by using discretion and targets are not necessarily defined up front.
In this study, we found that 71% of the sample companies have goal attainments plans. Discretionary plans are most prevalent among Financial Services companies. Our analysis focuses on those companies with goal attainment plans.
|
Plan Type |
|||
|
Industry |
Sample Size |
Goal Attainment |
Discretionary |
|
Auto |
n= 7 |
100% |
0% |
|
Consumer Discretionary |
n= 10 |
90% |
10% |
|
Consumer Staples |
n= 11 |
91% |
9% |
|
Financial Services |
n= 12 |
17% |
83% |
|
Healthcare |
n= 10 |
100% |
0% |
|
Industrials |
n= 14 |
79% |
21% |
|
Insurance |
n= 11 |
45% |
55% |
|
IT |
n= 12 |
75% |
25% |
|
Pharma |
n= 10 |
60% |
40% |
|
Total |
n= 97 |
71% |
29% |
Performance Metrics
In most goal attainment plans, awards are earned based on corporate performance related to two or three metrics. While the metrics vary by industry, some of the most common metrics are revenue and profitability. These metrics are popular because they are indicators of financial health to the investment community. From an internal perspective, revenue and profitability are simple to understand and in the “line of sight” for most executives in that the correlation can be seen between actions/decisions and results. From an external perspective, most shareholders would support an above target payout for executives who are driving top-line growth while maintaining or expanding margins.
|
# of Metrics Used in Goal Attainment Plan |
||||
|
Industry |
1 Metric |
2 Metrics |
3 Metrics |
4+ Metrics |
|
Auto |
0% |
43% |
57% |
0% |
|
Consumer Discretionary |
33% |
22% |
45% |
0% |
|
Consumer Staples |
20% |
40% |
10% |
30% |
|
Financial Services |
0% |
50% |
50% |
0% |
|
Healthcare |
20% |
50% |
20% |
10% |
|
Industrials |
27% |
55% |
9% |
9% |
|
Insurance |
0% |
40% |
40% |
20% |
|
IT |
11% |
22% |
56% |
11% |
|
Pharma |
0% |
0% |
50% |
50% |
|
Total |
16% |
36% |
33% |
15% |
Pay and Performance Scales
At companies with goal attainment plans, Compensation Committees must annually approve minimum, target and maximum goals and corresponding payout levels, for each metric in the incentive plan. Among companies included in our research, the most prevalent payout scale awarded executives 50% of target for threshold performance and 200% of target for maximum performance. Companies most often structure payout scales so that executives will earn 100% of their target annual incentive award for target performance and the actual payout is interpolated between threshold and target and target and maximum.
Annual Incentive Plan Payouts Relative to Goals
All Companies
Based on CAP’s review of annual incentive payouts, companies achieve threshold performance goals 90% of time. Annual incentive payouts most often fall between target and maximum. Companies’ annual incentive plans pay at this level 48% of the time or approximately one out of every two years. Executives earn bonuses in the range of threshold to target about 20% of the time, roughly once in every five years. Approximately 10% of the time, companies do not achieve threshold and executives do not earn a bonus. Payouts for the total sample are distributed as indicated in the following charts:
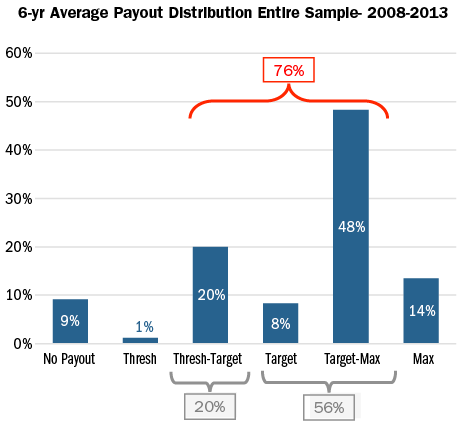
This analysis of the payout distribution is helpful in defining the degree of difficulty, or “stretch”, embedded in performance goals. Our analysis can be summarized with the following rule of thumb where Compensation Committees structure annual bonus performance goals with:
- A 90% chance of achieving Threshold performance
- A 70% chance of achieving Target performance
- A 15% chance of achieving Maximum performance
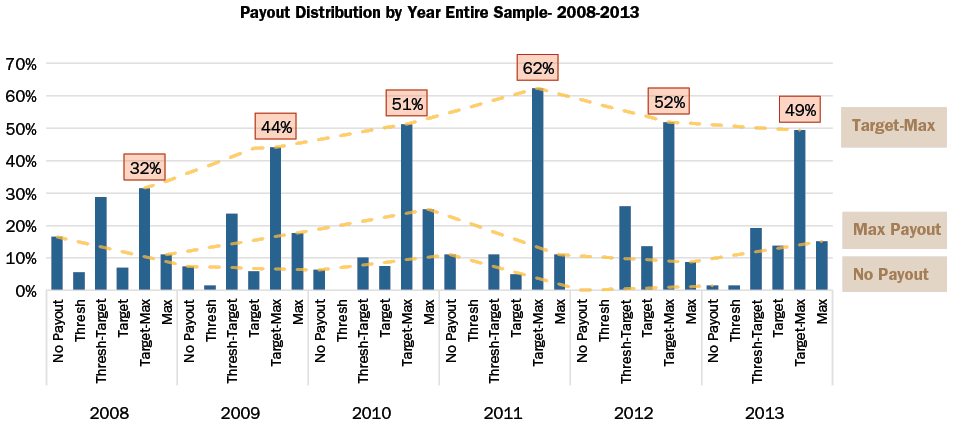
When the payout distributions are reviewed by year, the percentage of companies that paid target to maximum steadily increased from 2008-2011. This reflects an improvement in the overall economy since the financial crisis in 2008 as well as a greater ability to forecast performance in a more stable environment.
By Industry
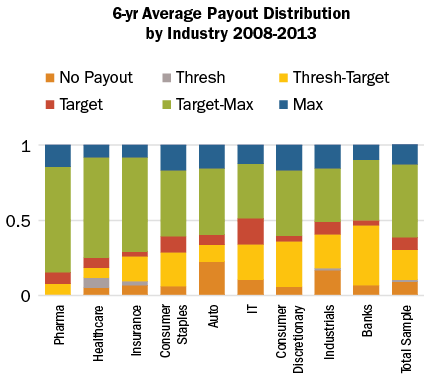
While historical payout levels vary by industry, all industries, on average, have most frequently paid bonuses between target and maximum. The Auto and Industrials industries are notable outliers in that executives received zero payouts once in every four years and once in every five years, respectively, likely indicative of industry dynamics and macro-economic conditions more than overly rigorous goal setting. Most cases when Auto companies did not pay annual incentives occurred in 2008, the peak of the financial crisis. Average payouts for each industry are distributed as indicated in the following chart:
Relative to Performance
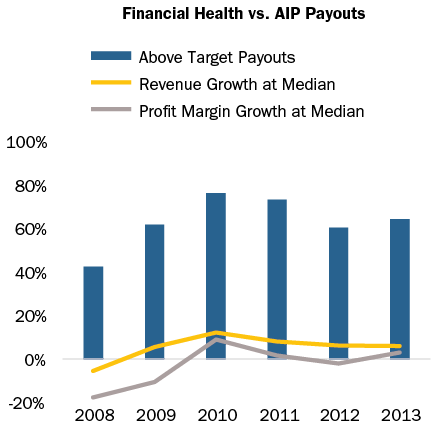
Over the past 6 years, the number of above target annual incentive payouts in a given year has generally tracked revenue growth and profit margin growth in the same year. In particular, payouts at Industrial and Pharmaceutical companies have aligned directionally with revenue and profit margin growth. This pay and performance relationship is key to aligning executives’ interests with those of shareholders. If the company exceeds anticipated performance, executives will earn above target payout levels without contest from internal or external stakeholders; however, if an executive is able to achieve extraordinary levels of pay without extraordinary performance, Committees risk facing opposition from shareholders and proxy advisory firms.
The chart below depicts the relationship between median revenue and profit margin growth and above target annual incentive payouts.
Conclusion
Threshold and target annual incentive performance goals are intended to be challenging but attainable. Maximum performance goals are meant to be attained only when executives achieve exceptional performance, exceeding internal/external expectations. Our study supports the formulation of a general rule of thumb, based on analysis of the past 6 years, where the degree of difficulty, or “stretch”, embedded in performance goals translates to:
- A 90% chance of achieving Threshold performance;
- A 70% chance of achieving Target performance; and
- A 15% chance of achieving Maximum performance.
This distribution indicates that Compensation Committees have built an appropriate degree of stretch into annual incentive plans overall.
We believe that when Committees set performance goals, they are influenced by prior year performance as well as economic and industry outlooks. Yet when measuring the directional trend over the past six years, we believe that Compensation Committees are adequately aligning internal performance goals with incentive payout objectives, and developing rational stretch above and below target — thus striking the right balance between the size and frequency of annual incentive payouts.
Methodology
Compensation Advisory Partners (“CAP”) reviewed the annual incentive plan designs of approximately 100 large companies representing a cross-section of industries. The companies included in this study have median revenues of $33 billion, a median market cap of $52 billion and a median 6-year total shareholder return of 9%, through year end 2013.
CAP analyzed the annual incentive plan payouts of the companies in the sample over the past 6 years to determine the distribution of incentive payments and the frequency with which executives typically achieve target payouts. In this analysis, CAP categorized actual bonus payments (as a percent of target) into one of six categories based on payout ranges as depicted in the following chart:
|
Payout Category |
Payout Range |
|
No Payout |
0% |
|
Threshold |
Up to 5% above Threshold |
|
Threshold – Target |
5% above Threshold to 5% below Target |
|
Target |
+/- 5% of Target |
|
Target – Max |
5% above Target to 5% below Max |
|
Max |
5% below Max to Max |
KEY TAKEAWAYS
- The use of performance-based long-term incentives (“LTI”) continues to be the prevailing practice, constituting more than 50% of the typical LTI program for Named Executive Officers (“NEO”)
- Companies have been re-examining the mix of components in their LTI program and actively increasing performance-based awards, while de-emphasizing stock options and time-based restricted stock
- While used to a lesser extent, stock options and time-based restricted stock continue to be part of the LTI program for many NEOs
- The most prevalent metrics used in performance-based LTI plans are return measures, such as ROI, Total Shareholder Return (“TSR”) and Earnings Per Share (“EPS”)
- Many companies have decided that the use of a two-pronged approach of measuring performance results against both internal goals and relative to the external market is a best practice
Compensation Advisory Partners (“CAP”) reviewed 2014 proxy disclosures for a 100 company subset of the Fortune 500 representing a cross-section of nine industry groups. The industry groups included: Automotive, Consumer Goods, Financial Services, Health Care, Insurance, Manufacturing, Pharmaceutical, Retail, and Technology. Our research examined changes in executive compensation practices in 2013, or indicated for 2014, and observations on current trends and pay program design. This CAPflash focuses on long-term incentive plan design and notable trends including changes made in 2013 or planned for 2014.
The companies included in this study have a median revenue size and market capitalization of $32B and $52B, respectively. The median total shareholder return was 43% for 2013.
TRENDS IN LONG-TERM INCENTIVE PLAN DESIGN
51% of companies in our study made changes to the LTI plan design in 2013 or for 2014. Companies continue to reduce the emphasis on time-based restricted stock and stock options and deliver a greater portion of LTI compensation in the form of performance-based equity or cash awards. Among companies that changed their LTI mix, most companies reduced the emphasis on stock options (71%) and/or increased the emphasis on performance-based LTI (67%). 33% of companies that changed the LTI mix reduced the emphasis on time-based restricted stock.
This continued shift towards performance-based LTI compensation reflects an effort by companies to respond to shareholder feedback and align executives’ pay with performance. Target Corporation, for example, responded to a number of shareholder comments calling for a greater link between pay and performance. In 2013, Target eliminated the use of stock options (which represented 75% of total LTI in 2012) in favor of a 100% performance-based LTI program.
The overarching priority for many companies is to use LTI vehicles that best align with their business strategy and unique shareholder value proposition. For example, Aetna, Inc. replaced performance-based market share units (“MSUs”) with time-based stock appreciation rights (“SARs”) in 2014. Aetna disclosed that the longer term nature (10 years) of SARs “…supports the Company’s long-term strategic focus to drive change in the healthcare industry and to create long-term shareholder value.” Another example is Pfizer, Inc. which grants 5- and 7-year Total Shareholder Return Units (“TSRUs”). Pfizer discloses that the value executives realize from TSRUs “…is consistent with the value received by Pfizer’s shareholders.”
The table below outlines the reported changes among companies in our study:
|
Type of Change Reported in CD&A |
2013 No. of Cos. |
% of Cos. |
|
|
2013 (n = 51) |
2012 (n = 55) |
||
|
Change in mix of LTI award vehicles |
21 |
41% |
44% |
|
Change in performance plan metric |
17 |
33% |
27% |
|
Add or eliminate LTI vehicle |
10 |
20% |
36% |
|
Change in LTI award target opportunity level |
7 |
14% |
13% |
|
Change in performance plan comparison/peer group |
2 |
4% |
5% |
|
Other |
10 |
20% |
20% |
Note: Percentages add to greater than 100% due to multiple changes by certain companies.
PREVALENCE OF LONG-TERM INCENTIVE VEHICLES
Over the past three years, the prevalence of stock options has declined slightly and the use of time-based restricted stock has been relatively flat. Companies tend to grant these vehicles as a supplement to performance-based LTI.
Below is the breakdown of the percentage of companies granting each LTI vehicle to NEOs from 2011-2013:
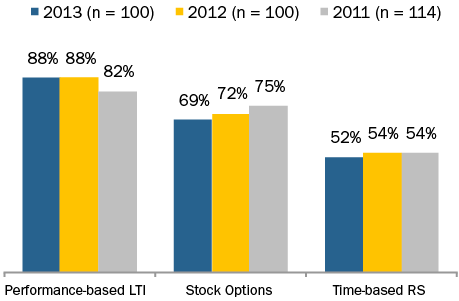
Note: Percentages add to greater than 100% because most companies grant a variety of vehicles.
Companies continue to use multiple vehicles to deliver LTI to executives. 51% of companies in our study deliver LTI in the form of two vehicles, 29% use three vehicles and 20% use only one vehicle. Among the companies that deliver LTI compensation through one vehicle, 60% grant only performance-based LTI.
LONG-TERM AWARD MIX
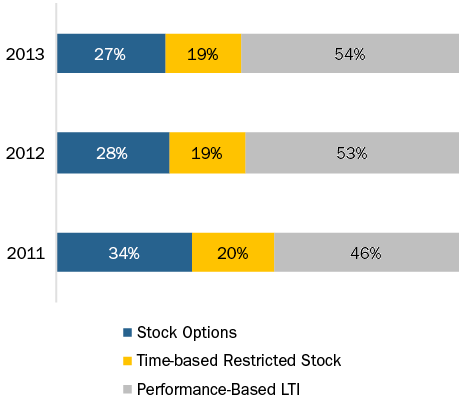
The average LTI mix in 2013 is generally consistent with 2012. Performance-based LTI continues to represent more than half of the LTI mix (approximately 55% of total LTI) while stock options represent approximately 25% and time-based restricted stock represents 20%.
The chart below depicts the average LTI mix for NEOs as disclosed in the CD&A:
PERFORMANCE-BASED LTI METRICS
Companies routinely reassess their LTI plan design, including the performance metrics used, to ensure that the design reflects the company’s business strategy and objectives to attract, incentivize and retain executives. Among performance-based LTI plans, the use of a return measure increased to 49% in 2013 (up from 41% in 2011) indicating that companies are trying to encourage operational efficiency, along with profitability and growth. Among the companies that use return measures, 47% use ROI or ROIC, 37% use ROE and 16% use ROA. TSR and EPS are also prevalent long-term incentive metrics, used by 42% and 36% of companies, respectively. In our study, most companies with performance-based LTI plans use two metrics.
Companies are also more likely to use LTI metrics that reflect key measures of success in their industry. The Automotive industry frequently uses Cash Flow as a metric, focusing executives on liquidity to manage the significant cash requirements associated with the industry. In the Pharmaceutical and Technology industries, where the success of a company’s pipeline and current product offerings is reflected in their stock price, TSR is used more frequently as a metric.
Overall, 49% of companies in our study measure performance relative to the external market (typically using TSR) and 89% measure performance against pre-established goals (typically internal financial metrics). Although the use of relative TSR has increased slightly since 2011, the use of absolute internal financial metrics is most prevalent. Approximately 92% of companies that use TSR, measure performance relative to a defined comparator group (54% use a defined peer group, 40% use a broader industry index and 6% use both) while nearly 95% of companies measure financial performance against pre-established goals based on the business plan.
In recent years, companies have moved away from using only absolute or relative performance measures and instead frequently use a two-pronged approach. In 2013, 37% of companies used both absolute and relative performance measures compared with 24% in 2011. The use of both absolute and relative performance measures allows companies to evaluate performance from a balanced perspective, considering both internal and external results.
The chart below displays the prevalence of LTI metrics for performance-based awards in 2011-2013:
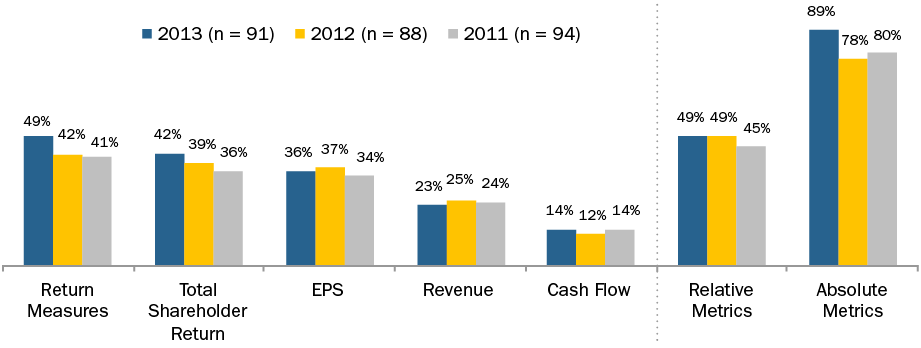
Note: Percentages add to greater than 100% due to multiple responses. Return measures reflect ROE, ROIC and ROA
CONCLUSIONS
The role played by performance-based LTI within LTI programs continues to grow. Performance-based LTI constitutes 54% of total LTI, on average, for NEOs. As performance-based LTI grows, the use of stock options and time-based restricted stock has been declining; however, these vehicles often have a role in a well-designed LTI program since stock option value depends on longer-term stock price appreciation and time-based restricted stock serves as an excellent retention vehicle.
The most commonly used metrics are return measures, such as ROI, as well as TSR and EPS. These metrics demonstrate that companies are attempting to use LTI to incentivize operational efficiency, profitability and growth. While most companies evaluate financial performance against internal goals, a growing number of companies have adopted a two-pronged approach to long-term performance measurement. These companies use internal financial goals and also incorporate a relative goal (typically TSR) to measure company performance in the context of the external market.
While most companies have already implemented changes that provide for a stronger link between executive pay and company performance, we expect to see companies continue to refine their performance-based LTI plans to support their business strategy. Additionally, we expect that setting meaningful long-term financial goals will continue to be a challenge for many companies leading some to incorporate relative performance metrics in the LTI program.
HIGHLIGHTS
- Companies rarely make wholesale changes to plans, but frequently revisit the performance metrics used
- Most companies use multiple measures to ensure the plan provides balance and aligns with overall business strategy
- Overall, 2013 annual incentive payouts were higher than in 2012 indicating stronger performance
Survey Sample
Compensation Advisory Partners (“CAP”) reviewed 2014 proxy disclosures at a sample of 100 companies among the Fortune 500 representing nine industry groups. Industry groups included: Automotive, Consumer Goods, Financial Services, Health Care, Insurance, Manufacturing, Pharmaceutical, Retail, and Technology. For the companies studied, the median revenue size and market capitalization was $32B and $52B, respectively. The median 2013 total shareholder return (TSR // change in stock price plus dividends) was 43%.
CHANGES IN ANNUAL INCENTIVE PLAN DESIGN
Overall, 34% of companies in CAP’s study changed their annual incentive plan design in 2013 or 2014. The most common changes were to the performance metrics used to fund awards (47% of the companies making a change) or to the weightings applicable to performance metrics (32%). Another frequent change was to increase the target award opportunities offered to Named Executive Officers; reductions in target awards were made much less frequently. These changes, as well as other modifications shown in the chart on the right, illustrate that companies continue to review and enhance the pay-for-performance relationship through changes to the annual incentive program.
|
Type of Change Reported in CD&A |
2013 No. of Cos. |
% of Cos. Reporting Changes |
||
|
2013 (n = 34) |
2012 (n = 37) |
2011 (n = 43) |
||
|
Change in performance metrics used to fund awards |
16 |
47% |
43% |
28% |
|
Change in performance metric weighting/mix |
11 |
32% |
35% |
42% |
|
Increased/Reduced target award opportunities (CEO and/or CFO) |
11 |
32% |
11% |
21% |
|
Other changes |
4 |
12% |
22% |
19% |
|
Change in maximum award payout |
3 |
9% |
8% |
12% |
Note: Due to multiple changes, does not add up to 100%.
Change in Performance Metrics
Among the companies that changed the annual incentive performance metrics, about one-half of companies modified plan metrics while maintaining the current number of metrics to better align pay with performance:
- Ten (10) companies kept the same number of metrics but replaced a metric in the incentive plan
- Four (4) companies reduced the number of metrics, and
- Two (2) companies added metrics to the current plan.
Several companies indicated that their rationale for changing annual incentive metrics was, in large part, to have a more holistic view of overall company performance and to better align incentives with their business strategy:
- AFLAC Inc: Added Operating Return On Equity (OROE) as a performance metric for senior vice presidents and above; this metric allows shareholders to evaluate AFLAC’s financial achievements relative to other organizations in terms of how effectively capital is used to generate earnings
- Danaher Corp: Added Return On Investment Capital (ROIC) in order to help validate the efficiency of earnings and complement the cash flow metric
- United Technologies Corp: Changed the earnings metric from EPS to Net Income since Net Income is not impacted by share repurchases
- Bristol-Myers Squibb: Replaced Adjusted Net Cash Flow from Operations with a metric for pipeline performance that consists of regulatory submissions and approvals and is a better indication of long-term growth potential.
Change in Target Bonus Opportunity
In 2013, median target bonus opportunities for CEOs increased (by 9 percentage points), while the opportunities for CFOs decreased (by 3 percentage points). Most notably, target bonus opportunity for CEOs in the Automotive, Insurance, and Retail industries increased by 10 percentage points year over year. However, the Technology industry experienced a significant decrease (21 percentage points) due to an increase in the base salary for Cisco’s CEO (from $375,000 to $1,100,000) and a decrease in the target opportunity for the new CEO at Intel (from 462.7% of base salary to 239.2%).
Median target bonus opportunity for CFOs in the Automotive industry experienced a decrease of 5 percentage points in 2013 largely due to the promotion of a new CFO at Goodyear (target opportunity decreased from 91% to 63% of base salary). Conversely, target bonus opportunity for CFOs in the Insurance industry increased (8 percentage points) in 2013; all other industries saw little movement to the target bonus opportunity.
|
Industry |
Median Target Bonus as a % of Salary |
|||||
|
CEO |
CFO |
|||||
|
2013 |
2012 |
2011 |
2013 |
2012 |
2011 |
|
|
Automotive |
135% |
125% |
130% |
85% |
90% |
88% |
|
Consumer Goods |
160% |
160% |
170% |
93% |
95% |
100% |
|
Financial Services |
n/m |
n/m |
n/m |
n/m |
n/m |
n/m |
|
Health Care |
150% |
145% |
145% |
100% |
101% |
100% |
|
Insurance |
210% |
200% |
200% |
133% |
125% |
120% |
|
Manufacturing |
157% |
154% |
156% |
100% |
97% |
95% |
|
Pharmaceutical |
150% |
150% |
150% |
98% |
97% |
91% |
|
Retail |
180% |
170% |
168% |
85% |
83% |
85% |
|
Technology |
210% |
231% |
200% |
130% |
131% |
121% |
|
Total Sample |
166% |
157% |
153% |
100% |
103% |
100% |
Note: Financial Services industry is excluded since most companies in our study do not disclose target bonus opportunities for the Named Executive Officers.
ANNUAL INCENTIVE PLAN DESIGN / PRACTICES
Award Leverage
Disclosure of the payout range (i.e., both threshold and maximum payout as a percentage of target) is a limited practice as most companies reviewed did not disclose a threshold level of performance required to receive a bonus payment. For the 37 companies that disclose a threshold bonus, 50% of target is the most common payout percentage. However, 20 companies disclose a minimum bonus payout of less than 50% of target; a majority of these companies provide a payout based on multiple plan metrics.
Approximately 75% of companies disclose the maximum bonus opportunity. A majority (60%) have a maximum bonus opportunity of 200% of target bonus. Ten (10) companies have a maximum bonus of 250% of target or higher. A majority of these companies are in the Consumer Goods, Pharmaceutical, and Technology industries.
|
Threshold as a % of Target (n=37) |
Maximum as a % of Target (n = 73) |
|||||
|
Range |
# of Cos. |
% of Cos. |
Range |
# of Cos. |
% of Cos. |
|
|
< 25% |
10 |
27% |
> 125% < 150% |
2 |
3% |
|
|
> 25% < 50% |
10 |
27% |
> 150% < 200% |
14 |
19% |
|
|
50% |
13 |
35% |
200% |
44 |
60% |
|
|
> 75% < 100% |
4 |
11% |
> 200% < 250% |
3 |
4% |
|
|
> 250% |
10 |
14% |
||||
Annual Incentive Plan Metrics
EPS, Revenue, Cash Flow and Operating Income are the most prevalent metrics used in annual incentive plans. Although EPS is the most common metric overall, it is the most common metric for only two industries (Financial Services and Healthcare). Revenue, the second most common metric, is the most prevalent in four industries (Consumer Goods, Pharmaceutical, Retail and Technology). Our findings suggest that EPS is used more broadly across industries while Revenue tends to be used in consumer-driven industries.
Most companies (approximately 70%) use more than one performance metric in the annual incentive plan. 25% of companies disclose using two (2) metrics in their annual incentive programs, 25% use three (3) metrics, and 21% of companies use four (4) or more metrics. Approximately 62% of these companies use a profit-based metric in combination with Revenue and/or Cash Flow.
The chart below shows the three (3) most metrics by industry in 2013:
|
Industry |
Metric #1 |
Metric #2 |
Metric #3 |
|
Automotive |
Cash Flow (45%) |
EBIT (45%) |
ROA (27%) |
|
Consumer Goods |
Revenue (67%) |
EPS (58%) |
Cash Flow (33%) |
|
Financial Services |
EPS (33%) |
ROE (17%) |
Op. Income (8%) |
|
Health Care |
EPS (40%) |
Op. Income (30%) |
EBIT (30%) |
|
Insurance |
Op. Income (46%) |
Op. ROE (23%) |
Op. EPS (15%) |
|
Manufacturing |
Cash Flow (30%) |
EPS (30%) |
Revenue (20%) |
|
Pharmaceutical |
Revenue (70%) |
EPS (70%) |
Pipeline/R&D (50%) |
|
Retail |
Revenue (40%) |
Op. Income (40%) |
EBIT (30%) |
|
Technology |
Revenue (58%) |
Cash Flow (50%) |
Op. Income (33%) |
Note: Percentages reflect the prevalence of companies disclosing the metric.
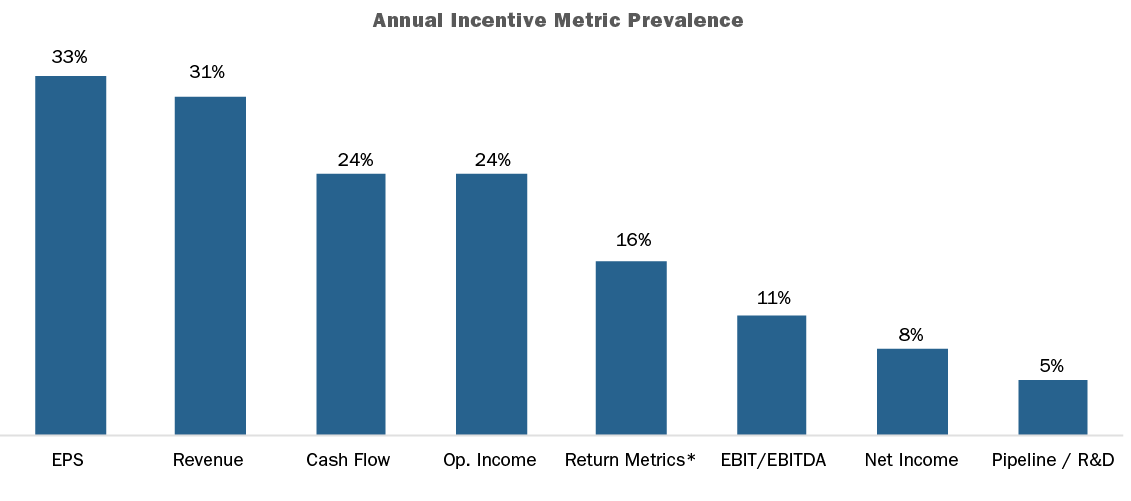
*Return metrics include: ROE, Op. ROE, ROA, and ROI/ROIC
2013 Actual Bonus Payout
Nearly all companies (98%) in our research awarded bonuses to their Named Executive Officers for 2013 performance. Overall, the median CEO bonus was 121% of target compared to 112% in 2012, indicating that 2013 performance was generally stronger than 2012. Most industries exceeded target bonus payouts by 11 – 65 percentage points. However, two industries (Retail and Technology) fell short of expectations by 22 and 12 percentage points, respectively.
Use of deferral mechanisms in the annual incentive plan is a limited practice and is more common in the Financial Services industry given regulations from the Federal Reserve. However, a few companies across industries also have a deferral policy in place. Companies typically defer annual incentive payment in the form of restricted stock/units.
|
Industry |
Actual Bonus as a % of Target Bonus – CEO |
||||||||
|
75th Percentile |
Median |
25th Percentile |
|||||||
|
2013 |
2012 |
2011 |
2013 |
2012 |
2011 |
2013 |
2012 |
2011 |
|
|
Automotive |
183% |
131% |
186% |
165% |
102% |
153% |
127% |
69% |
130% |
|
Consumer Goods |
133% |
137% |
149% |
112% |
103% |
132% |
70% |
94% |
78% |
|
Financial Services |
142% |
120% |
130% |
126% |
80% |
114% |
101% |
44% |
111% |
|
Health Care |
149% |
157% |
159% |
127% |
127% |
127% |
116% |
103% |
116% |
|
Insurance |
170% |
144% |
130% |
150% |
130% |
106% |
123% |
112% |
85% |
|
Manufacturing |
119% |
146% |
162% |
111% |
107% |
136% |
98% |
100% |
119% |
|
Pharmaceutical |
158% |
156% |
161% |
138% |
142% |
144% |
122% |
125% |
130% |
|
Retail |
119% |
136% |
147% |
78% |
117% |
129% |
68% |
79% |
112% |
|
Technology |
121% |
124% |
149% |
88% |
99% |
100% |
69% |
90% |
75% |
|
Total Sample |
151% |
144% |
156% |
121% |
112% |
133% |
96% |
93% |
105% |
Note: Most companies in the Financial Services industry does not disclose target bonus. Figures for the Financial Services industry reflects bonus as a percentage of 3-year average actual bonus.
Use of Discretion
Approximately 50% of companies in our research disclose the use of discretion in the annual incentive plan. Among these companies, approximately 40% allow only for downward adjustments of the final payout. Approximately 55% allow for both upward and downward adjustments by funding bonuses for Name Executive Officers at maximum based on a financial metric (this is unrelated to the final award allocation which may have additional performance requirements) to ensure compliance with Section162(m) of the Internal Revenue Code. This approach provides the Committee with the most flexibility in determining the bonus payout.
Conclusion
Given significant changes to the annual incentive plan design in recent years, companies rarely made wholesale changes to the overall plan design in 2013 or for 2014. Among the companies that made changes, most were focusing on refining the incentive metrics to ensure a more complete view of company performance and alignment with the overall business strategy. Despite these changes to the incentive metrics, EPS, Revenue, Cash Flow and Operating Income continue to be most common. While we would not expect to see extensive changes to the incentive plan design in the future, we anticipate that companies will continue to refine their metrics and the metric weightings as they continue to ensure executive pay is aligned with performance.
Highlights
- Companies continue to refine their existing stock ownership guidelines and stock retention requirements to demonstrate good governance and support shareholder alignment
- 98% of companies have one or both of these types of guidelines
- Median CEO stock ownership guideline has increased to 6x base salary from 5x since 2010
- Stock retention requirements have increased in prevalence since 2010, with 49% of companies using stand-alone stock retention requirements and/or stock retention requirements associated with a stock ownership guideline
Survey Sample
Compensation Advisory Partners (“CAP”) reviewed 2014 proxy disclosures at a sample of 100 companies among the Fortune 500, representing nine industry groups. Industry groups included: Automotive, Consumer Goods, Financial Services, Health Care, Insurance, Manufacturing, Pharmaceutical, Retail, and Technology. For the companies studied, the median revenue size and market capitalization was $32B and $52B, respectively. The median 2013 total shareholder return (TSR // change in stock price plus dividends) was 43%.
PREVALENCE OF STOCK OWNERSHIP GUIDELINES AND STOCK RETENTION REQUIREMENTS
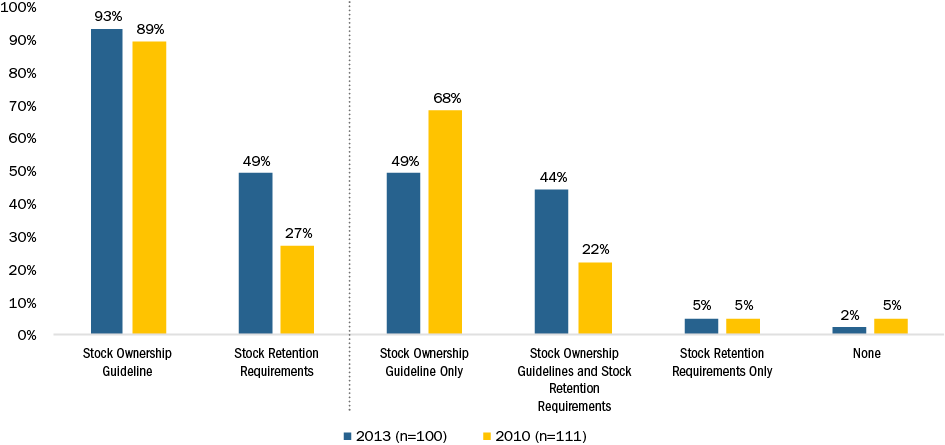
The prevalence of stock ownership guidelines among companies reviewed is approximately 93%, showing a slight uptick since 2010, when approximately 89% of companies had stock ownership guidelines in place. Between 2010 and 2013, companies with both stock ownership guidelines and stock retention requirements increased to 44% from 22%, while the prevalence of having only stock retention requirements remained flat at 5%. The number of companies with no form of stock ownership guidelines or stock retention requirements decreased to 2% from 5%. Companies are demonstrating increased efforts toward good corporate governance by ensuring executives hold a meaningful amount of equity.
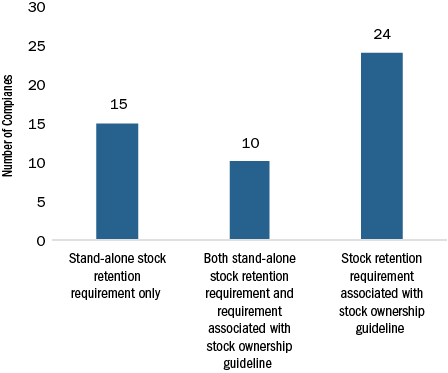
The most common stock retention requirement is to require executives to hold shares until a stock ownership guideline is achieved (34 companies). Implementation of stand-alone stock retention requirements that apply even after a stock ownership guideline has been achieved (25 companies) is a growing trend that we have seen over the last 3 years.
Prevalence of Different Forms of Stock Retention Requirements (n=49)
EXAMPLES OF STOCK RETENTION REQUIREMENTS
Stand-alone stock retention requirement only: AT&T
“Executive officers are required to hold 25% of the AT&T shares they receive (after taxes and exercise costs) from an incentive, equity, or option award granted to them after January 1, 2012, until one year after they leave the Company.”
Both stand-alone stock retention requirement and requirement associated with stock ownership guideline: Lincoln Financial Inc.
“If at any point the ownership guideline is not met with shares otherwise owned by the executive, the executive would be required to retain 50% of the net profit shares resulting from previously granted equity-based long-term incentive plan awards that are exercised or vest as applicable. Additionally, once an executive has met the minimum share ownership levels, they are also required to retain an amount equal to 25% of the net profit shares resulting from equity-based long-term incentive plan grants for five years from the date of exercise for stock options or the date of vesting for other awards.”
Stock retention requirement associated with stock ownership guideline: Gap, Inc.
“Executives not meeting the requirement must retain 50% of after-tax shares acquired through stock compensation programs until the requirement is reached.”
STOCK OWNERSHIP GUIDELINES
83% of companies express stock ownership guidelines as a multiple of salary and 13% express guidelines as a fixed number of shares. Fixed share guidelines tend to be more prevalent in the Financial Services (50%), Technology (33%), and Retail (33%) industries. Companies that use a fixed share approach generally have a volatile stock price, so locking in on a number of shares helps mitigate the potential challenges of meeting the stock ownership requirement.
|
CEO Stock Ownership Requirement Prevalence |
2013 (n = 93) |
2010 (n = 99) |
||
|
# of Cos |
% of Cos |
# of Cos |
% of Cos |
|
|
Multiple of Salary |
77 |
83% |
80 |
81% |
|
Fixed Shares |
12 |
13% |
15 |
15% |
|
Lesser Of Approach |
1 |
1% |
2 |
2% |
|
Other* |
3 |
3% |
2 |
2% |
*Other includes: Fixed Value, Multiple of Target Cash and Multiple of Notional Base
Stock ownership guidelines for CEOs have increased since 2010, with the median requirement increasing from 5x to 6x multiple of salary in 2013. The median fixed share guideline also increased to 250,000 shares compared with 150,000 shares in 2010. This suggests that companies may be increasing their fixed share guidelines to align with companies that have adopted higher multiples of salary. In 2013, the median stock ownership requirement value for the CEO is $7.7M compared with $6.7M in 2010, a significant increase of approximately 15%.
|
CEO Stock Ownership Requirement |
2013 (n = 100) |
2010 (n=99) |
||||
|
25th %ile |
50th %ile |
75th %ile |
25th %ile |
50th %ile |
75th %ile |
|
|
Multiple of Salary |
5x |
6x |
7x |
5x |
5x |
6x |
|
Fixed Shares |
125,000 |
250,000 |
500,000 |
100,000 |
150,000 |
300,000 |
|
Total Value |
$6.3M |
$7.7M |
$9.7M |
$5.4M |
$6.7M |
$8.6M |
Most companies require executives to achieve an ownership guideline requirement within 5 years. Thirteen companies (14%) disclosed a penalty for not achieving the required ownership level. The most common penalties for non-compliance include restrictions on selling shares (75% of companies), followed by reductions in future total compensation (25% of companies).
When determining which shares count towards ownership requirements, companies must consider whether to include unvested full-value shares, unexercised options or unearned performance shares. Of the companies reviewed, 69 out of 93 disclose the type of shares that count toward the guideline. Approximately 40% of companies count unvested restricted stock toward the requirement, (up from 33% in 2010) and less than 10% count unvested options or vested but unexercised options.
|
Shares Counting Toward Guideline Requirement |
2013 (n = 93) |
2010 (n = 99) |
||
|
# of Cos |
% of Cos |
# of Cos |
% of Cos |
|
|
Shares directly owned |
65 |
70% |
55 |
56% |
|
Shares in 401(k) plan |
37 |
40% |
33 |
33% |
|
Unvested restricted stock |
36 |
39% |
33 |
33% |
|
Shares indirectly owned |
32 |
34% |
29 |
29% |
|
Deferred compensation |
26 |
28% |
25 |
25% |
|
Vested but unexercised options |
7 |
8% |
6 |
6% |
|
Unvested options |
1 |
1% |
1 |
1% |
|
Not disclosed |
24 |
26% |
29 |
29% |
Note: Percentages add up to greater than 100% due to multiple types of equity counted by various companies.
Companies generally do not count unearned performance shares toward stock ownership guidelines. It is more common to included unvested restricted stock, as the eventual vesting of these shares is much more certain, since achievement of performance hurdles is not guaranteed.
STAND-ALONE STOCK RETENTION REQUIREMENTS
Companies with stock retention requirements most often require executives to hold net shares from option exercises, restricted stock share/unit vesting or performance share payouts. Requiring executives to hold net shares for one year post exercise or vest (64%) has remained the most prevalent holding period, increasing from 46% prevalence in 2010. Other companies require executives to hold shares for a 1 year period post-retirement (20%), while fewer companies require shares to be held until retirement (8%).
|
Period Subject |
2013 (n = 25) |
2010 (n = 24) |
||
|
# of Cos |
% of Cos |
# of Cos |
% of Cos |
|
|
1 year post exercise/vest |
16 |
64% |
11 |
46% |
|
2 years post exercise/vest |
0 |
0% |
1 |
4% |
|
Retirement |
2 |
8% |
8 |
33% |
|
Post-retirement |
5 |
20% |
1 |
4% |
|
Other |
2 |
8% |
4 |
17% |
|
Not disclosed |
0 |
0% |
1 |
4% |
Note: Holding requirement only for companies with stand-alone holding requirement. Percentages may add up to greater than 100% due to different holding periods for the CEO vs. other NEOs.
STOCK RETENTION SHAREHOLDER PROPOSALS
While companies may maintain stock ownership guidelines and/or stock retention requirements, they are not shielded from receiving shareholder proposals that require executives to hold a meaningful percentage of equity until requirement. Among the Russell 3000, 30 companies in 2014 and 46 companies in 2013 received shareholder stock retention proposals. In all cases, the proposals failed or were withdrawn. The median level of shareholder support for these proposals was less than 25%.
Disclosed Changes to Stock Ownership Guidelines and Stock Retention Requirements
22% of companies disclosed making a recent change to their stock ownership guidelines. Of those companies that modified their guidelines, the two most common changes were adopting a stock holding requirement (32%) and increasing the ownership guideline (27%).
|
Changes To Stock Ownership Guidelines and Stock Retention Requirements |
2013 (n = 22) |
2010 (n = 25) |
||
|
# of Cos |
% of Cos |
# of Cos |
% of Cos |
|
|
Added holding requirement |
7 |
32% |
6 |
24% |
|
Increased guideline requirement |
6 |
27% |
12 |
48% |
|
Newly adopted stock ownership guideline |
5 |
22% |
1 |
4% |
|
Changed fixed value / multiple approach |
2 |
9% |
n/a |
n/a |
|
Adopted mandatory holding of shares through retirement |
1 |
5% |
1 |
4% |
|
Extended participation |
1 |
5% |
n/a |
n/a |
|
Modified penalty for non-compliance |
n/a |
n/a |
5 |
20% |
SUMMARY
In 2014, companies continued to practice good governance by enhancing their stock ownership guidelines. Additionally, companies continue to implement stock retention requirements, albeit at a slower rate. Stock retention requirements most often serve as a supplement to existing stock ownership guidelines. Overall, we expect companies to continue to strengthen their stock ownership and stock retention requirements because these policies address issues important to both shareholders and proxy advisory groups, and align executives with shareholders.
Highlights
- Nearly all companies (94%) have adopted a clawback policy, even without SEC guidance on Dodd Frank requirements for clawbacks
- Consistent with our past findings, the most common forms of compensation that are potentially subject to recoupment are prior year’s cash and stock incentives
- Hedging policies are in place at most companies, with 95% disclosing a hedging policy (vs. 91% in 2013)
- Pledging policies can vary in scope as companies, but 63% of companies have a policy of some type in place
- Some companies ban all pledging (68%), while others require advance approval for pledged shares (20%) or only prohibit pledging of shares subject to stock ownership guidelines (12%)
Survey Sample
Compensation Advisory Partners (“CAP”) reviewed 2014 proxy disclosures at a sample of 100 companies among the Fortune 500 representing nine industry groups. Industry groups included: Automotive, Consumer Goods, Financial Services, Health Care, Insurance, Manufacturing, Pharmaceutical, Retail, and Technology. For the companies studied, the median revenue size and market capitalization was $32B and $52B, respectively. The median 2013 total shareholder return (TSR // change in stock price plus dividends) was 43%.
Clawbacks
Although companies are still waiting for SEC guidance on Dodd Frank, many have already implemented clawback policies on their own. Dodd Frank requires a broader definition of clawback compared to Section 304 of SOX, which applies to CEOs and CFOs.
Similar to our findings last year, 94% of companies we studied have some form of clawback policy, compared to 86% and 80% in 2011 and 2010, respectively. Because the majority of companies have now adopted robust clawback policies, the number of changes made in 2013 as compared to prior years has decreased. In 2013, there were no companies that adopted a new clawback policy, while only 7 modified existing provisions. The most common changes made were to expand the compensation subject to clawbacks and expand the triggers for clawbacks beyond financial restatements.
As in prior years, a financial restatement (87%) and misconduct (77%) are the most common triggers for a clawback. For the first time in our study, fraud (50%) will trigger a clawback for a majority of the companies analyzed.
Under nearly all policies, it is most common for companies to include the ability to recoup compensation previously granted. Some companies will also have clawback provisions in place that allow them to either adjust the amounts of future incentive compensation given or cancel any outstanding performance-based stock or cash awards.
|
Compensation Subject to Clawback |
2013 |
% of Cos. |
2012 |
% of Cos. |
2011 |
% of Cos. |
2010 |
% of Cos. |
|
Prior LTI |
91 |
98% |
88 |
95% |
95 |
97% |
79 |
89% |
|
Prior Annual Incentive |
89 |
96% |
86 |
92% |
92 |
94% |
81 |
91% |
|
Future Annual Incentive |
20 |
22% |
19 |
20% |
16 |
16% |
20 |
22% |
|
Future LTI |
21 |
23% |
18 |
19% |
15 |
15% |
14 |
16% |
Note: Percentages add up to greater than 100% due to multiple responses
Coverage extends to all NEOs in 97% of companies, which is higher than our findings in 2010, 2011, and 2012. Interestingly, many companies extend coverage beyond the NEO level, with 50% of companies having clawback policies in place for all Section 16 officers. Companies are not required to disclose the level of program detail in the proxy, but we expect most program provisions are more broad-based.
Similar to our findings in prior years, less than a quarter of companies indicate the length of the look-back period during which compensation can be recovered. Of the 21 companies that disclosed a time frame, the most common is 1 year (52% of companies) from date of restatement, followed by 3 years (38% of companies).
As we wait for the SEC to propose final rules, there are several practical challenges to clawing back compensation, such as how to clawback equity gains, how to claw back from former employees and the tax implications of clawbacks.
Hedging and Pledging
With increasing scrutiny from shareholder services such as ISS, hedging and pledging policies have become more significant governance / shareholder issues. ISS has taken the stance that any hedging and significant pledging by insiders to be indicative of a potential failure of risk oversight on behalf of a company’s Board. The Board’s policy regarding these practices is most commonly reflected in the company’s insider trading policy, but it can be addressed through Board resolutions or a stand-alone policy.
Hedging is viewed as a poor practice as it insulates executives from stock price movement and reduces alignment with shareholders. Pledging, in modest amounts, may not be viewed as negatively, yet can become problematic if there were a significant decline in stock price which necessitated a sale of shares from a senior executive. Given the potential negative perception of insider hedging and pledging, as well as the pending Dodd Frank guidance, companies have begun to adopt policies to limit these provisions. Anti-hedging and pledging policies are in place at 95% and 63% of companies studied, respectively; 63% of companies have both policies in place and 32% only have a hedging policy.
|
Hedging / Pledging Policies |
2013 |
% of Cos. n=100 |
2012 |
% of Cos. |
|
Hedging Policy |
95 |
95% |
91 |
91% |
|
Pledging Policy |
63 |
63% |
59 |
59% |
|
Both |
63 |
63% |
59 |
59% |
|
Hedging Only |
32 |
32% |
42 |
42% |
Note: Percentages add up to greater than 100% due to multiple responses
An example of typical disclosure of a prohibition on hedging/pledging is reflected in 3M’s proxy disclosure:
“The Company’s stock trading policies prohibit directors and the Company’s executive officers from (i) purchasing any financial instrument that is designed to hedge or offset any decrease in the market value of the Company’s common stock, including prepaid variable forward contracts, equity swaps, collars and exchange funds; (ii) engaging in short sales related to the Company’s common stock; (iii) placing standing orders; (iv) maintaining margin accounts; and (v) pledging 3M securities as collateral for a loan.”
Our analysis of pledging policies was broken down further to show that there are variations to prohibit pledging. A company can ban all pledging (68% of companies with anti-pledging policies), prohibit pledging of shares unless an employee receives advance approval (20%) or prohibit any shares subject to stock ownership guidelines to be pledged (12%).
An example of the latter two anti-pledging policies can be found in Best Buy and ACE’s proxy statements, respectively:
Best Buy: “…our executive officers and Board members are prohibited from holding Company securities in a margin account or pledging Company securities as collateral for a loan, unless approved in advance by the Compensation Committee.”
ACE: “The Company prohibits NEOs from pledging shares that are held in satisfaction of the share ownership guidelines.”
Pledging was not addressed in Dodd-Frank per se, and we do not know what the SEC’s position will be in the future. We do however expect more companies to adopt pledging policies going forward given ISS’ 2012 policy statement that identified pledging of company stock by executives as a poor practice.
Conclusions
We continue to see companies stay ahead of the curve and track “best practices” in order to satisfy shareholders and proxy advisory firms. This results in reevaluations of company pay and governance practices, and as our research shows, continued modification of clawback policies, and adoption of hedging and pledging policies. While formal guidelines have not been given to date, companies are adopting these policies as good governance, regardless of any final SEC guidance.