

DOWNLOAD A PDF OF THIS REPORT pdf(0.1MB)
Contact
Daniel LaddinFounding Partner [email protected] 212-921-9359 Matthew Vnuk
Partner [email protected] 212-921-9364
Each year CAP analyzes non-employee director compensation programs among the 100 largest companies, based on annual revenue. These firms are viewed as trend-setting organizations. Below is a summary of trends – for pay levels and pay practices – based on 2015 proxy filings.
Key CAP Findings
Board Compensation. little/no change
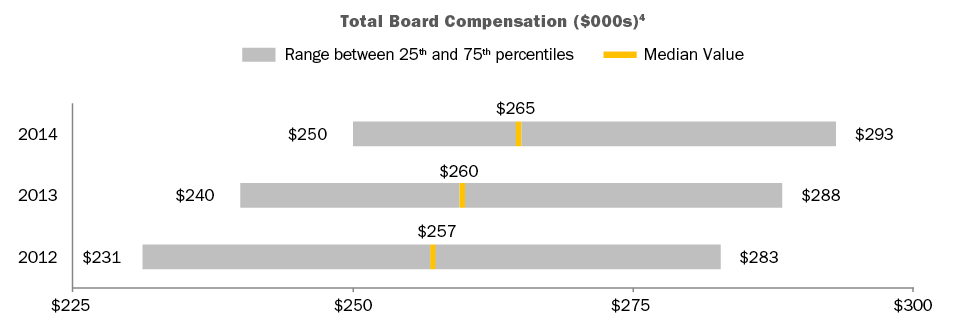
- Total Fees. Generally flat year-over-year (median is $265K, versus $260K in prior year).
- Retainers. Large companies rely on annual retainers (cash and equity) to compensate directors. Pay programs are typically simple and viewed more as an “advisory fee” than an “attendance fee.”
- Meeting fees. Provided by only 12 percent of companies (versus 15 percent in prior year). In general, companies have moved to a fixed retainer pay structure, with a component in cash and a component in equity.
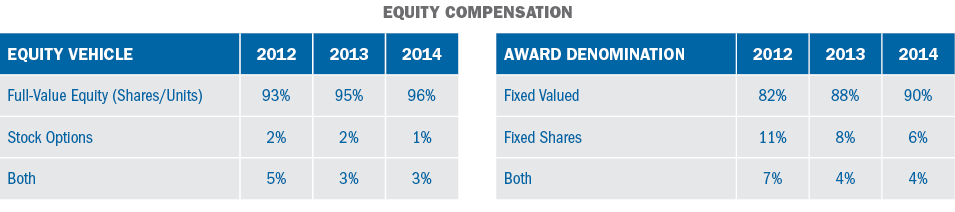
- Equity. Full-value awards (shares/units) are most common and only four percent of companies use stock options. 94 percent of companies denominate equity awards (stock or options) as a fixed value, versus a fixed number of shares which is considered best practice as it manages the value each year.
- Pay Mix. On average, 58 percent equity-based vs. 42 percent cash-based. Alignment with long-term shareholders is reinforced by delivering a majority of compensation in equity.
Committee Member Compensation. little/no change
- Overall Prevalence. 45 percent of companies paid committee-specific member fees1.
- Total Fees. Among companies paying committee member fees, the median is $15.5K.
Committee Chair Compensation. little/no change
- Overall Prevalence. Approximately 90 percent of companies provide additional compensation to committee Chairs, typically through an additional retainer, to recognize additional time requirements, responsibilities, and reputational risk.
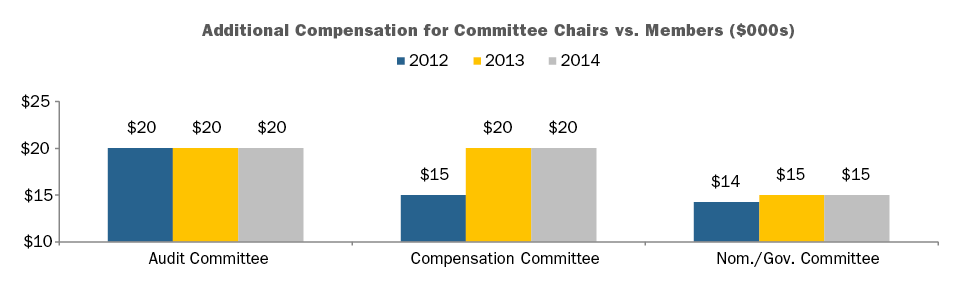
- Fees. At median, $20K in additional compensation (vs. members) was provided to Audit and Compensation Committee Chairs, and $15K additional to Nominating/Governance Committee Chairs.
Independent Board Leader Compensation. little/no change
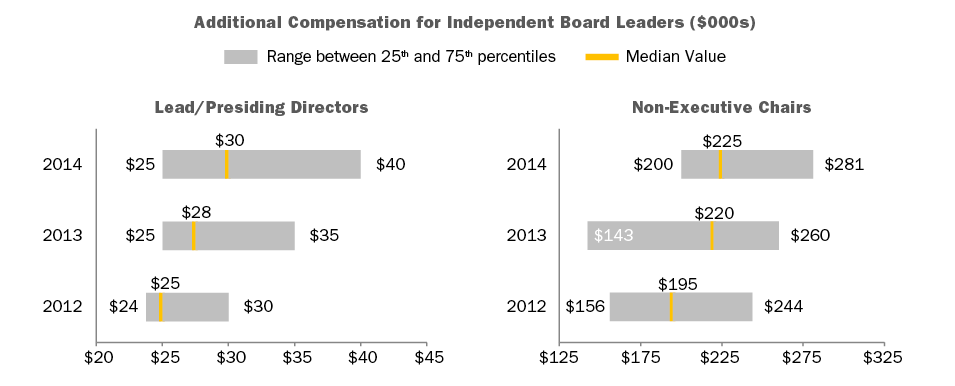
- Non-Exec Chair. Additional compensation is provided by all companies with this role, $225K at median. As a multiple of total Board Compensation, total Board Chair pay is 1.84x a standard Board member, at median.
- Lead Director. Additional compensation – $30K, at median – is provided by nearly all companies with this role2. The differential in pay versus non-executive Chairs is in line with typical differences in responsibilities. Median additional compensation was flat – $25K – for the five years prior to 2013 (median in 2013 was $28K).
Perquisites. little/no change
- Prevalence. Overall, limited use. One-third of companies provide gift matching/charitable contribution.
Pay Limits. little/no change
- 21 percent of companies that amended or adopted new equity plans in 2015 implemented specific limits for director compensation. In total, 27 percent of Fortune 100 companies now have such limits.
CAP Perspective
Board Pay Levels and Structure
We believe director compensation has leveled off – for the time being – and expect to see only modest increases in the next year.
In terms of pay program, fixed retainer structures are now the norm and meeting fees – already minority practice – continue to decline in prevalence as director compensation is now often viewed more as an “advisory fee” than an “attendance fee.”
Director Pay Limits
A number of companies have implemented limits on director compensation. The limits are largely due to advancement of litigation in Delaware court where the issue has been that directors approve their own annual compensation, and the shareholder approved long-term incentive plan did not provide “meaningful limits” on the maximum award that could be granted to a director.
Currently, 27 percent of companies studied (vs. 23 percent in prior year) have included limits for non-employee director compensation in their shareholder approved long-term incentive plan. These limits range from $250K to $3.5 million, $770K at median (vs. $800K in prior year), and typically apply to just equity-based compensation. Some companies have applied the limits to both cash and equity-based compensation, while others have excluded initial at-election equity awards, committee Chair pay, and/or additional pay for Board leadership roles from the limit.
We expect director pay limits to become majority practice within the next few years.
Lead Director Compensation
The Lead Director role has evolved, especially in companies where the CEO and Chairman roles are combined. For example, Boards are engaging in more outreach and meeting with shareholders to talk about governance practices, CEO succession and executive compensation, among other issues, and many investors want to hear from the Lead Director. Nearly all companies studied now provide additional compensation for the Lead Director role.3 However, additional compensation provided for the Lead Director role continues to be quite different than the non-executive Chair role. At median, an additional $30K was provided for the Lead Director role, versus $225K for the non-executive Chair role. The differential in pay is generally in line with typical differences in responsibilities.
Providing additional compensation to the Lead Director sends a signal to investors regarding expectations for the role, including time commitment, responsibilities, and authority. Many times, companies have been able to settle (or argue against) shareholder proposals to split the CEO and Chairman roles by instituting (or emphasizing) a strong Lead Director role and delineating the specific responsibilities of the position. Boards can also reassure investors concerned about overall governance practices at a company by increasing Lead Director responsibilities.
Best in Class Director Compensation Process & Practices
|
Best in Class PROCESS |
|
|
Best in Class PRACTICES |
|
Appendix
1 Audit, Compensation and/or Nominating and Governance committee members.
2 Excludes controlled companies. Also excludes instances where Lead Director role is assumed by Chair of Nominating and Governance Committee, who receives compensation for that role.
3 Excludes controlled companies. Also excludes instances where Lead Director role is assumed by Chair of Nominating and Governance Committee, who receives compensation for that role
4 Total Board Compensation reflects all cash and equity compensation for Board and committee service, excluding compensation for leadership roles such as committee Chair, Lead/Presiding Director, or non-executive Board Chair.