Partner Eric Hosken discusses the challenges companies are facing in attracting niche talent in the current tight labor market
CAP reviews and publishes an annual update on pay levels for Chief Financial Officers (CFOs) and Chief Executive Officers (CEOs). This year’s update is based on a sample of 119 companies with median revenue of $13 billion. Additional information on criteria used to develop the sample of companies is included in the Appendix.
Highlights 2017 vs 2016
| Component | Highlight |
| Base Salary |
|
| Bonuses |
|
| LTI |
|
| Performance Results |
|
| Total Compensation |
|
| Pay Mix |
|
Study Results
Salaries
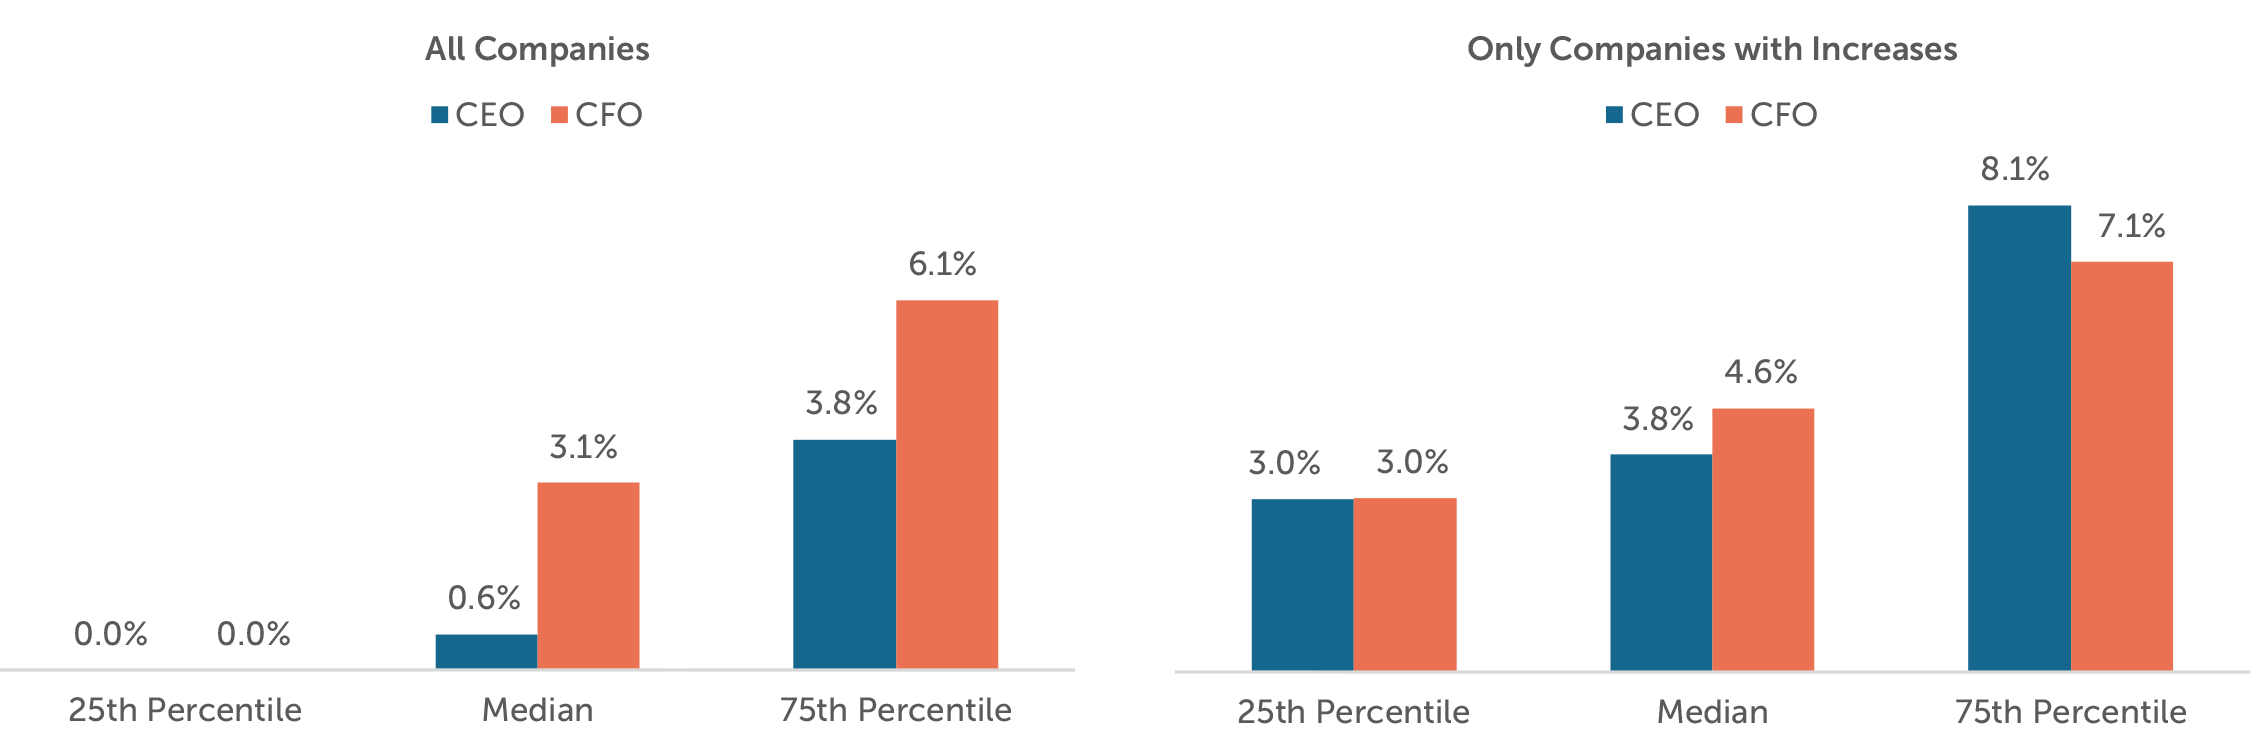
In the past, we have seen a steady growth in the number of CEOs and CFOs receiving salary increases in each year. However, for the 2016-2017 period the salary increase prevalence of 51% for CEOs and 70% for CFOs was very comparable to the increases for 2015-2016. The median 2017 salary increases were 3.1% for CFOs and 0.6% for CEOs.
2017 Salary Increases
Actual Pay Levels
Salary increases were higher for CFOs since only about one-half of CEOs received an increase. Yet, the median increases in actual bonus and long-term incentives were at similar levels for both CFOs and CEOs.
The median rate of increase in actual total direct compensation levels for CEOs and CFOs was 10.9% and 9.9% in 2017, respectively. We found that in 58% of the companies, the CEO received a higher percentage total compensation increase than the CFO.
| Median Percentage Change in Pay Components | ||||
|
Pay Components |
2015 – 2016 | 2016 – 2017 | ||
| CEO | CFO | CEO | CFO | |
| Salary | 0.0% | 3.0% | 0.6% | 3.1% |
| Actual Bonus | 1.5% | 1.1% | 12.0% | 12.7% |
| Long-Term Incentives | 3.8% | 4.1% | 8.1% | 10.3% |
| Actual Total Direct Compensation | 5.4% | 3.9% | 10.9% | 9.9% |
While target bonuses remained relatively the same, actual bonuses had significant increases indicating a strong performance year among the sampled companies. Year-over-year revenue and operating income growth was 7% for both measures which was much higher than 2016 performance of 1% and 4% growth, respectively.
Median Pay Increase by Industry1
Actual Total Direct Compensation2
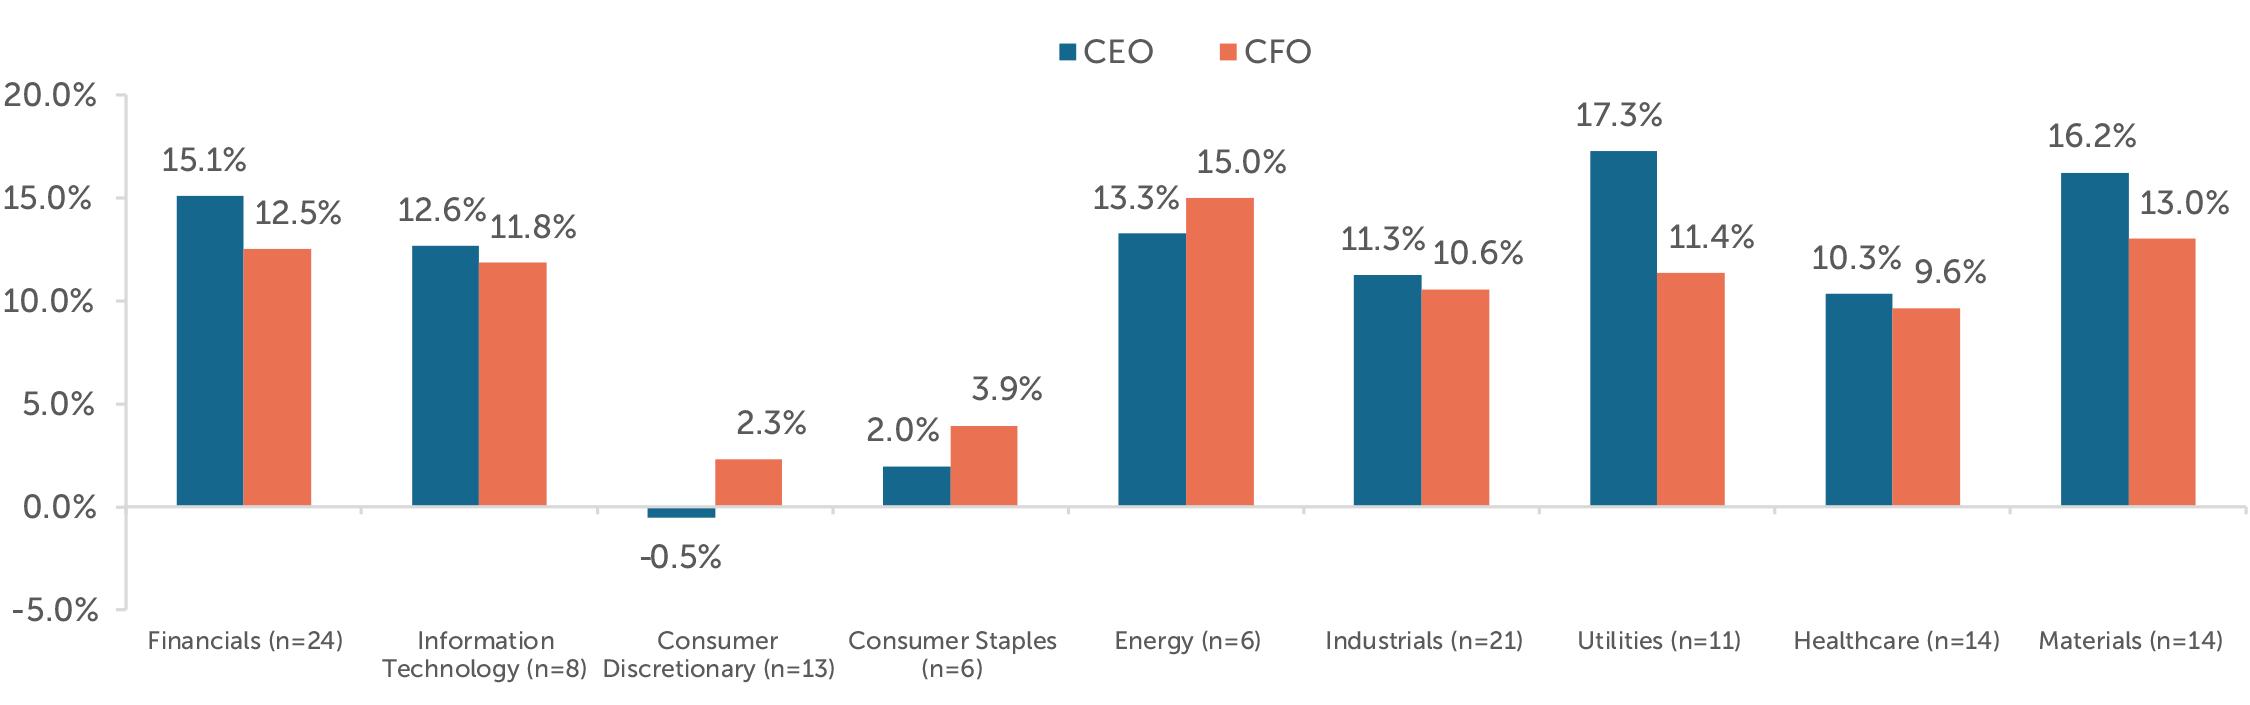
Median TDC increases by industry were generally aligned with the year-over-year revenue and operating income improvements.
Total compensation increases lagged the total sample for the Consumer Discretionary and Consumer Staples industries. While the companies in Consumer Staples improved total shareholder returns, revenue growth, and operating income growth in 2017, the overall industry performance still lagged the total sample. On the other hand, the companies in Consumer Discretionary generally saw a decrease in operating performance and an improved total shareholder return in 2017, but total compensation was generally flat.
The underperformance of the Consumer Staples companies is partially attributed to the pressure on sales volume as a result of taxes on soda, competition from store brands / smaller upstarts, battle for shelf space, and health conscious consumers.
For Consumer Discretionary companies, the trend is less clear as this industry is more diverse and covers a lot more sub-sectors (for example: media and entertainment, distributors, retail, hotels, automobiles, etc.). When we look at the companies in this industry individually, the compensation changes year-over-year were most often aligned with improved or deteriorated performance.
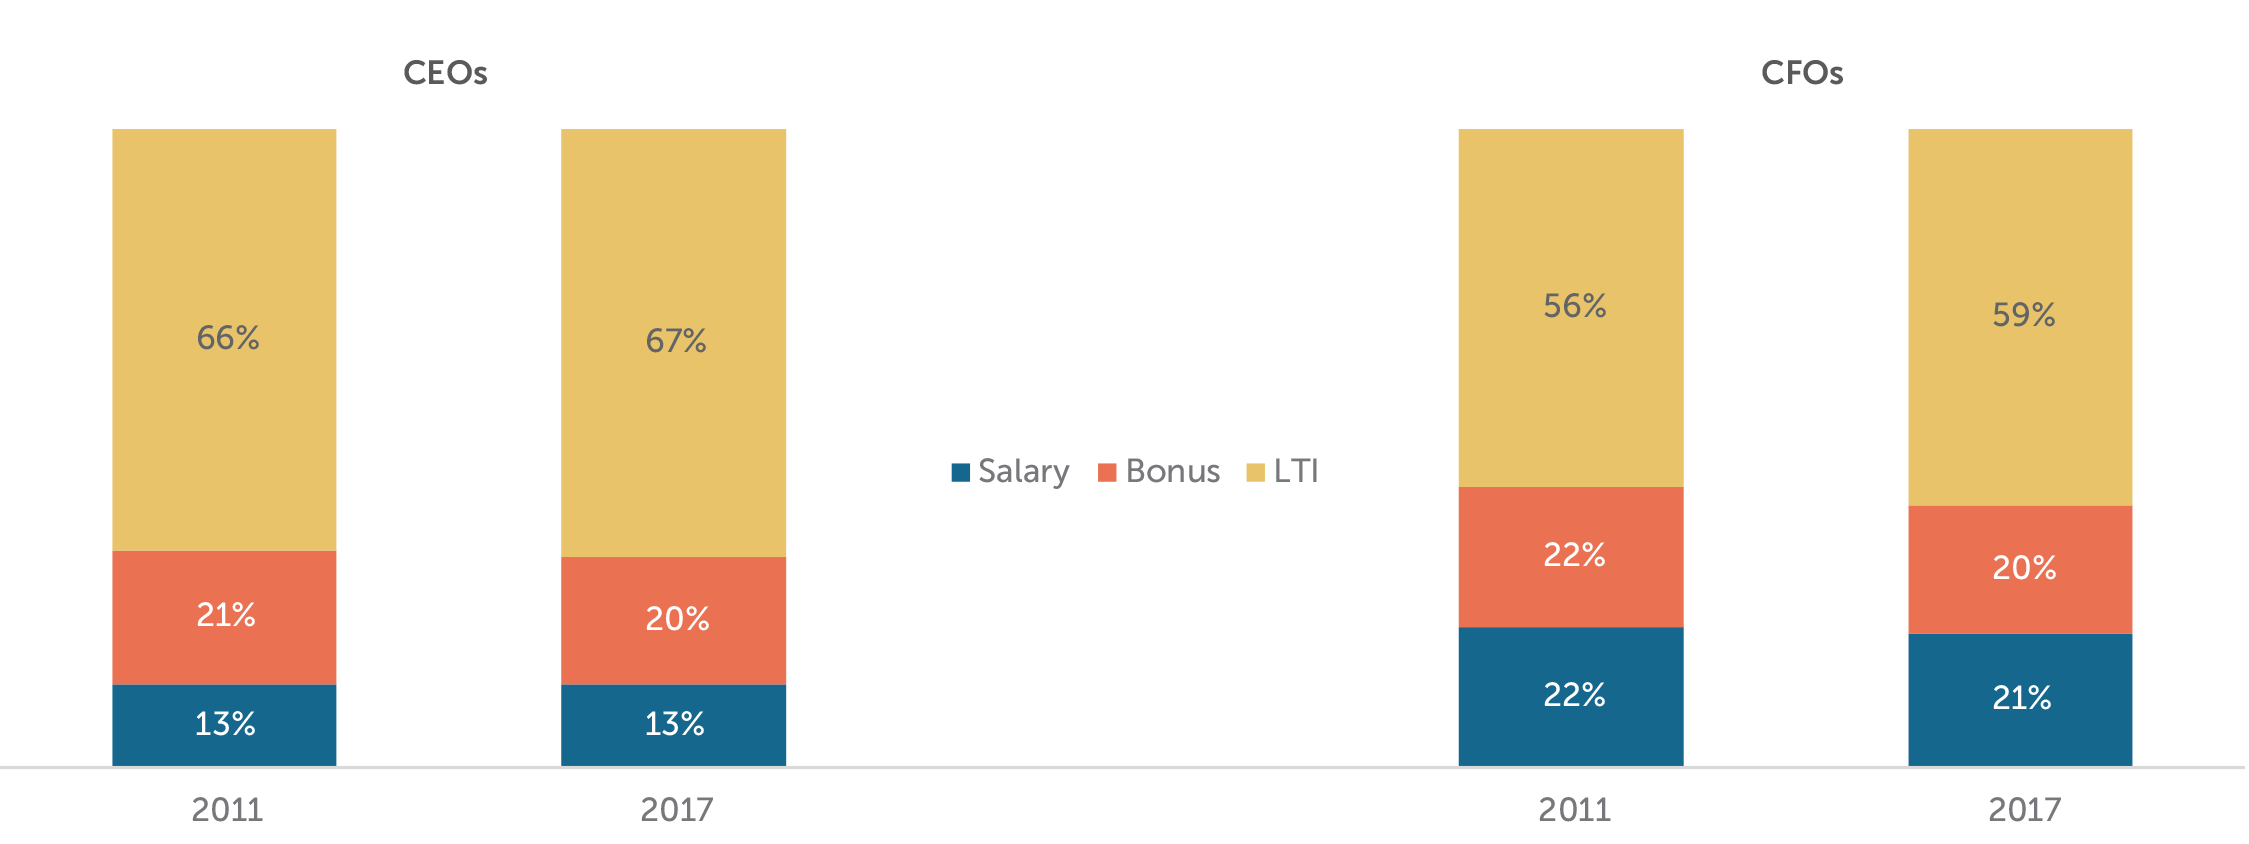
Target Pay Mix
The structure of the overall pay program (salary, bonus, LTI) has remained largely unchanged since 2011. CEOs continue to receive less in the form of salary and more in variable pay opportunities, especially LTI, than CFOs.
Target Bonuses
Target bonuses as a percentage of salary remained unchanged at median and only changed slightly at 25th and 75th percentiles. We do not foresee any major changes in target bonus percentages in the near future.
| Target Bonus as % of Salary | ||||
|
Summary Statistics |
CEO | CFO | ||
| 2016 | 2017 | 2016 | 2017 | |
| 25th Percentile | 138% | 135% | 85% | 85% |
| Median | 150% | 150% | 100% | 100% |
| 75th Percentile | 190% | 200% | 120% | 125% |
Long-Term Incentive (LTI) Vehicle Prevalence and Mix
Prevalence of performance plans continued to increase in 2017. The use of two different vehicles to deliver LTI remains the most prevalent approach and approximately 25% of companies studied use all 3 equity vehicles (stock options, time-based stock awards, and performance plan awards).
Performance plans account for around 60% of LTI awards on average among companies studied. The other portion of LTI is delivered through an almost equal mix of stock options and time-vested restricted stock awards.
| LTI Mix | ||||||
|
LTI Vehicles |
2011 | 2016 | 2017 | |||
| CEO | CFO | CEO | CFO | CEO | CFO | |
| Stock Options | 32% | 32% | 23% | 22% | 19% | 17% |
| Time Vested Restricted Stock | 17% | 22% | 20% | 24% | 18% | 24% |
| Performance Plans | 51% | 46% | 57% | 54% | 63% | 59% |
Conclusion
2017 performance overall, was higher compared to last year. Median revenue growth was 7% (vs 1% in 2016) and operating income growth was 7% (vs 4% in 2016). Total shareholder return in 2017 was comparable to 2016; the full year return was 20% (vs 16% in 2016). Total pay increases were much higher than in 2017, which we believe were directionally aligned with the performance improvements. A strong year of financial performance led to high annual incentive payouts in 2017 and after multiple years of sustained TSR growth companies are increasing LTI opportunities among their top executives.
The pay mix has been relatively consistent since 2011, but where we are seeing the most change is within LTI delivery vehicles. Since 2011 performance-based LTI plans have increased about 13% for both CEOs and CFOs with a similar drop in the prevalence of stock options, and time vested stock being relatively the same. With the focus on aligning pay outcomes with company performance by Boards and investors, we are not surprised to see large increases in total compensation after multiple years of sustained strong performance across industries.
APPENDIX
Sample Screening Methodology
Based on the screening criteria below, we arrived at a sample of 119 public companies with median 2017 revenue of $13B.
| Revenue | At least $5B in revenue for fiscal year 2017 |
| Fiscal year-end | Fiscal year-end between 9/1/2017 and 1/1/2018 |
| Proxy Statement Filing Date | Proxy statement filed before 3/31/2018 |
| Tenure | No change in CEO and CFO incumbents in the past three years |
| Industry | All industries have been considered for this analysis |
Companies use annual bonuses as a tool to reward executives for achieving short-term financial and strategic goals. Setting appropriate annual performance goals is essential to establishing a link between pay and performance. Goals should achieve a balance between rigor and attainability to motivate and reward executives for driving company performance and creating returns for shareholders.
Key Takeaways:
- Based on our analysis of actual incentive payouts over the past 6 years, the degree of difficulty, or “stretch”, embedded in annual performance goals translates to:
- A 95% chance of achieving at least Threshold performance
- A 75% chance of achieving at least Target performance
- A 15% chance of achieving Maximum performance
- This pattern indicates that target performance goals are challenging, but attainable, and maximum goals are achievable through highly superior performance
- The majority of companies use two or more metrics when assessing annual performance
- Annual incentive payouts have been directionally linked with earnings growth over the past 6 years
Summary of Findings
Plan Design
For the purposes of this study, we categorized annual incentive plans as either goal attainment or discretionary. Companies with goal attainment plans define and disclose threshold, target and maximum performance goals and corresponding payout opportunities. Alternatively, companies with discretionary plans do not define the relationship between a particular level of performance and the corresponding payout. Discretionary programs provide committees with the opportunity to determine payouts based on a retrospective review of performance results.
| Annual Incentive Plan Type | |||
| Industry | Sample Size | Goal Attainment | Discretionary |
| Auto | n= 8 | 100% | 0% |
| Consumer Discretionary | n= 10 | 90% | 10% |
| Consumer Staples | n= 12 | 67% | 33% |
| Financial Services | n= 12 | 17% | 83% |
| Healthcare | n= 9 | 89% | 11% |
| Industrials | n= 14 | 71% | 29% |
| Insurance | n= 12 | 67% | 33% |
| IT | n= 12 | 83% | 17% |
| Pharma | n= 10 | 80% | 20% |
| Total | 72% | 28% | |
Consistent with the findings from our study conducted in 2014, 72% of sample companies have goal attainment plans. Our study focuses on these companies.
Performance Metrics
Most companies (61%) use 3 or more metrics to determine bonus payouts. This reflects a shift from 2014, where 48% of companies used 3 or more metrics. Companies annually review metrics to ensure that they align with the business strategy.
Many companies use financial metrics such as revenue and profitability, which are indicators of market share growth and stock price performance. Some bonus plans also include strategic metrics, which incentivize executives to achieve goals that may contribute to long-term success, but may not be captured by short-term financial performance. Companies in the pharmaceutical industry often use strategic goals, such as pipeline development. Similarly, companies with large manufacturing operations often use quality control metrics.
| # of Metrics Used in Goal Attainment Plan | ||||
| Industry | 1 Metric | 2 Metrics | 3 Metrics | 4+ Metrics |
| Auto | 13% | 13% | 25% | 50% |
| Consumer Discretionary | 11% | 44% | 45% | 0% |
| Consumer Staples | 0% | 37% | 38% | 25% |
| Financial Services | 0% | 50% | 50% | 0% |
| Healthcare | 0% | 38% | 12% | 50% |
| Industrials | 20% | 40% | 20% | 20% |
| Insurance | 37% | 13% | 25% | 25% |
| IT | 10% | 30% | 40% | 20% |
| Pharma | 0% | 0% | 63% | 37% |
| Total | 11% | 28% | 34% | 27% |
Pay and Performance Scales
Compensation committees annually approve threshold, target, and maximum performance goals, and corresponding payout opportunities, for each metric in the incentive plan. Target performance goals are typically set in line with the company’s internal business plan. Executives most often earn 50% of their target bonus opportunity for achieving threshold performance and 200% for achieving maximum performance. Actual payouts are often interpolated between threshold and target and target and maximum.
Annual Incentive Plan Payouts Relative to Goals
All Companies
Based on CAP’s analysis, companies paid annual bonuses 95% of the time. Payouts for the total sample are distributed as indicated in the following charts:
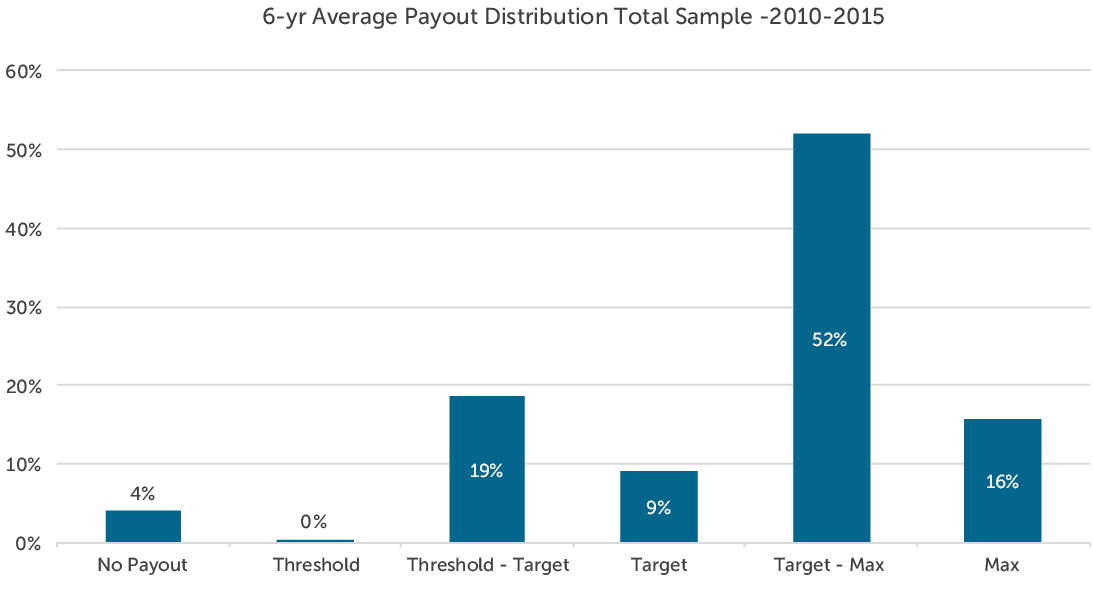
This payout distribution indicates that committees set annual performance goals with a degree of difficulty or “stretch” such that executives have:
- A 95% chance of achieving at least Threshold performance
- A 75% chance of achieving at least Target performance
- A 15% chance of achieving Maximum performance
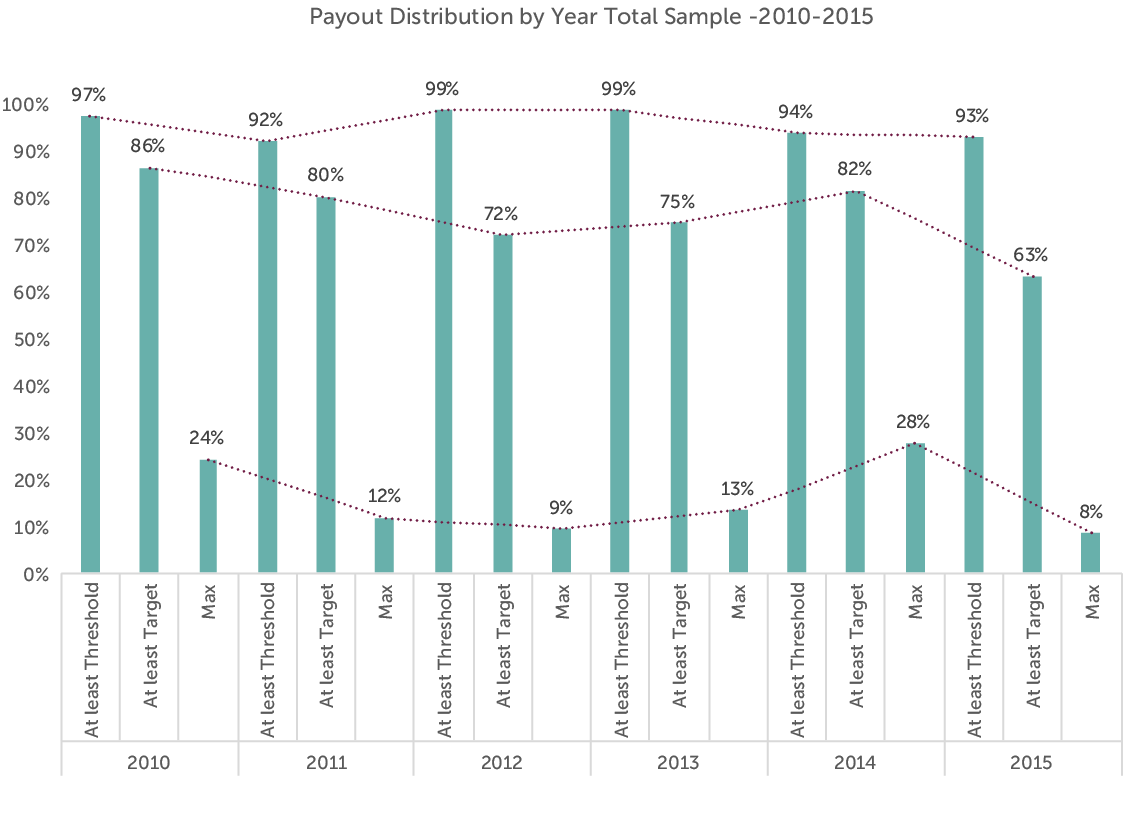
From 2010-2015, no more than 10% of companies failed to reach threshold performance in any given year. By comparison, in both 2008 and 2009, which were challenging years, approximately 15% of companies failed to reach threshold performance goals.
When looking back over 8 years (2008-2015), companies achieved at least threshold and target performance with slightly less frequency. Based on CAP’s analysis of this 8-year period, executives have:
- A 90% chance of achieving at least Threshold performance
- A 70% chance of achieving at least Target performance
- A 15% chance of achieving Maximum performance
By Industry
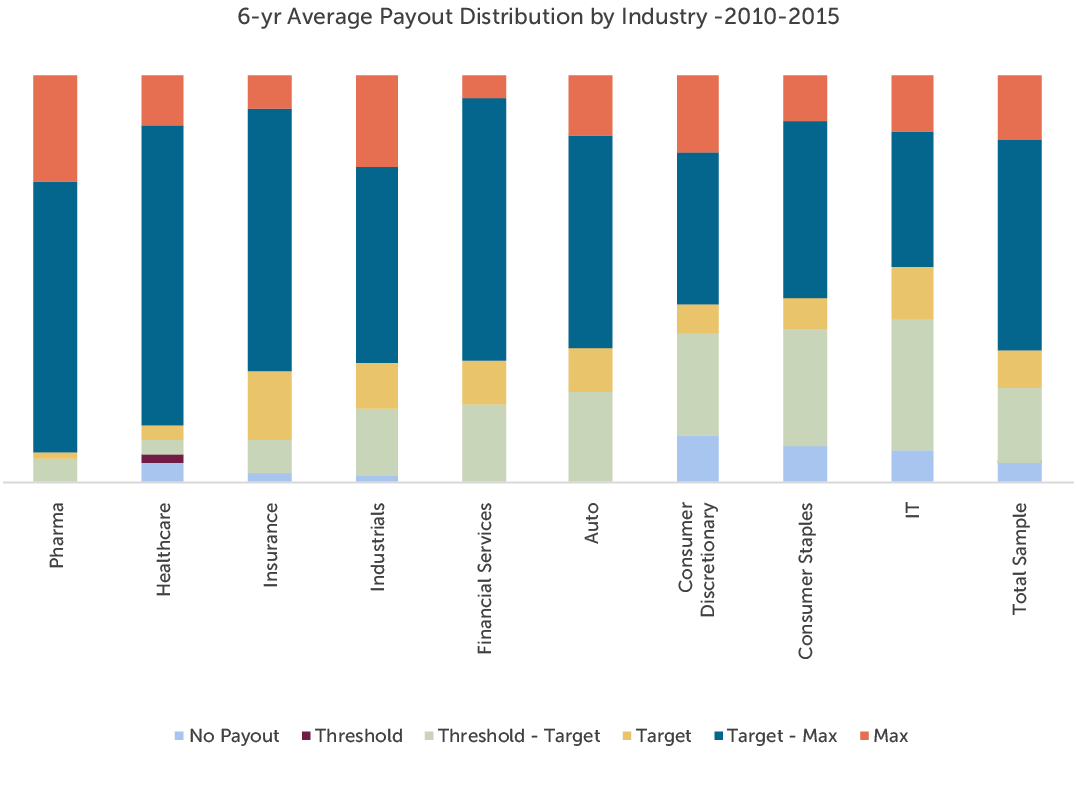
Pharmaceutical and healthcare companies have paid at or above target more frequently than companies in any other industry over the past 6 years. Both industries have experienced significant growth over the period in part due to consolidation. The companies in the IT, Consumer Discretionary and Consumer Staples industries tend to pay below target at a higher rate. Average payouts for each industry are distributed as indicated in the following chart:
Relative to Performance
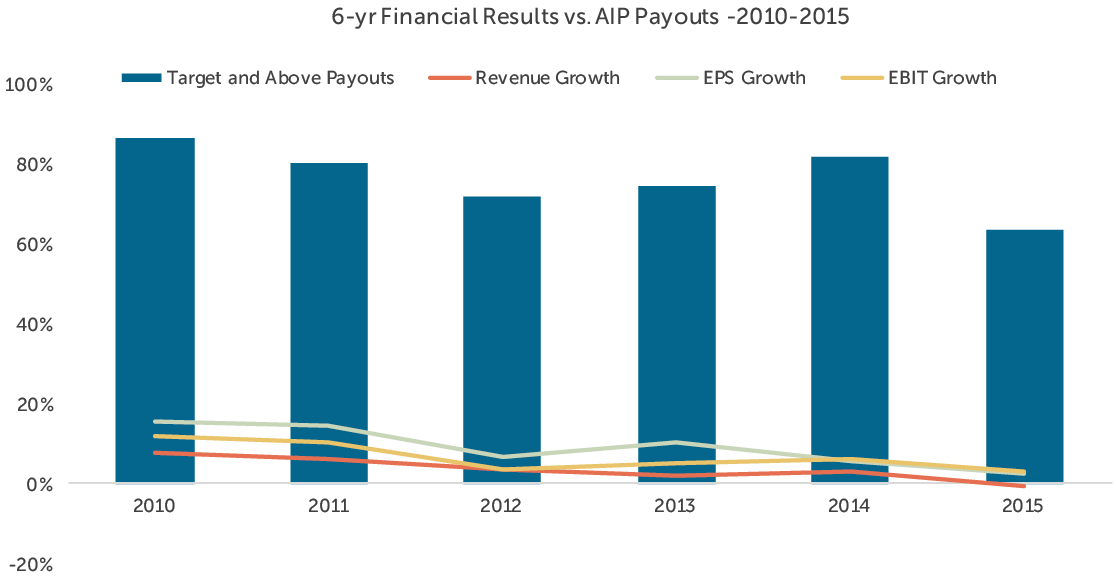
CAP reviewed the relationship between annual incentive payouts and company performance with respect to three metrics: revenue growth, earnings per share (EPS) growth and earnings before interest and taxes (EBIT) growth. While payouts were generally aligned with revenue and EPS growth, they most closely tracked with EBIT growth over the period studied (2010-2015). Companies may seek to align bonus payouts with operating measures, such as EBIT, as they capture an executive’s ability to control costs and improve operational efficiency.
The chart below depicts the relationship between median revenue, EPS, and EBIT growth and target and above annual incentive payouts among the companies studied.
Conclusion
In the first quarter of 2017, committees will certify the results and payouts for the fiscal 2016 bonus cycle and approve performance targets for fiscal 2017. Given the uncertain economic outlook following the 2016 presidential election, establishing performance targets for 2017 may be more challenging than usual. Companies may choose to use a range of performance from threshold to maximum to build flexibility into their plans given the unpredictable environment. Our study of annual bonus payouts over the past 6-8 years supports setting goals such that the degree of difficulty, or “stretch”, embedded in performance goals translates to:
- A 90-95% chance of achieving at least Threshold performance
- A 70-75% chance of achieving at least Target performance
- A 15% chance of achieving Maximum performance.
Companies should continue to set target performance goals that are challenging, but attainable and maximum goals that are achievable through outperformance of internal and external expectations – therefore, establishing a bonus plan that is attractive to executives and responsible to shareholders.
Methodology
CAP’s study consisted of 100 companies from 9 industries, selected to provide a broad representation of market practice across large U.S. public companies. The revenue size of the companies in our sample ranges from $18 billion at the 25th percentile to $70 billion at the 75th percentile.
CAP analyzed the annual incentive plan payouts of the companies in the sample over the past 6-8 years to determine the distribution of incentive payments and the frequency with which executives typically achieve target payouts. In this analysis, CAP categorized actual bonus payments (as a percent of target) into one of six categories based on the following payout ranges:
| Payout Category | Payout Range |
| No Payout | 0% |
| Threshold | Up to 5% above Threshold |
| Threshold – Target | 5% above Threshold to 5% below Target |
| Target | +/- 5% of Target |
| Target – Max | 5% above Target to 5% below Max |
| Max | 5% below Max to Max |