Compensation Advisory Partners (CAP) reviewed executive compensation pay levels and trends at 50 companies (Early Filers) that filed their most recent proxy statement between November 2016 and January 2017 (fiscal year ends from July 2016 to October 2016; 35 companies have September 30 fiscal year ends). Industry sectors reviewed include: Consumer Discretionary, Consumer Staples, Financials, Health Care, Industrials, Information Technology and Materials. Among these 50 companies, median Revenue was $6.1B, median Market Capitalization (based on each company’s fiscal year-end) was $9.0B and 1-year Total Shareholder Return, or TSR (based on each company’s fiscal year-end) was 18.4%.
Overall Findings
- Performance: 2016 performance (based on Revenue growth, Pre-tax Income growth, EPS growth and 1-year TSR) was generally flat year over year.
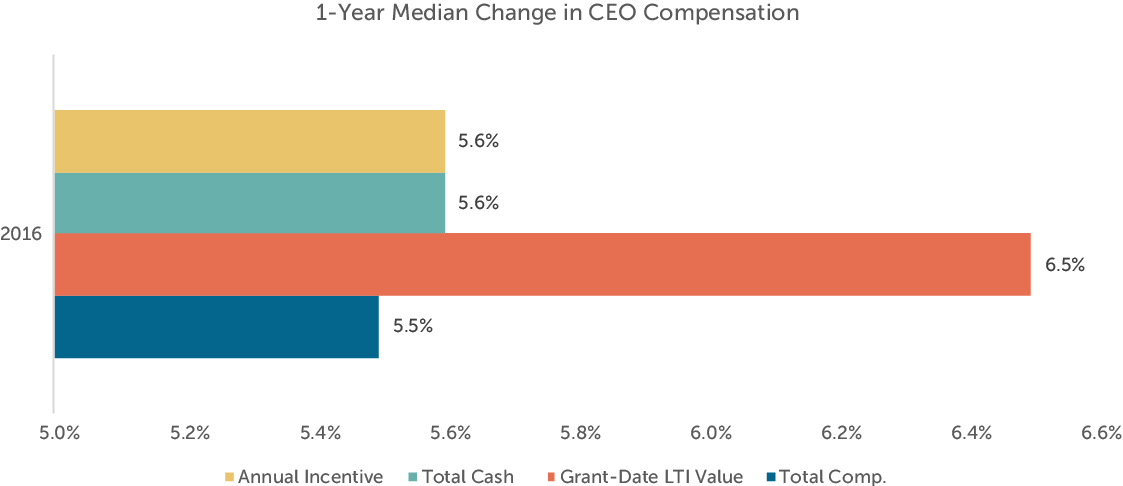
- CEO Pay: Median CEO pay was up 5.5% from 2015 due to increases in annual incentive payout and the grant date value of long-term incentives (LTI).
- Annual Incentive Payout: Overall, median 2016 annual incentive payout was 104% of target which was consistent with 2015 results.
- Annual Incentive Plan Design: Profit-based growth, Revenue growth and Cash Flow growth are the most common measures used in the annual incentive plan. Companies typically use 2 – 4 metrics to ensure executives are focused on overall company performance.
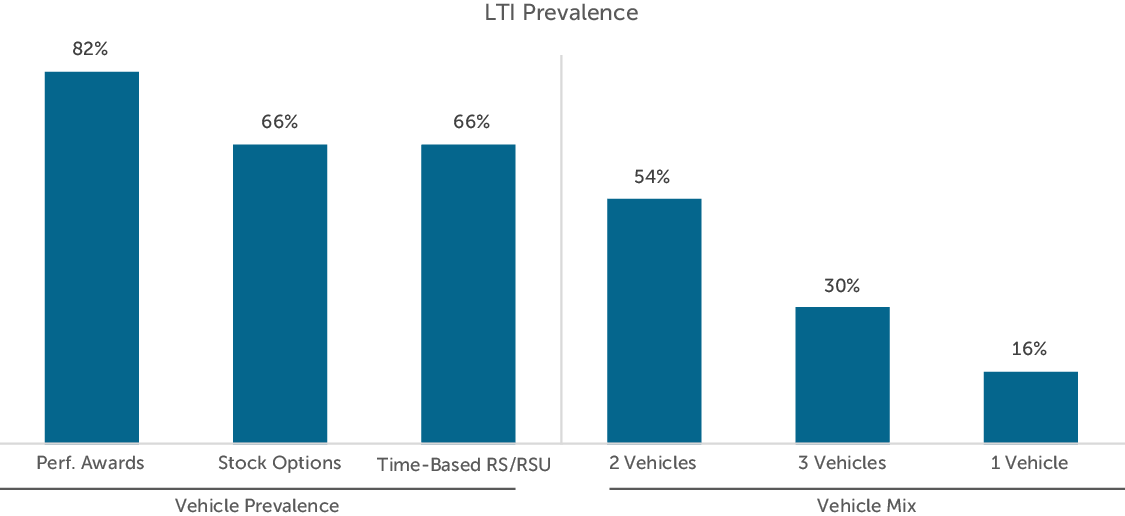
- Long-Term Incentive Design: Performance-based awards are the most prevalent LTI vehicle although stock options and time-based restricted stock are also commonly used but to a lesser extent. Most companies use relative TSR as an LTI metric although we expect its use to plateau as proxy advisory firms like ISS begin to use financial performance in their pay-for-performance assessment.
2016 Performance
2016 was a year marked with global political uncertainty partly due to the Brexit vote in June, the U.S. presidential election in November and the continued unrest in the Middle East. Despite these challenges, 2016 financial performance was generally flat (+/- 3%) for the second year in a row. However, 2016 TSR performance was much stronger than 2015 performance despite market uncertainty. CAP reviewed Revenue growth, Pre-tax Income growth, EPS growth and TSR performance for the Early Filers and the S&P 500.
| Financial Metric (1) | 2015 Median 1-year Performance | 2016 Median 1-year Performance | ||
| S&P 500 | Early Filers | S&P 500 | Early Filers | |
| Revenue Growth | 2.3% | 2.2% | 2.1% | 2.2% |
| Pre-Tax Income Growth | 1.8% | 1.5% | 2.2% | -2.8% |
| EPS Growth | 5.0% | 3.1% | 4.2% | 2.4% |
| TSR | 3.4% | 0.4% | 14.9% | 18.4% |
(1) TSR and Financial performance for the S&P 500 is as of September 30, 2015 and September 30, 2016. Financial performance and TSR for Early Filers is as of each company’s fiscal year end.
CEO Total Direct Compensation
CEO actual total direct compensation increased modestly (5.5%) among Early Filers with CEOs in their role for at least two years (n=42) driven by increases in annual incentive payouts and the grant-date value of LTI awards. Annual incentive payouts, at median, were nearly 6% higher over prior year. Although year over year financial performance was relatively flat, companies typically adjust incentive plan metrics to exclude factors that may be outside an executive’s control (e.g., currency fluctuation) which can result in higher incentive plan achievement compared to GAAP performance. Median base salaries for CEOs in our sample were unchanged from prior year.
Annual Incentive Plan Payout
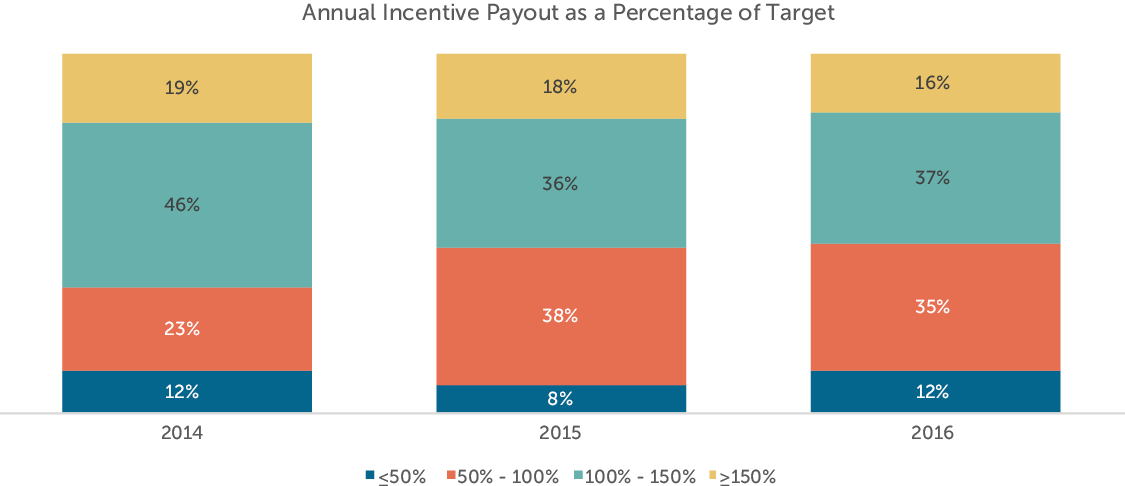
Actual annual incentive payouts in 2016 were around target, reflective of the relatively flat 2016 financial performance. Payout in 2016 was 104% of target at median which is similar to median payout in 2015 (102% of target). Median annual incentive payouts for 2016 and 2015 were lower than 2014 (110% of target); however, 2014 was a year of strong financial performance which resulted in above target annual incentive payouts.
| Summary Statistics | Annual Incentive Payout as a % of Target | ||
| 2014 | 2015 | 2016 | |
| 75th Percentile | 125% | 133% | 137% |
| Median | 110% | 102% | 104% |
| 25th Percentile | 92% | 82% | 82% |
As would be expected, performance for companies with at or above target annual incentive payouts was stronger than that of companies with below target payout. Most noticeably, however, is that median Profit growth for companies with at or above target annual incentive payouts was significantly stronger than similar growth for companies with below target payouts; median Revenue growth was only modestly stronger for companies with at or above target payout. Median 1-year TSR performance for both groups was very strong in 2016. These results are directionally similar to 2015 performance with the exception of TSR which, for both above and below target payouts, was stronger in 2016 than 2015.
| Financial Metric (1) | 2015 Median 1-year Performance | 2016 Median 1-year Performance (2) | ||
| Below target payout (n=23) | At/above target payout (n=27) | Below target payout (n=23) | At/above target payout (n=26) | |
| Revenue Growth | -3.6% | 7.5% | -0.7% | 3.5% |
| Pre-Tax Income Growth | -4.1% | 8.8% | -13.2% | 20.5% |
| EPS Growth | -2.6% | 12.2% | -8.7% | 16.3% |
| TSR | -13.4% | 14.8% | 16.9% | 20.0% |
(1) Financial performance and TSR is as of each company’s fiscal year end.
(2) Excludes 1 company that eliminated its annual incentive program beginning in 2016.
Approximately 55% of companies provided a payout at or above target in 2016 which is consistent with 2015. Additionally, the distribution of payouts in 2016 is similar to that of the prior year which is consistent with generally flat year over year performance.
Incentive Plan Design
Annual Incentive Plan Design
Across all companies reviewed, Profit growth (typically EPS or Operating Income), Revenue growth, and Cash Flow growth were the most commonly used metrics in the annual incentive plan design. Typically, companies place more emphasis on profits with most allocating at least 50% of the total award on profit-based metrics.
Most companies use 2 – 4 metrics in the annual incentive plan design which allows companies to balance an executive’s focus on the many aspects that define its success. This approach also provides some risk mitigation so that executives are not concentrating on a single metric potentially at the expense of other meaningful financial measures. A minority of companies (8) in our sample use only 1 metric in the annual incentive plan, with most of these companies using a profit-based metric.
Long-Term Incentive Plan Design
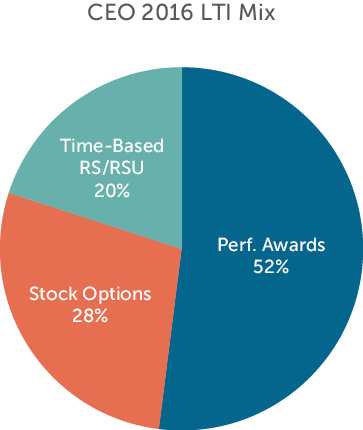
Among early filers, performance-based awards are the most prevalent long-term incentive vehicle provided to executives as companies continue to ensure executive pay is aligned with longer term company and stock price performance. However, companies in our sample do continue to provide stock options and time-based restricted stock awards, although these vehicles reflect a smaller portion of total LTI (28% for stock options and 20% for time-based restricted stock). Most companies reviewed deliver equity in the form of 2 – 3 vehicles which helps to balance the link with longer term performance.
For companies that grant performance-based awards, the most common metrics are TSR, profit-based growth and return measures (e.g., ROE, ROA and ROIC). 67% of companies use TSR, 57% use a profit-based metric (with EPS used most often) and 31% use a return measure. Similar to annual incentive metrics, companies use multiple metrics (typically 2 – 3 metrics) in performance-based awards. Among the 12 companies that use only 1 metric, 50% use company financial performance (typically a profit-based metric) while 50% rely solely on relative TSR. However, TSR is most commonly used with other metrics or as an award modifier. Over the last several years, more companies have been incorporating relative TSR as a long-term measure to address multiple issues including: setting credible long-term goals, using measures that can be understood by participants and aligning with proxy advisory firms’ pay-for-performance assessments. We would expect that the use of TSR will plateau particularly as firms, like ISS, begin to use financial performance measures in their pay-for-performance assessments.
Conclusion
2016 performance, overall, was generally flat year over year which resulted in annual incentive payouts that were around target for the second year in a row and modest pay increases, through incentives, for the CEO. 2017 will likely be a year of uncertainty as political outcomes from 2016 (e.g., Brexit and the U.S. presidential election) may impact international trade deals, U.S. federal regulations and consumer confidence which could impact economic performance. We would expect many companies to take a wait and see approach before making wholesale changes to their annual or long-term incentive plan design.
Lauren Peek is a Principal at Compensation Advisory Partners. Joanna Czyzewski is an Associate at Compensation Advisory Partners.
Certain compensation practices can have a potentially damaging effect on a company’s reputation, which makes determining what constitutes fair director pay no easy task. Daniel Laddin, founding partner of Compensation Advisory Partners, and Martin M. Coyne, II, Chairman and CEO of NACD’s New Jersey Chapter, offer their insights on today’s most critical compensation issues.
The CAP 100 Company Research consists of 100 companies from 9 industries, selected to provide a broad representation of market practice among large U.S. public companies. In this report, CAP reviewed Pay Strategies, Annual Incentives, Long-Term Incentives, Perquisites, and Shareholder Friendly Provisions of these companies in order to gauge general market practices and trends.
Click here to download the full report
The 2010 Dodd-Frank Wall Street Reform and Consumer Protection Act (“Dodd-Frank”) directed the SEC to enact rules that require disclosure in the annual proxy statement of the ratio of Chief Executive Officer (CEO) compensation to that of the median employee, including the absolute value for each input that goes into the ratio calculation. More than five years later, final pay ratio rules have been released by the SEC. These rules will go into effect requiring companies to provide disclosure of their pay ratios for their first fiscal year beginning on or after Jan. 1, 2017.
While many companies are preparing for the new pay ratio disclosure requirements from the SEC, ratios of CEO pay to other NEOs are also something companies should pay close attention to. Committees can use these ratios as a starting point to assess issues such as retention, talent development, and succession planning. A high ratio can be an indicator that the CEO is potentially carrying too much of the company, a disconnect exists between the pay practices for the CEO vs. other senior leaders, or that there is no succession plan in place. Having healthy internal equity with appropriate ratios of pay for leadership, and an eye on general market norms, is an important factor in talent acquisition and retention.
This CAPflash focuses on three NEO pay ratio calculations:
- CEO versus Chief Operating Officer (COO);
- CEO versus Chief Financial Officer (CFO); and
- CEO versus General Counsel (GC).
In this study, we provide market practice among S&P 500 companies, as well as the policies of proxy advisory firms, ISS and Glass-Lewis. In our analysis, we use the following target pay elements per proxy disclosure: disclosed base salary, target annual incentive, and target/grant date value of LTI awards.
Please note that the ratios used in this analysis are calculated from proxy disclosure. Therefore, if a COO or GC is not among the top 5 highest paid, as required in proxy disclosure, they are not included in the analysis—CFO pay disclosure is required.
What does our research show?
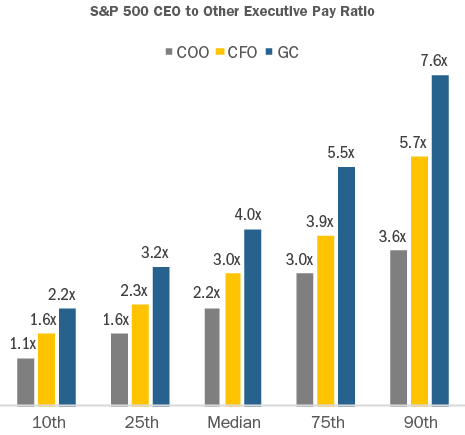
To evaluate market norms, Compensation Advisory Partners (“CAP”) conducted an analysis of senior executive target pay ratios among S&P 500 companies during the most recent three fiscal years (as of August 22, 2016).
- At median, CEO pay was 2.2x the COO; i.e., for every $1.00 paid to the COO, the CEO was paid approximately $2.20
- At median, CEO pay was 3.0x the CFO; i.e., for every $1.00 paid to the CFO, the CEO was paid approximately $3.00
- At median, CEO pay was 4.0x the GC; i.e., for every $1.00 paid to the GC, the CEO was paid approximately $4.00
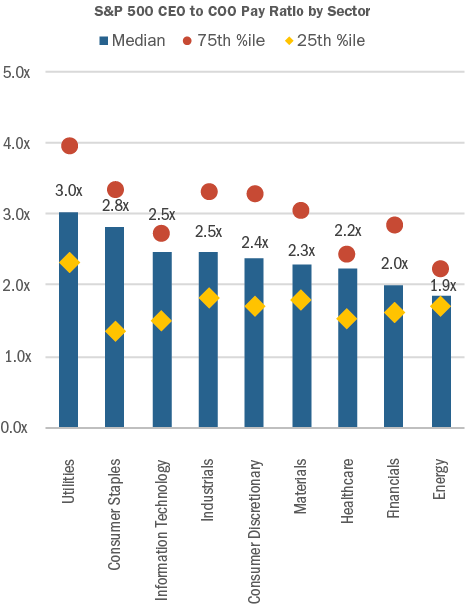
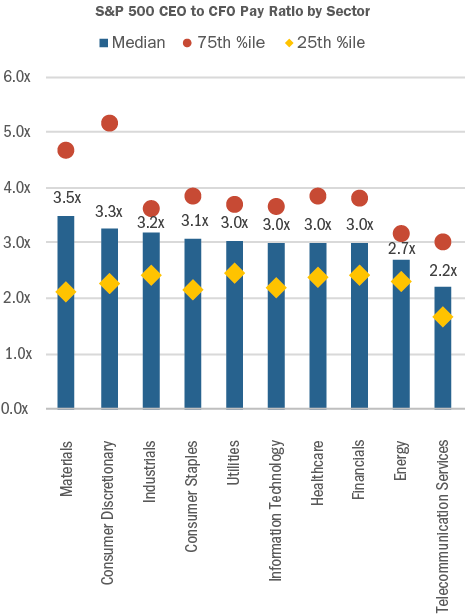
CAP also analyzed the S&P 500 senior executive pay ratios by industry.
- For the CEO vs. COO ratio, the Utilities sector had the highest ratio of 3.0x at median, while Energy had the lowest ratio of 1.9x at median
- For the CEO vs. CFO ratio, the Materials sector had the highest ratio of 3.5x at median, while Telecommunication Services had the lowest ratio of 2.2x, at median
- For the CEO vs. GC ratio, the Consumer Discretionary sector had the highest ratio of 5.2x at median, while Consumer staples had the lowest ratio of 3.6x, at median
Note: Telecommunication Services was not included because the sample was too small.
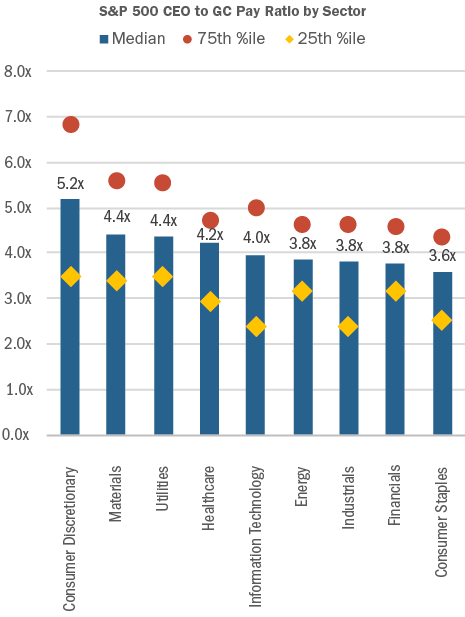
Note: Telecommunication Services was not included because the sample was too small.
How do ISS and Glass-Lewis use pay ratios?
Both proxy advisory firms include senior executive pay ratios in their annual proxy analyses.
- ISS includes the ratio of CEO pay versus the second highest paid active NEO, as well as the ratio of CEO pay versus the average of the other active NEOs. “Pay” includes all elements from the Summary Compensation Table; however, the grant-date value of stock options is updated to reflect ISS’ methodology which differs from accounting rules
- Glass-Lewis includes the ratio of CEO pay versus the average of other NEOs during each of the past three years. “Pay” includes select elements from the Summary Compensation Table: Salary, Bonus, Non-Equity Incentive Plan, Stock Awards, and Option Awards
ISS also uses pay ratio as one of the inputs to the Compensation score it assigns companies in its QuickScore 3.0 tool, which is meant to influence investment decisions through an assessment of risk factors. The ratio of CEO pay versus the second highest paid active NEO is included in QuickScore 3.0.
When do proxy advisors perceive there to be a possible issue?
To our knowledge, these ratios have not been used by ISS or Glass-Lewis to justify an Against Say on Pay vote recommendation. However, large pay discrepancies can reinforce other negative assessments. In general, comments from ISS and Glass-Lewis are likely when the CEO to NEO ratio exceeds 4x. Ratios exceed 4x at 5-10% of S&P companies, depending on which ratio is used (see ISS and Glass-Lewis definitions above). Ratios rising to 5-6x, or greater, will receive more strongly worded commentary.
Conclusion
Since companies are very different in their organizational and operational structures, we believe that there is limited utility in the CEO pay ratio disclosure that will be required by the SEC under Dodd-Frank. However, looking at the ratios of leadership pay at companies in the same business sector and/or of the same size, can provide important information and insights. It is worthwhile for compensation committees to track this information internally and on a relative basis. Such information can be used as an input in the pay benchmarking process and as a barometer of healthy succession planning, as well as contributing to effective talent acquisition and retention.
Annually, Compensation Advisory Partners (CAP) evaluates pay levels for Chief Financial Officers (CFOs) and Chief Executive Officers (CEOs). This year, the analysis is based on a sample of 100 companies with median revenues of $13 billion. For more information on criteria used to develop the sample of companies, please see Appendix.
Highlights
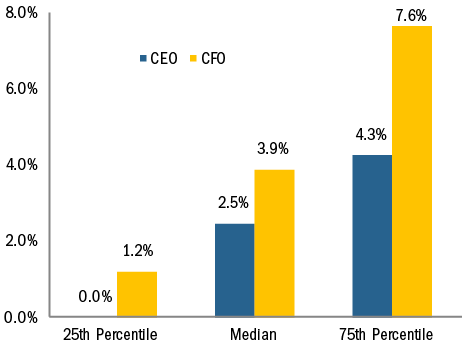
- Annual salary increases are increasing in prevalence for the third year in a row among CEOs and CFOs, with median increases of 2.5% and 3.9% respectively
- Similar to prior years, salary increases are provided much more frequently to CFOs than to CEOs, with over three quarters of CFOs studied receiving a salary increase in 2015
- The 2015 median increases in actual total direct compensation (i.e., cash plus equity) for both CEOs and CFOs were modest, 2.2% and 1.4% respectively
- At median, there was no growth in actual bonuses, partly reflective of a weaker performance year in 2015 vs 2014
- Median target bonus opportunities were flat for CEOs over the past 3 years; for CFOs median target bonuses were flat in 2015 after an increase from 2013 to 2014
- Growth in long-term incentive opportunities at median was in the mid-single digits for both positions
- CFO total compensation on an absolute basis approximates one-third of CEO total compensation, consistent with our findings in prior years
- Long-term incentive program structure has remained consistent over the past few years; performance-based equity continues to represent the largest component of LTI for CEOs and CFOs
Study Results
Salaries
In the last three years, we have seen a steady growth in the number of CEOs and CFOs receiving salary increases in a given year. Only 48% and 69% of CEOs and CFOs, respectively, received increases for the 2012-2013 period compared with 58% of CEOs and 77% of CFOs for the 2014-2015 period. Median 2015 salary increases were 3.9% for CFOs and 2.5% for CEOs.
|
% of Executives Receiving Salary Increases |
||||
|
2013 – 2014 |
2014 – 2015 |
|||
|
No Increase |
Receiving Increase |
No Increase |
Receiving Increase |
|
|
CEO |
49% |
51% |
42% |
58% |
|
CFO |
28% |
72% |
23% |
77% |
2015 Salary Increases
Actual Pay Levels
Based on our findings, the median rate of increase in actual total direct compensation levels for both CEOs and CFOs was approximately 2% for 2015. The median increases over the last two years ranged between 3% and 5%. The lower increases in total compensation for 2014-2015 are partially a result of no increase in bonuses, at median, and only slightly higher single digit increase in long-term incentives.
|
Median Percentage Change in Pay Components |
||||
|
2013 – 2014 |
2014 – 2015 |
|||
|
Pay Components |
CEO |
CFO |
CEO |
CFO |
|
Salary |
0.3% |
3.0% |
2.5% |
3.9% |
|
Actual Bonus |
4.3% |
7.8% |
0.0% |
-0.1% |
|
Long-Term Incentives |
3.7% |
4.2% |
6.8% |
7.6% |
|
Actual Total Direct Compensation |
3.2% |
5.2% |
2.2% |
1.4% |
As seen in the table above, the median 2015 increases by pay component were similar for both CFOs and CEOs. Similar to actual bonuses, median target bonuses remained flat for both CFOs (100% of base salary) and CEOs (150% of base salary).
|
Target Bonus as % of Salary |
||||
|
2014 |
2015 |
|||
|
CEO |
CFO |
CEO |
CFO |
|
|
75th Percentile |
165% |
105% |
180% |
120% |
|
Median |
150% |
100% |
150% |
100% |
|
25th Percentile |
125% |
80% |
130% |
80% |
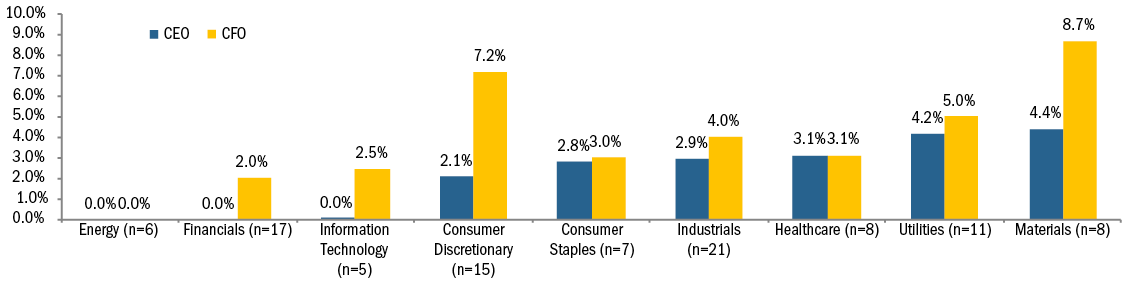
Median Salary Increase by Industry
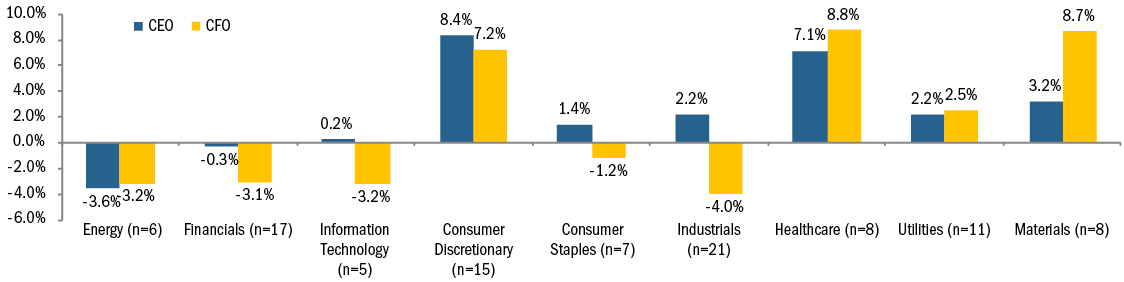
Median Actual Total Compensation Increase/Decrease by Industry
Median salary increases in salary are generally aligned for CEOs and CFOs within each specific industry, except for the Consumer Discretionary and Materials industries. Among the Consumer Discretionary industry, the median CEO increase was 2.1% compared to the CFO median increase of 7.2%. In the Materials industry, the median CEO increase was 4.4% compared to the CFO median increase of 8.7%. The Energy industry increases were 0% for both CFOs and CEOs. The salary freeze in the industry comes as no surprise given that some companies in the industry implemented salary freezes for 2015 after oil prices collapsed.
Differences by industry were more pronounced when looking at actual total direct compensation. There were more decreases in CEO or CFO total actual compensation in 2015 compared to 2014, primarily driven by weaker company performance and the annual incentive award paid as a result of performance. The Energy industry was the single industry where both CFOs and CEOs experienced similar declines in compensation, at median. Some of the largest increases in compensation levels were observed in Consumer Discretionary, Healthcare and Materials.
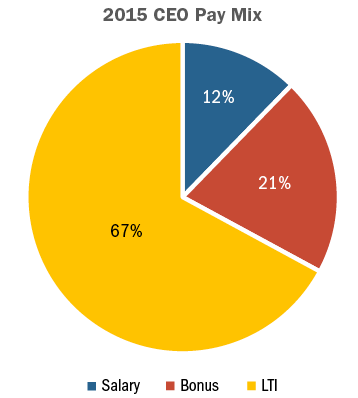
Target Pay Mix
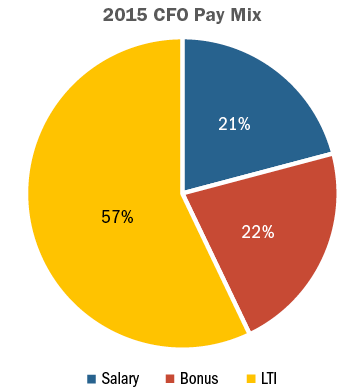
The structure of the overall pay program (salary, bonus, LTI) has remained largely unchanged since 2011. CEOs continue to receive less in the form of salary and more in variable pay components, especially LTI, than CFOs.
Long-Term Incentive (LTI) Vehicle Prevalence and Mix
We have seen very little change in the type of vehicles used to deliver LTI awards. Overall LTI mix also remains similar to the past several years. The majority of companies continue to use two different vehicles to deliver long-term incentives to CEOs/CFOs with approximately a quarter of companies studied using all 3 equity vehicles (stock options, time-based stock awards, and awards under a performance plan)
Performance plans account for roughly 50% of LTI awards on average. The other half of LTI is delivered almost equally between stock options and time-vested restricted stock awards. The overall weighting of performance-based awards (performance plans and stock options) for both CEOs and CFOs continues to range between 75% – 80%.
|
LTI Mix |
||||
|
2014 |
2015 |
|||
|
CEO |
CFO |
CEO |
CFO |
|
|
Stock Options |
26% |
25% |
24% |
23% |
|
Time Vested Restricted Stock |
21% |
26% |
20% |
25% |
|
Performance Plans |
53% |
49% |
56% |
52% |
Conclusion
2015 was not as strong a performance year as 2014. Median revenue growth was -1% (vs 6% in 2014), net income growth was -1% (vs 9% in 2014) and total shareholder return was -2% (vs 16% in 2014). Overall total pay increases were also smaller than in 2014, which we believe were directionally aligned with performance. While salary and long-term incentive increases for CFOs were slightly higher in 2015, actual bonus amounts were flat. This pattern was similar for CEOs in the study.
We expect overall pay mix to continue to emphasize the variable, at-risk components of pay. We also expect the current approach to delivering long-term incentives, with an emphasis on performance-based LTI plans to continue. In this era of increased scrutiny and Say on Pay, we anticipate that aligning pay outcomes with company performance will continue to be an imperative for companies and Boards.
APPENDIX
Sample Screening Methodology
Based on the screening criteria below, we arrived at a sample of 100 public companies with median 2015 revenue of $13B.
|
Revenue |
At least $5B in revenue for fiscal year 2015 |
|
Fiscal year-end |
Fiscal year-end between 9/1/2015 and 1/1/2016 |
|
Proxy Statement Filing Date |
Proxy statement filed before 3/31/2016 |
|
Tenure |
No change in CEO and CFO incumbents in the past three years |
The past year has been characterized by significant stock price volatility. Research indicates that the S&P 500 index has either gained 1% or more or lost 1% or more in a single day on 102 days during 2015. Individual stocks have experienced even higher volatility, with some industries (e.g., oil and gas, financial services) being hardest hit. This extreme variability in stock prices has continued through the period when most companies make annual grants of equity-based compensation to their directors, officers and employees. Since the overall stock price movement over this period has been down, many companies are finding that they need to grant more shares than they anticipated to deliver their targeted long-term incentive values to employees. In this CAPflash, we will lay out the nature of the issue and address alternative approaches that companies can use to respond to stock price decreases.
| Date | S&P 500 | S&P 500 Financials Sector | S&P 500 Energy Sector | S&P 500 Health Care Sector | ||||
| Value | ? vs. 8/15 | Value | ? vs. 8/15 | Value | ? vs. 8/15 | Value | ? vs. 8/15 | |
| 8/1/15 | $2,104 | – | $339 | – | $508 | – | $885 | – |
| 1/31/16 | $1,940 | -7.78% | $293 | -13.56% | $435 | -14.44% | $769 | -13.03% |
| 2/15/16 | $1,865 | -11.36% | $276 | -18.69% | $417 | -17.98% | $743 | -15.97% |
| 3/1/16 | $1,978 | -5.96% | $294 | -13.33% | $433 | -14.78% | $780 | -11.79% |
| 3/15/16 | $2,016 | -4.18% | $301 | -11.24% | $458 | -9.77% | $775 | -12.44% |
| 4/1/16 | $2,073 | -1.48% | $306 | -9.64% | $456 | -10.24% | $794 | -10.28% |
RECENT STOCK PRICES: A DOWNWARD TREND
In August 2015, around when many companies began their year-end compensation planning process, the S&P500 Index was at $2,104 and the S&P 500 Financials, Energy and Health Care sectors were at $339, $508 and $885, respectively. Scroll forward to January 31, 2016 and the S&P 500 Index was at $1,940 and the S&P 500 Financials, Energy and Health Care sectors were at $293, $435 and $769, respectively. The table below lays out the movements from August 1, 2015 into the current year, highlighting five common equity award dates.
While the overall indices moved significantly, the 25th percentile change through each of the above dates for companies in each of the above indices was as follows, indicating that for the lowest-performing one quarter of companies, stock prices fell by about 15% to 30%, or more, over this period.
| Date | S&P 500 | S&P 500 Financials | S&P 500 Energy | S&P 500 Health Care |
| 25th %ile ? vs. 8/15 | 25th %ile ? vs. 8/15 | 25th %ile ? vs. 8/15 | 25th %ile ? vs. 8/15 | |
| 8/1/15 | – | – | – | – |
| 1/31/16 | -20.21% | -21.14% | -35.26% | -22.72% |
| 2/15/16 | -25.24% | -29.25% | -45.40% | -25.25% |
| 3/1/16 | -18.29% | -22.02% | -37.35% | -21.86% |
| 3/15/16 | -17.22% | -19.37% | -27.40% | -22.76% |
| 4/1/16 | -14.78% | -18.10% | -31.67% | -19.32% |
MARKET NORMS FOR BURN RATE
CAP’s research indicates that burn rate (i.e., the number of shares granted during a given year divided by the weighted average number of common shares outstanding) among large public companies in the S&P 500 Index trends toward 1% of common shares outstanding when calculated excluding the factor of approximately 2X that ISS applies to full value awards to create equivalency with stock options. When the ISS conversion factor of approximately 2X is included, burn rate trends toward approximately 1.5% at median. On the lower end, burn rate of .5% or 1%, excluding or including the 2X conversion factor, respectively, is common. At the 75th percentile, burn rate of 2% to 4% is seen. This suggests that for a broad swath of public companies, ranging from $1 billion to $100 billion in revenues, burn rate in excess of 2% to 4% is difficult to sustain. Research on specific company peer groups could provide more refined comparisons, but this data gives the reader a general benchmark that applies across industries and size categories.
| Summary Statistics | Three-Year Average Burn Rate (including ISS Conversion Factor) | ||
| S&P Top 50 | S&P $5 B Cos. | S&P $1 B Cos. | |
| 75th Percentile | 2.13% | 2.55% | 3.82% |
| Median | 1.36% | 1.70% | 1.68% |
| 25th Percentile | 1.01% | 1.12% | 1.11% |
| Summary Statistics | Three-Year Average Burn Rate (excluding ISS Conversion Factor) | ||
| S&P Top 50 | S&P $5 B Cos. | S&P $1 B Cos. | |
| 75th Percentile | 1.03% | 1.32% | 1.88% |
| Median | 0.79% | 0.90% | 1.02% |
| 25th Percentile | 0.47% | 0.53% | 0.56% |
Note: S&P Top 50 reflects the 50 largest companies in the S&P 500 in terms of revenue with average trailing twelve month revenue of $108 billion. S&P $5 B Cos. reflects a 50 company subset of the S&P 500 with an average trailing twelve month revenue of $5 B. S&P $1 B Cos. reflects a 50 company subset of the S&P MidCap 400 with an average trailing twelve month revenue of $1 B.
IMPACT ON EQUITY GRANTS
Most companies make their annually equity grants based on a target dollar value for the long-term incentive award, rather than as a fixed number of shares. For example, a company may target a long-term incentive grant of $200,000 per year to a Vice President. For simplicity’s sake, let’s assume that the grant is made 100% in Restricted Share Units (RSUs). Most companies determine the number of shares to grant by dividing the target long-term incentive value by a stock price. Since companies are required to use the stock price on the date of grant for purposes of the disclosed value of equity grants, many companies use the stock price on the date of grant for converting award values into shares.
When the stock price declines significantly over a short period of time, there will be a significant increase in the number of shares required to deliver the target value. For example, let’s assume that the stock price was trading at $50.00 in September of 2015 when the company began their compensation planning and fell by 40% to $30.00 on March 1, 2016 when they make equity awards. In this situation, the number of shares required to deliver a $200,000 equity grant would increase by 67% from 4,000 shares to 6,667.
If the company is granting stock options, the share usage resulting from a decline in stock price is even more pronounced. Assuming a 3:1 ratio of options to RSUs, the grant required to deliver a $200,000 equity grant would increase from 12,000 options to 20,000 options.
Applied across the total employee population, this can create major concerns for the company with the potential to exhaust the reserve of shares available for grant under shareholder approved plans more quickly than anticipated. This will also increase the company’s annual share usage.
To the extent that equity plans reserves are exhausted and burn rates exceed industry norms, companies can run into difficulty when seeking shareholder approval of additional shares. If share usage is judged to be imprudent, or if shareholders see disconnects between pay and performance, particularly if facilitated by the equity plan, they are much less likely to support a request for new shares. The potential for perceived disconnects is heightened since higher burn rates typically occur when share prices are lower.
APPROACHES TO ADDRESS EQUITY GRANTS WHEN STOCK PRICE DECLINES
In our experience, companies address declining stock price in several different ways. The following are a few of the most common approaches:
Approach 1. Continue granting based on stock price at date of grant (i.e., do nothing)
In some cases, companies may feel that continuing to use their standard operating procedure for converting long-term incentive value into shares is the best approach. This could be because the company has been conservative in using shares in the past and has adequate shares available to cover multiple years of equity grants even with a significant stock price decline. The company may feel that a one year spike in their share usage will not raise significant concerns with shareholders or shareholder advisory firms. Another rationale that these companies may use for making grants as usual is that the value of any outstanding equity that executives hold will have fallen with the stock price. If the company reduces the value of equity grants as well, this may be a “double whammy” for long-term incentive participants. In our experience, Approach 1 can be untenable if the stock price falls by 30% or more.
- Advantages: Maintains target LTI award value for employees
- Disadvantages: Dilutive to shareholders; potential for “windfall” if stock price quickly recovers
Approach 2. Use an average stock price over a period of time to establish grants
This is a common approach companies use to mitigate the impact of short-term swings in stock price on the number of shares granted. Among companies that do not convert grant values into shares based on the stock price on the date of grant, the most common approach is to use an average stock price over a relatively short time period. We see a 20-trading day average most frequently. This approach avoids significant swings in the number of shares granted (up or down) based on stock price movement on the date of grant away from its near-term average. When companies have significant volatility over a sustained period of time, they may use a longer term average stock price (e.g., six months or one year) to mitigate the impact of volatility on grant size. The following chart lays out an illustration of this approach:
| Price Used | Target Value | Price | Shares | Acctng Value |
| Date of grant | $200,000 | $30.00 | 6,667 | $200,000 |
| 20-day average | $200,000 | $35.00 | 5,714 | $171,429 |
| 90-day average | $200,000 | $40.00 | 5,000 | $150,000 |
| 180-day average | $200,000 | $45.00 | 4,444 | $133,333 |
While using an average stock price helps manage the share usage when there is a stock decline, it will create disconnects between the target value of long-term incentives and the accounting value of the awards. Supplemental communication to employees is typically required to explain why the company thinks the average stock price methodology is a better estimate of value than the stock price on the date of grant. If the company uses this approach consistently over time, employees may recognize that the average price can be above or below the stock price on the date of grant.
- Advantages: Limits dilutive impact of stock price decrease
- Disadvantages: Potentially challenging to communicate to employees; disconnect between target LTI value and accounting value
Approach 3. Cap the run rate and pro rate grants accordingly
Some companies have committed to a maximum level of annual share usage or run rate. For example, a company may have committed to its shareholders or Compensation Committee that its annual run rate will not exceed 1.5% of common shares outstanding. If their stock price falls significantly, they may find that to deliver the target long-term incentive values under their program, they would need to grant 2.25% of common shares outstanding. In this situation, the company can pro rate all grants to keep the run rate at 1.5% of common shares outstanding. For example, if an executive’s target long-term incentive value was $200,000 and the stock price was $30.00, they would require 6,667 shares for this executive. Each grant would have to be multiplied by a factor of 1.5/2.25 or 2/3. In this case, the grant to the executive would be reduced from 6,667 shares to 4,444 shares and the accounting value of the award would be $133,333 instead of $200,000.
- Advantages: Limits dilutive impact of stock price decrease; simple; equitable treatment across employees
- Disadvantages: Reduces value of long-term incentive award to all employees
Approach 4. Limit participation in equity grants to conserve shares
Instead of making an across the board reduction in all equity grants, some companies will eliminate or significantly reduce long-term incentive awards for a portion of the population, while maintaining full awards for the remainder of the population. In practice, this often involves maintaining awards for senior executives where long-term incentives are viewed as most critical from a competitive perspective. For lower level long-term incentive participants, the company may limit grants to only those employees with performance that exceeds expectations or with critical skills. This approach may be acceptable if it is applied for one year, but may raise internal equity issues if extended beyond one year.
- Advantages: Limits dilutive impact of stock price decrease; targets awards at most critical employees
- Disadvantages: Potential strong negative response from excluded employees
Approach 5. Apply a discount to long-term incentive award guidelines
Another fairly simple way to address the issue of a stock price decline is to apply a discount to the long-term incentive award guidelines. Suppose that the stock price has fallen from $50 to $30 (or a 40% decline). In such a situation, the company would have to grant 67% more to maintain the LTI award target values. To mitigate the pressure that this will put on share usage, the company can apply a discount to the LTI target award value that partially adjusts for the impact of the stock price decline. For example, they could discount their LTI award guidelines by 25%. In this case, a $200,000 LTI award would be reduced to $150,000 and the grant would require 5,000 shares at a $30.00 stock price. This is more than the 4,000 shares that would have been required to deliver $200,000 at a $50.00 stock price, but is significantly less than the 6,667 shares required to deliver the full $200,000 at $30.00.
- Advantages: Limits dilutive impact of stock price decrease; simple; equitable treatment across employees
- Disadvantages: Reduces value of long-term incentive award to all employees
Approach 6. Use RSUs instead of stock options
To deliver a given long-term incentive award value, stock options require more shares than full value awards like RSUs or PSUs. Depending on the Black-Scholes value of stock options, the ratio of options to full value shares may be as low as 2:1 or as high as 5:1. For companies with equity plans that are not based on a fungible pool that treat options and full value shares the same, shifting the long-term incentive mix away from stock options towards full value shares can help ensure that equity grants will not exhaust the available pool.
For example, suppose a company has a mix of 50% stock options and 50% RSUs for its long-term incentive program. The company was planning on granting 1 million RSUs and 3 million stock options, but the stock price falls by 1/3 and now the company needs to grant 1.5 million RSUs and 4.5 million stock options. Unfortunately, their shareholder approved plan only has 5 million shares available for grant and the current 50%/50% LTI mix requires 6 million shares (1.5 million RSUs plus 4.5 million stock options). If they shift the mix from 50% RSUs / 50% stock options to 100% RSUs, the company will only need 3 million shares to deliver the target long-term incentive award value and they will not exhaust the share reserve.
- Advantages: Maintains target long-term incentive award value, potentially avoids exhausting share reserve, simple; equitable treatment across employees
- Disadvantages: Shareholders/Compensation Committee may prefer use of stock options to RSUs; shareholder advisors view RSUs as more dilutive than options on a per share basis
Approach 7. Use long-term cash instead of full value equity awards
Companies can conserve shares and reduce burn rate by replacing equity awards with cash. The most common approach is to grant long-term cash incentive awards instead of performance shares. Both types of award can be constructed with similar time frames, identical metrics and identical target values. But there are two significant differences. First, the ultimate value of performance shares will leverage up or down over the performance period in line with the value of the underlying shares. This exposes compensation realized by participants to additional volatility during periods when stock prices are uncertain. Cash awards will have more certainty and may therefore be valued more highly. Second, long-term cash awards are almost always settled in cash. Therefore, ancillary considerations, such as stock ownership guidelines, post-vesting holding periods, blackouts and insider trading policies are off the table.
In addition, long-term cash awards are not factored into burn rate calculations or into the estimates shareholders apply to the cost of equity plans. For example, ISS’ Equity Plan Scorecard does not value long-term cash, but would value outstanding performance shares. Similarly, long-term cash awards are not counted in calculations of overhang from equity plans or counted against equity plan share reserves, provided the awards are not denominated in share units settled in cash. Companies are required to book an accounting charge for the full cost of cash compensation, but effectively get a free pass on cash for other formulations of equity plan impact.
Awards of deferred cash designed to replace time-vested RSUs are seen less frequently, but could also be offered. The biggest decision involves whether to award fixed amount of cash for satisfying future service requirements or to provide either an interest component or some leverage tied to stock price performance.
- Advantages: Maintains target long-term incentive award value, potentially avoids exhausting share reserve, simple; equitable treatment across employees
- Disadvantages: Shareholders/Compensation Committee may prefer use of stock to cash to maintain alignment with shareholders
ADDITIONAL EQUITY COMPENSATION CONSIDERATIONS
In a time of severe stock price volatility, a company’s compensation program may be under pressure from multiple dimensions, beyond the current year’s equity grants:
- Reduced value of outstanding unvested full value shares: As the stock price declines, the value of any unvested equity held by employees will fall as well. This can reduce the value of outstanding equity as retention “handcuffs” and lowers the cost for competitors to buy executives out of their unvested equity. To the extent that all companies are affected equally by a stock price decline, this is not a major issue, but if the company’s stock price has declined more than the market overall, retention concerns will be heightened. If the company has a performance share plan, based on relative TSR and is underperforming on an absolute and relative basis, the retention issues will be even worse as the performance shares may be at risk of having no value
- Underwater stock options: A decline in stock price can reduce the intrinsic value of full value share awards, but as long as the stock price is above zero they still maintain some value. With stock options, the impact of a stock price decline can be more acute, as once the stock price falls below the exercise price the stock options no longer have any intrinsic value and employees may not place much value on the options at all.
- Economic uncertainty: To the extent that the stock price decline is driven by economic fundamentals (e.g., lower growth or lower profits), the company may have uncertainty about the likelihood of achieving its annual budget or long-term financial plan. This can further devalue the compensation program from the perspective of employees.
Unless the stock price decline is severe and sustained, it is uncommon for companies to cancel and replace underwater stock options or to make supplemental awards of full value shares to restore value to executives. However, when making compensation decisions in a year where the stock price has declined, it is useful to consider the context of employees’ total equity holdings and to err on the side of generosity for going forward equity grants to the extent possible.
CONCLUSIONS
Sudden stock price decreases can upset plans for annual equity grants by significantly straining the available share reserve and increasing the annual equity run rate. While there is no silver bullet approach that works for all companies, there are a number of alternative approaches that companies use to address stock price fluctuations. In choosing the approach that works best for your company, it is critical to determine the appropriate balance between the competing concerns of attracting and retaining employees with managing share dilution and protecting shareholder interests.
Overall Findings
- Performance: 2015 performance (based on Revenue growth, Pre-tax Income growth, EPS growth and 1-year Total Shareholder Return or TSR) was weaker than 2014 performance.
- CEO Pay: Median CEO pay was up 13% from 2014, driven by significant increases in the grant date value of long-term incentives (LTI) which are typically granted during the beginning of the fiscal year.
- Annual Incentive Payout: At median, annual incentive payouts (as a percentage of target) were lower in 2015 than the prior year. Additionally, there was more variability in payout around target compared to 2014 demonstrating a directional alignment between pay and performance.
- LTI Payout: Performance share plans paid out at target for the 2013-2015 performance period despite strong median 3-year cumulative TSR performance of 56%.
- Disclosure: Companies generally did not make wholesale changes to their proxy statements. Some enhanced their disclosure through the use of charts and graphs to make the proxy statement a communications document for shareholders.
2015 PERFORMANCE
2015 was a year that included an increase in the value of the U.S. dollar, volatility in foreign currency exchange rates and a slowdown in economic growth overseas (particularly in China). These factors contributed to 2015 performance being weaker than 2014 performance. CAP reviewed Revenue growth, Pre-tax Income growth, EPS growth and TSR performance for the Early Filers and the S&P 500. For the measures reviewed, 2015 performance was generally flat (0 – 3% growth) compared to the strong performance of 2014.
|
Financial Metric |
2014 Median 1-year Performance |
2015 Median 1-year Performance |
||
|
S&P 500 |
Early Filers |
S&P 500 |
Early Filers |
|
|
Revenue Growth |
5.6% |
5.7% |
0.8% |
2.4% |
|
Pre-Tax Income Growth |
8.6% |
6.4% |
0.2% |
1.2% |
|
EPS Growth |
10.6% |
10.4% |
2.6% |
3.2% |
|
TSR (1) |
16.3% |
14.1% |
2.3% |
0.3% |
(1) TSR for the S&P 500 is as of September 30, 2014 and September 30, 2015. TSR for Early Filers is as of each company’s fiscal year end.
CEO TOTAL DIRECT COMPENSATION
Among Early Filers with CEOs in their role for at least two years (n=42), 2015 actual total direct compensation increased 13% over 2014 pay levels. 2015 annual incentive payouts were down 3% reflecting weaker financial performance compared to the prior year. LTI grants in 2015, however, were significantly higher than 2014. This finding is likely reflective of the timing of LTI grants (typically in the first quarter of the fiscal year) and companies likely providing larger grants in 2015 because of the strong performance in 2014. Consistent with the expected salary increases, 2015 base salary was 3% higher than 2014.
|
Compensation Element (n=42) |
2014 Median ($000) |
2015 Median ($000) |
% Increase |
|
Base Salary |
$1,000 |
$1,031 |
3.1% |
|
Actual Annual Incentive |
$1,791 |
$1,731 |
-3.4% |
|
Total Cash |
$2,836 |
$2,663 |
-6.1% |
|
Long-Term Incentive (LTI) |
$5,468 |
$6,896 |
26.1% |
|
Total Direct Compensation |
$8,290 |
$9,399 |
13.4% |
INCENTIVE COMPENSATION
Annual Incentive Plan Payout
As mentioned above, actual annual incentive payouts in 2015 were lower than 2014. At median, 2015 payouts were 101% of target vs. 2014 payouts which were 111% of target. At the 25th percentile, 2015 payouts were much lower (76%) than 2014 (99%) but were more in line with 2013 and 2012 payouts which is indicative of a return to more normalized distribution of payouts in 2015.
|
Summary Statistics |
Annual Incentive Payout as a % of Target |
|||
|
2012 |
2013 |
2014 |
2015 |
|
|
75th Percentile |
130% |
127% |
135% |
133% |
|
Median |
100% |
95% |
111% |
101% |
|
25th Percentile |
72% |
75% |
99% |
76% |
As expected, performance was noticeably stronger for companies with an annual incentive payout that was at or above target. Conversely, performance for companies with a payout below target was weaker in 2015. These results are similar to 2014 performance, although TSR was stronger for companies with below target payout in 2014 (+7%) compared to 2015 (-11%).
|
Financial Metric |
2014 Median 1-year Performance |
2015 Median 1-year Performance (1) |
||
|
Below target payout (n=15) |
At or above target payout (n=35) |
Below target payout (n=24) |
At or above target payout (n=24) |
|
|
Revenue Growth |
3.6% |
6.3% |
-4.0% |
7.0% |
|
Pre-Tax Income Growth |
-2.9% |
12.7% |
-7.2% |
11.7% |
|
EPS Growth |
-3.4% |
13.5% |
-2.9% |
13.9% |
|
TSR (2) |
7.2% |
16.0% |
-10.7% |
12.6% |
(1) Excludes 2 companies that had spin-offs during 2015.
(2) TSR for Early Filers is as of each company’s fiscal year end.
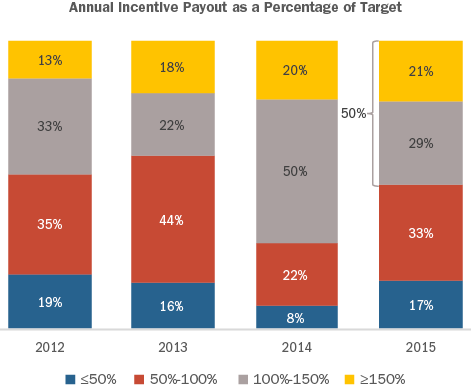
Overall, 50% of companies provided a payout at or above target in 2015 (consistent with 2013 and 2012) which is much lower than 2014 (70% of companies); as a result, there was more variability in payouts relative to target in 2015 than in 2014. Additionally, the number of companies providing a payout between 100 – 150% of target in 2015 is approximately half of what it was in 2014. Interestingly, nearly the same number of companies provided a payout of 150% and above in both 2014 and 2015. Finally, the number of companies not providing an annual incentive payout in 2015 increased (4 companies in 2015 vs. 1 company in 2014).
Long-Term Incentive Plan Payout
Three-year (2013 – 2015) performance was strong among Early Filers and the S&P 500. Cumulative Revenue growth was 11% (or 4% per year) for both Early Filers and the S&P 500. Cumulative EPS growth was very strong (21%) for the S&P 500 and more modest (11%) for the Early Filers. Overall, companies in both groups had significant stock price appreciation over the three-year period; 3-year cumulative TSR was 48% for the S&P 500 and 56% for the Early Filers.
|
Financial Metric |
Median 3-year Cumulative Performance |
|
|
S&P 500 |
All Early Filers (1) (n=42) |
|
|
Revenue Growth |
10.9% |
11.0% |
|
Pre-Tax Income Growth |
15.6% |
12.1% |
|
EPS Growth |
21.3% |
10.9% |
|
TSR (2) |
48.0% |
55.7% |
(1) Reflects only those companies with a performance share plan.
(2) TSR for the S&P 500 is as of September 30, 2015. TSR for Early Filers is as of each company’s fiscal year end.
Despite strong TSR performance over the three-year period, and even with 60% of companies using Relative TSR as a performance metric, median LTI payout was around target (98%). Median LTI payout for companies that use Relative TSR was slightly below target (95%); however, a majority of these companies (60%) use TSR in conjunction with other financial metrics.
|
Summary Statistics |
LTI Payout as a % of Target |
|
|
All Early Filers (n=42) |
Early Filers with TSR as a Metric (n=26) |
|
|
75th Percentile |
128% |
119% |
|
Median |
98% |
95% |
|
25th Percentile |
54% |
54% |
PROXY STATEMENT DISCLOSURE CHANGES
Since Say on Pay was adopted in 2011, companies have incorporated many new features to make their proxy statement a communications document for shareholders by including a proxy summary, an executive summary in the CD&A and highlighting good governance practices, just to name a few. While Early Filers generally did not make wholesale changes to their proxy statement in 2016, some companies enhanced their disclosure with additional charts and graphs. Some examples include:
- Deere & Co, which has annual incentive performance goals that can vary depending upon the company’s sales volume, added a graph to explain the performance goals, actual results and how each related to the actual sales volume achieved;
- Jabil Circuit, Jacobs Engineering Group and TE Connectivity added a list of corporate governance best practices (i.e., “what we do and what we do not do”);
- Starbucks added a picture describing their shareholder outreach process and topics discussed with shareholders.
We would expect that companies will have more significant changes to the proxy statement as more rules under Dodd-Frank (e.g., pay ratio and pay vs. performance) are finalized and implemented.
CONCLUSION
2015 was not as strong of a performance year as 2014. Given weaker 2015 performance, annual incentive payouts declined from 2014 levels resulting in a directional alignment between pay and performance. 2016 is already shaping up to be an interesting year given recent declines in stock price, currency fluctuations and overall uncertainty given the U.S. Presidential election. Many companies will be making their annual equity grants at depressed stock prices, so we may potentially see a year over year decline in LTI grant values particularly for those companies that grant awards based on a fixed number of shares. From an executive compensation perspective, we expect that the SEC will come out with final rules for the clawback, hedging and pay vs. performance in October 2016 which could have an impact on 2017 and 2018 disclosure.