An early look at the second year of CEO pay ratio disclosures shows that the ratios held steady for the overall sample, while on a company-by-company basis the ratio was quite volatile.
The 2019 Proxy Season has begun, and Compensation Advisory Partners (CAP) has done a comprehensive analysis of the second year of CEO pay ratio disclosures to identify what has changed and what trends are emerging. At a high level, CAP has found the following:
- CEO Pay Ratio: While CEO pay ratio summary statistics (e.g., 25th percentile, median, and 75th percentile) were flat across the sample, two-thirds of the sample companies had pay ratios that fluctuated up or down by more than 10 percent. The significant volatility in individual company pay ratios is masked in the overall sample, so proxy readers should not be surprised if a company’s pay ratio moved year-over-year.
- CEO Pay: CEO compensation increased 7 percent at median with two-thirds of CEO pay fluctuating by more than 10 percent. This may be driven by incentive compensation changing year to year, by CEO transitions and by changes in pension value calculations where applicable.
- Median Employee: Only 36 percent of companies used the same median employee year-over-year. For the companies that use the same median employee, the pay of that employee went up 7 percent at median. Where companies selected a new median employee, the year-over-year change in pay was 4 percent at median. This indicates that companies that want to maintain a lower CEO pay ratio may be better off keeping the same median employee from year to year if possible.
- Additional Disclosures: Despite interest expressed by some institutional shareholders in greater disclosure about the workforce, only 16 percent of companies disclosed additional information about the median employee (e.g., geographic location, role with the company, full-time vs. part-time, etc.). This is up from 12 percent of companies providing additional disclosures last year.
Methodology
CAP analyzed 201 of the first proxies filed in 2019 in order to study developing trends and examine differences from prior-year disclosures. The median company revenue of this sample is $2.1 billion. Detailed exhibits of findings are shown in appendix below this report.
Pay Ratio
CEO pay ratio at median, 25th and 75th percentiles are stable for this sample of companies when compared to the prior year.
| Summary Statistics | 2017 | 2018 | % Change |
| 75th Percentile | 165x | 165x | 0% |
| Median | 79x | 78x | -1% |
| 25th Percentile | 40x | 40x | +1% |
When looking at this sample on a company-matched basis, the percentage change of pay ratio was flat at median (-1%), 25th percentile (+1%) and 75th percentile (0%). Despite the flat year-over-year summary statistics, significant volatility in the pay ratio occurs at the individual company level, driven by both changes in pay levels for the CEO and in pay levels for the median employee. On a company-matched basis, about half of the sample had increases in the pay ratio, and half had decreases. When looking at the percentage change in the pay ratio, CAP found that two-thirds of companies had year-over-year changes in the pay ratio of more than +/-10 percent. This shows that while the total sample may seem unchanged year-over-year, individual companies have a good amount of variability that ends up being masked when the pay ratio data are viewed in aggregate. This individual company variation will likely be evident in coming years as well, as CEO and median employee pay can fluctuate significantly year to year. These factors coupled with the variety of methodologies that can be used continue to make drawing meaningful comparisons across companies difficult.
CEO and Median Employee Pay
CEO pay increased 7 percent at median, while the pay of the median employee increased 5 percent at median. While the increases in pay were similar at median, there was much greater volatility in CEO pay year-over-year with two-thirds of CEO pay fluctuating by more than 10 percent compared to one-third of median employees’ pay. This can be most easily explained by CEO’s having a much larger percentage of incentive compensation, generally, which may vary in magnitude year to year. Another source of fluctuation could be at companies where the CEO and/or the median employee participate in a pension plan, as increases to the discount rate used to value pension benefits can drive down Summary Compensation Table (SCT) pay. CEO and median employee pay moved in the same direction in 60 percent of companies, which shows at least some correlation between CEO pay and that of the typical employee. A correlation is more likely when the median employee is bonus and/or equity eligible, as more of his or her compensation is linked with the company and, therefore, the CEO’s.
Approximately 35 percent of companies used the same median employee for computing the CEO pay ratio as in the prior year. When a company used the same median employee as last year, the pay for that median employee increased between 7 percent and 8 percent at the median, 25th and 75th percentiles. This represents larger increases than when a company selected a new median employee, with median employee pay remaining relatively flat (0 to 4%). This indicates that re-selecting the median employee will more likely result in decreased or flat pay for the median employee, as salary typically increases over tenure, and incentive compensation tends to be modest for employees at this level. A decrease in median employee pay by more than 3 percent is twice as prevalent (27% versus 13%) at companies re-selecting their median employee. When a company selects a new median employee, they have the option of selecting a substantially similar employee from the previous year, seen approximately 20% of the time, or re-running the selection analysis in the current year, seen approximately 80% of the time.
| Median Employee Pay | ||||||
| Summary Statistics | Same Median Employee | Chose New Median Employee | ||||
| 2017 | 2018 | % Change | 2017 | 2018 | % Change | |
| 75th Percentile | $80,354 | $86,352 | +7% | $84,883 | $86,046 | +1% |
| Median | $59,248 | $63,665 | +7% | $58,658 | $60,726 | +4% |
| 25th Percentile | $46,163 | $49,976 | +8% | $44,980 | $44,974 | -0% |
Disclosure Features
Much of the structure of pay ratio disclosure remained parallel with last year. Approximately 60 percent of companies made reference to the prior-year disclosure in some way. However, only about 15 percent of these companies cited last year’s pay ratio, CEO pay or median employee pay. The location of the pay-ratio disclosure within the proxy statement was nearly identical, with more than 90 percent of the disclosures being within or after the compensation tables. The inclusion of non-discriminatory benefits (i.e., benefits such as health insurance that are provided to all employees and are not included in CEO pay in the SCT) in the CEO and median employee pay calculation remained steady, with an estimated 14 percent of companies including non-discriminatory benefits in the calculation this year, compared with approximately 13 percent of the S&P 500 last year. Including these non-discriminatory benefits in both pay calculations deflates CEO pay ratio as the proportion of pay this makes up is systematically larger for the median employee than for the CEO. The measurement date used, adjustments to employee compensation (cost of living, annualizing compensation), use of a comparability disclaimer and statistical sampling were all very stable as well, with only a handful of companies adopting or removing these features. The use of supplemental ratios, descriptors of the median employee, and exemptions from the employee population had more varied disclosures when compared to prior year.
Supplemental ratios
Supplemental ratios were disclosed at roughly the same rate year-over-year, with approximately 10 percent of companies providing a supplemental ratio. One supplemental ratio is by far the most prevalent practice. Using an alternate CEO compensation calculation continued to be the most prevalent (63%) driver of disclosing a supplemental ratio. Where this feature differed was in the consistency of individual companies between last year and this year. If the supplemental ratio was disclosed in order to explain a one-time event (e.g. special equity award, CEO transition) then that company would likely not have a supplemental ratio for this year. If the company used a supplemental ratio to show an alternate CEO compensation amount (e.g. exclude pension value) or an alternate employee demographic (e.g. exclude non-U.S. employees), then the supplemental ratio was almost always disclosed again.
Description of Median Employee
This year’s sample of early filers saw a slight uptick in the percentage of companies (16%) that provided any description of their median employee compared to last year’s early-filer sample (12%) and the S&P 500 (14%). These descriptions vary in detail but often provide insights into who the median employee is. Geographic location of employment (76%) and the role within the company (48%) are the two most common descriptors, but these are often paired and/or supplemented with detail around employment type (full-time versus part-time) and pay type (salaried versus hourly).
Exemptions from Employee Population
Similar to the use of supplemental ratios, the use of exemptions from the employee population when determining the median employee remained consistent (~37%) between last year and this year. Applying multiple exemptions is not uncommon (~20%), and the De Minimis exemption, whereby a company may exclude up to 5 percent of its non-U.S. employee workforce, continues to be the most commonly (64%) used case. Other exclusions included not considering employees gained from mergers and acquisitions (M&A) activity (33%), contractors (19%) and employees on a leave of absence (5%). When companies did not make the same exemptions again this year, either the company’s non-U.S. portion of its employee population is now over 5 percent, or an M&A event did not occur.
Looking Forward
Overall, the CEO pay ratio did not change materially at median. However, a closer look at the company-matched data shows that significant volatility in the CEO pay ratio occurred at individual companies. While there has not yet been a significant increase in supplemental disclosures outside of the proxy statement or additional disclosures about the median employee, such information may be disclosed more frequently in the future as pressure mounts from shareholders and institutional investors. Looking beyond the CEO pay ratio disclosure itself, shareholders and institutional investors definitely want more disclosure about companies’ human capital. Whether this information is provided through the CEO pay ratio disclosure or elsewhere remains to be seen.
Appendix
Year 2 vs Year 1 – Same Company Data
Overview – Total Sample
| CEO Pay Ratio | 2017 | 2018 | % Change |
| Summary Statistics (n=201) | |||
| Maximum | 2483x | 2508x | +1% |
| 90th Percentile | 341x | 301x | -12% |
| 75th Percentile | 165x | 165x | 0% |
| Median | 79x | 78x | -1% |
| 25th Percentile | 40x | 40x | +1% |
| 10th Percentile | 18x | 20x | +13% |
| Minimum | 2x | 3x | +47% |
| CEO Pay | 2017 | 2018 | % Change |
| Summary Statistics (n=201) | |||
| Maximum | $42,247,984 | $129,499,005 | +207% |
| 90th Percentile | $15,845,991 | $15,695,189 | -1% |
| 75th Percentile | $10,253,787 | $9,989,992 | -3% |
| Median | $5,060,220 | $5,422,777 | +7% |
| 25th Percentile | $2,347,314 | $2,726,774 | +16% |
| 10th Percentile | $1,072,999 | $1,333,951 | +24% |
| Minimum | $339,165 | $306,000 | -10% |
| Median Employee Pay | 2017 | 2018 | % Change |
| Summary Statistics (n=201) | |||
| Maximum | $964,005 | $256,300 | -73% |
| 90th Percentile | $123,347 | $118,209 | -4% |
| 75th Percentile | $83,153 | $86,046 | +3% |
| Median | $59,092 | $61,782 | +5% |
| 25th Percentile | $45,409 | $47,252 | +4% |
| 10th Percentile | $34,967 | $35,724 | +2% |
| Minimum | $4,828 | $4,563 | -5% |
Overview – Disclosure Features
| Makes Any Reference to Year 1 Disclosure |
Prevalence |
Percentage |
| Summary Statistics (n=201) | ||
| Yes | 117 | 58% |
| No | 84 | 42% |
| Mentions Year 1 Pay Ratio, CEO Pay, or Median EE Comp |
Prevalence |
Percentage |
| Summary Statistics (n=201) | ||
| Yes | 31 | 15% |
| No | 170 | 85% |
| Uses Same Median Employee as Year 1 |
Prevalence |
Percentage |
| Summary Statistics (n=201) | ||
| Yes | 73 | 36% |
| No – Reran Analysis | 105 | 52% |
| No – Used Similar Employee as Year 1 | 23 | 11% |
| Discloses Change(s) in Methodology from Year 1 |
Prevalence |
Percentage |
| Summary Statistics (n=201) | ||
| Yes | 3 | 1% |
| No | 198 | 99% |
| CEO Pay & Median Employee Pay Movement from Year 1 |
Prevalence |
Percentage |
| Summary Statistics (n=201) | ||
| Both Increase | 91 | 45% |
| CEO Pay Increased & Median Employee Pay Decreased | 29 | 14% |
| CEO Pay Decreased & Median Employee Pay Increased | 52 | 26% |
| Both Decrease | 29 | 14% |
Overview – Companies Choosing To Use The Same Median Employee
| CEO Pay Ratio | 2017 | 2018 | % Change |
| Summary Statistics (n=73) | |||
| Maximum | 1830x | 1511x | -17% |
| 75th Percentile | 157x | 147x | -6% |
| Median | 90x | 84x | -7% |
| 25th Percentile | 45x | 44x | -3% |
| Minimum | 10x | 7x | -30% |
| CEO Pay | 2017 | 2018 | % Change |
| Summary Statistics (n=73) | |||
| Maximum | $42,247,984 | $129,499,005 | +207% |
| 75th Percentile | $10,845,759 | $9,793,261 | -10% |
| Median | $5,060,220 | $5,658,238 | +12% |
| 25th Percentile | $2,926,176 | $2,828,289 | -3% |
| Minimum | $545,525 | $607,332 | +11% |
| Median Employee Pay | 2017 | 2018 | % Change |
| Summary Statistics (n=73) | |||
| Maximum | $186,172 | $191,473 | +3% |
| 75th Percentile | $80,186 | $85,704 | +7% |
| Median | $59,092 | $62,150 | +5% |
| 25th Percentile | $46,370 | $50,226 | +8% |
| Minimum | $5,237 | $6,348 | +21% |
Overview – Companies Selecting a New Median Employee
| CEO Pay Ratio | 2017 | 2018 | % Change |
| Summary Statistics (n=128) | |||
| Maximum | 2483x | 2508x | +1% |
| 75th Percentile | 172x | 186x | +8% |
| Median | 76x | 73x | -4% |
| 25th Percentile | 33x | 36x | +10% |
| Minimum | 2x | 3x | +47% |
| CEO Pay | 2017 | 2018 | % Change |
| Summary Statistics (n=128) | |||
| Maximum | $31,082648 | $29,118,118 | -6% |
| 75th Percentile | $10,030,633 | $10,168,771 | +1% |
| Median | $4,933,902 | $5,172,842 | +5% |
| 25th Percentile | $2,175,523 | $2,662,381 | +22% |
| Minimum | $339,165 | $306,000 | -10% |
| Median Employee Pay | 2017 | 2018 | % Change |
| Summary Statistics (n=128) | |||
| Maximum | $964,005 | $256,300 | -73% |
| 75th Percentile | $84,883 | $86,046 | +1% |
| Median | $58,659 | $60,726 | +4% |
| 25th Percentile | $44,980 | $44,974 | -0% |
| Minimum | $4,828 | $4,563 | -5% |
How Pay and Pay Ratio Changed – Total Sample
| How Did Pay Ratio Change? |
Prevalence |
Percentage |
| Summary Statistics (n=201) | ||
| Increased | 100 | 50% |
| Decreased | 96 | 48% |
| Remained the Same | 5 | 2% |
| How Did CEO Pay Change? |
Prevalence |
Percentage |
| Summary Statistics (n=201) | ||
| Increased | 119 | 59% |
| Decreased | 81 | 40% |
| Remained the Same | 1 | 0% |
| How Did Median Employee Pay Change? |
Prevalence |
Percentage |
| Summary Statistics (n=201) | ||
| Increased | 143 | 71% |
| Decreased | 58 | 29% |
| Remained the Same | 0 | 0% |
How Pay and Pay Ratio Changed – Total Sample
| How Did Pay Ratio Change? |
Prevalence |
Percentage |
| Summary Statistics (n=201) | ||
| Increased by 25% or more | 39 | 19% |
| Increased by 10% to 25% | 30 | 15% |
| Increased by 3% to 10% | 22 | 11% |
| Changed between -3% to 3% | 24 | 12% |
| Decreased by 3% to 10% | 19 | 9% |
| Decreased by 10% to 25% | 43 | 21% |
| Decreased by 25% or more | 24 | 12% |
| How Did CEO Pay Change? |
Prevalence |
Percentage |
| Summary Statistics (n=201) | ||
| Increased by 25% or more | 42 | 21% |
| Increased by 10% to 25% | 39 | 19% |
| Increased by 3% to 10% | 28 | 14% |
| Changed between -3% to 3% | 24 | 12% |
| Decreased by 3% to 10% | 17 | 8% |
| Decreased by 10% to 25% | 28 | 14% |
| Decreased by 25% or more | 23 | 11% |
| How Did Median Employee Pay Change? |
Prevalence |
Percentage |
| Summary Statistics (n=201) | ||
| Increased by 25% or more | 11 | 5% |
| Increased by 10% to 25% | 34 | 17% |
| Increased by 3% to 10% | 66 | 33% |
| Changed between -3% to 3% | 46 | 23% |
| Decreased by 3% to 10% | 23 | 11% |
| Decreased by 10% to 25% | 12 | 6% |
| Decreased by 25% or more | 9 | 4% |
How Pay and Pay Ratio Changed – Companies Choosing To Use The Same Median Employee
| How Did Pay Ratio Change? |
Prevalence |
Percentage |
| Summary Statistics (n=73) | ||
| Increased | 27 | 37% |
| Decreased | 43 | 59% |
| Remained the Same | 3 | 4% |
| How Did CEO Pay Change? |
Prevalence |
Percentage |
| Summary Statistics (n=73) | ||
| Increased | 42 | 58% |
| Decreased | 31 | 42% |
| Remained the Same | 0 | 0% |
| How Did Median Employee Pay Change? |
Prevalence |
Percentage |
| Summary Statistics (n=73) | ||
| Increased | 61 | 84% |
| Decreased | 12 | 16% |
| Remained the Same | 0 | 0% |
How Pay and Pay Ratio Changed – Companies Choosing To Use The Same Median Employee
| How Did Pay Ratio Change? |
Prevalence |
Percentage |
| Summary Statistics (n=73) | ||
| Increased by 25% or more | 11 | 15% |
| Increased by 10% to 25% | 5 | 7% |
| Increased by 3% to 10% | 7 | 10% |
| Changed between -3% to 3% | 10 | 14% |
| Decreased by 3% to 10% | 8 | 11% |
| Decreased by 10% to 25% | 18 | 25% |
| Decreased by 25% or more | 14 | 19% |
| How Did CEO Pay Change? |
Prevalence |
Percentage |
| Summary Statistics (n=73) | ||
| Increased by 25% or more | 13 | 18% |
| Increased by 10% to 25% | 11 | 15% |
| Increased by 3% to 10% | 11 | 15% |
| Changed between -3% to 3% | 10 | 14% |
| Decreased by 3% to 10% | 8 | 11% |
| Decreased by 10% to 25% | 9 | 12% |
| Decreased by 25% or more | 11 | 15% |
| How Did Median Employee Pay Change? |
Prevalence |
Percentage |
| Summary Statistics (n=73) | ||
| Increased by 25% or more | 6 | 8% |
| Increased by 10% to 25% | 13 | 18% |
| Increased by 3% to 10% | 33 | 45% |
| Changed between -3% to 3% | 12 | 16% |
| Decreased by 3% to 10% | 4 | 5% |
| Decreased by 10% to 25% | 5 | 7% |
| Decreased by 25% or more | 0 | 0% |
How Pay and Pay Ratio Changed – Companies Selecting a New Median Employee
| How Did Pay Ratio Change? |
Prevalence |
Percentage |
| Summary Statistics (n=128) | ||
| Increased | 73 | 57% |
| Decreased | 53 | 41% |
| Remained the Same | 2 | 2% |
| How Did CEO Pay Change? |
Prevalence |
Percentage |
| Summary Statistics (n=128) | ||
| Increased | 77 | 60% |
| Decreased | 50 | 39% |
| Remained the Same | 1 | 1% |
| How Did Median Employee Pay Change? |
Prevalence |
Percentage |
| Summary Statistics (n=128) | ||
| Increased | 82 | 64% |
| Decreased | 46 | 36% |
| Remained the Same | 0 | 0% |
How Pay and Pay Ratio Changed – Companies Selecting a New Median Employee
| How Did Pay Ratio Change? |
Prevalence |
Percentage |
| Summary Statistics (n=128) | ||
| Increased by 25% or more | 28 | 22% |
| Increased by 10% to 25% | 25 | 19% |
| Increased by 3% to 10% | 15 | 12% |
| Changed between -3% to 3% | 14 | 11% |
| Decreased by 3% to 10% | 11 | 9% |
| Decreased by 10% to 25% | 25 | 19% |
| Decreased by 25% or more | 10 | 8% |
| How Did CEO Pay Change? |
Prevalence |
Percentage |
| Summary Statistics (n=128) | ||
| Increased by 25% or more | 29 | 23% |
| Increased by 10% to 25% | 28 | 22% |
| Increased by 3% to 10% | 17 | 13% |
| Changed between -3% to 3% | 14 | 11% |
| Decreased by 3% to 10% | 9 | 7% |
| Decreased by 10% to 25% | 19 | 15% |
| Decreased by 25% or more | 12 | 9% |
| How Did Median Employee Pay Change? |
Prevalence |
Percentage |
| Summary Statistics (n=128) | ||
| Increased by 25% or more | 5 | 4% |
| Increased by 10% to 25% | 21 | 16% |
| Increased by 3% to 10% | 33 | 26% |
| Changed between -3% to 3% | 34 | 27% |
| Decreased by 3% to 10% | 19 | 15% |
| Decreased by 10% to 25% | 7 | 5% |
| Decreased by 25% or more | 9 | 7% |
Early Disclosures Year 2 vs Year 1
Overview – Total Sample
| CEO Pay Ratio | Revenue
($mm) |
CEO Pay | Median Employee Pay | Pay Ratio | Number of Employees |
| Summary Statistics (n=201) | |||||
| Maximum | $170,756 | $129,499,005 | $256,300 | 2508x | 350,600 |
| 90th Percentile | $19,167 | $15,695,189 | $118,209 | 301x | 52,131 |
| 75th Percentile | $6,946 | $9,989,992 | $86,046 | 165x | 17,521 |
| Median | $2,138 | $5,422,777 | $61,782 | 78x | 5,148 |
| 25th Percentile | $587 | $2,726,774 | $47,252 | 40x | 1,382 |
| 10th Percentile | $152 | $1,333,951 | $35,724 | 20x | 511 |
| Minimum | $24 | $306,000 | $4,563 | 3x | 19 |
Year 1 Early Disclosures:
| CEO Pay Ratio | Revenue
($mm) |
CEO Pay | Median Employee Pay | Pay Ratio | Number of Employees |
| Summary Statistics (n=300) | |||||
| Maximum | $213,395 | $113,572,988 | $580,335 | 5463x | 364,575 |
| 90th Percentile | $22,014 | $16,179,146 | $144,886 | 325x | 51,370 |
| 75th Percentile | $7,033 | $10,608,763 | $95,149 | 171x | 16,960 |
| Median | $1,879 | $5,302,622 | $60,823 | 80x | 3,964 |
| 25th Percentile | $409 | $2,465,703 | $45,349 | 32x | 937 |
| 10th Percentile | $127 | $969,417 | $34,082 | 15x | 271 |
| Minimum | $0 | $0 | $2,526 | 1x | 13 |
Location in Proxy Statement
| Placement In Proxy |
Prevalence |
Percentage |
| Summary Statistics (n=201) | ||
| Before CD&A | 1 | 0% |
| Within CD&A | 10 | 5% |
| Directly Before Compensation Tables | 7 | 3% |
| Within Compensation Tables | 43 | 21% |
| After Compensation Tables | 140 | 70% |
Year 1 Early Disclosures:
| Placement In Proxy |
Prevalence |
Percentage |
| Summary Statistics (n=300) | ||
| Before CD&A | 1 | 0% |
| Within CD&A | 14 | 5% |
| Just Prior To or Within Compensation Tables | 71 | 24% |
| Following “Potential Payments Upon Termination” Section | 214 | 71% |
Supplemental Ratios
| Supplemental Ratios |
Prevalence |
Percentage |
| Summary Statistics (n=201) | ||
| Companies Disclosing a Supplemental Ratio | 19 | 9% |
| Companies Not Disclosing a Supplemental Ratio | 182 | 91% |
| Supplemental Ratios – How Many |
Prevalence |
Percentage |
| Summary Statistics (n=19) | ||
| Companies Disclosing One Supplemental Ratio | 18 | 95% |
| Companies Disclosing More Than One Supplemental Ratio | 1 | 5% |
Year 1 Early Disclosures:
| Supplemental Ratios |
Prevalence |
Percentage |
| Summary Statistics (n=300) | ||
| Companies Disclosing a Supplemental Ratio | 32 | 11% |
| Companies Not Disclosing a Supplemental Ratio | 268 | 89% |
| Supplemental Ratios |
Prevalence |
Percentage |
| Summary Statistics (n=32) | ||
| Companies Disclosing One Supplemental Ratio | 27 | 84% |
| Companies Disclosing More Than One Supplemental Ratio | 5 | 16% |
| Supplemental Ratios – Rationale |
Prevalence |
Percentage |
| Summary Statistics (n=19) | ||
| Alternate CEO Compensation Calculation | 12 | 63% |
| Alternate Employee Compensation Calculation | 2 | 11% |
| Alternate CEO and Employee Compensation Calculation | 1 | 5% |
| Alternate Employee Demographic | 2 | 11% |
| Both Change Compensation Calculation and Employee Demographic | 0 | 0% |
| Multiple Reasons | 2 | 11% |
| Supplemental Ratios – Rationale |
Prevalence |
| Summary Statistics | |
| Alternate CEO Compensation Calculation | 13 |
| Alternate Employee Compensation Calculation | 4 |
| Alternate CEO and Employee Compensation Calculation | 2 |
| Alternate Employee Demographic | 3 |
| Both Change Compensation Calculation and Employee Demographic | 0 |
Year 1 Early Disclosures:
| Supplemental Ratios – Rationale |
Prevalence |
Percentage |
| Summary Statistics (n=32) | ||
| Alternate CEO Compensation Calculation | 17 | 53% |
| Alternate Employee Compensation Calculation | 1 | 3% |
| Alternate CEO and Employee Compensation Calculation | 6 | 19% |
| Alternate Employee Demographic | 4 | 13% |
| Both Change Compensation Calculation and Employee Demographic | 4 | 13% |
Measurement Date / Month
| Measurement Date |
Prevalence |
Percentage |
| Summary Statistics (n=201) | ||
| Last Day of Q4 | 103 | 51% |
| First Day of Q4 | 30 | 15% |
| Other | 61 | 30% |
| Not Disclosed | 7 | 3% |
| Measurement Month |
Prevalence |
Percentage |
| Summary Statistics (n=201) | ||
| First Month of Quarter | 54 | 27% |
| Second Month of Quarter | 17 | 8% |
| Last Month of Quarter | 123 | 61% |
| Not Disclosed | 7 | 3% |
Year 1 Early Disclosures:
|
|
Exemptions From Employee Population
| Exemptions From Employee Population |
Prevalence |
Percentage |
| Summary Statistics (n=201) | ||
| Disclosed Utilizing Exemptions | 75 | 37% |
| No Disclosure About Utilizing Exemptions | 126 | 63% |
Year 1 Early Disclosures:
| Exemptions From Employee Population |
Prevalence |
Percentage |
| Summary Statistics (n=300) | ||
| Disclosed Utilizing Exemptions | 106 | 35% |
| No Disclosure About Utilizing Exemptions | 194 | 65% |
| Exemptions From Employee Population – Rationale |
Prevalence |
Percentage |
| Summary Statistics (n=75) | ||
| Geographic (De Minimis) | 36 | 48% |
| Do Not Set Group of Employees Pay | 8 | 11% |
| Merger / Acquisition(s) | 13 | 17% |
| Employees on Leave of Absence | 3 | 4% |
| Multiple Reasons | 15 | 20% |
| Exemptions From Employee Population – Rationale |
Prevalence |
Percentage |
| Summary Statistics (n=75) | ||
| Geographic (De Minimis) | 48 | 64% |
| Do Not Set Group of Employees Pay | 14 | 19% |
| Merger / Acquisition(s) | 25 | 33% |
| Employees on Leave of Absence | 4 | 5% |
Year 1 Early Disclosures:
| Exemptions From Employee Population – Rationale |
Prevalence |
Percentage |
| Summary Statistics (n=106) | ||
| Geographic (De Minimis) | 56 | 53% |
| Do Not Set Group of Employees Pay | 9 | 8% |
| Merger / Acquisition(s) | 11 | 10% |
| Multiple Reasons | 21 | 20% |
| Other | 9 | 8% |
Description of Median Employee
| Description of Median Employee |
Prevalence |
Percentage |
| Summary Statistics (n=201) | ||
| Disclosure Includes A Description of Median Employee | 33 | 16% |
| Disclosure Does Not Include A Description of Median Employee | 168 | 84% |
| Type of Description |
Prevalence |
Percentage |
| Summary Statistics (n=33) | ||
| Geographic Location of Employment Only | 7 | 21% |
| Employment Type (Full-time, part-time, etc.) Only | 0 | 0% |
| Pay Type (Salary, hourly, etc.) Only | 0 | 0% |
| Role Only | 4 | 12% |
| Compensation Detail Only | 2 | 6% |
| Multiple Descriptors | 20 | 61% |
| Type of Description |
Prevalence |
Percentage |
| Summary Statistics (n=33) | ||
| Geographic Location of Employment | 25 | 76% |
| Employment Type (Full-time, part-time, etc.) | 13 | 39% |
| Pay Type (Salary, hourly, etc.) | 10 | 30% |
| Role | 16 | 48% |
| Compensation Detail | 8 | 24% |
Year 1 Early Disclosures:
| Describes Median Employee |
Prevalence |
Percentage |
| Summary Statistics (n=300) | ||
| Disclosure Includes A Description of Median Employee | 35 | 12% |
| Disclosure Does Not Include A Description of Median Employee | 265 | 88% |
Adjustments to Employee Compensation
| Cost of Living Adjustments |
Prevalence |
Percentage |
| Summary Statistics (n=201) | ||
| Utilized COLA For Median Employee Pay | 1 | 0% |
| Did Not Utilize COLA For Median Employee Pay | 52 | 26% |
| Silent | 148 | 74% |
| Annualized Employee Compensation |
Prevalence |
Percentage |
| Summary Statistics (n=201) | ||
| Annualized Employee Compensation per CACM | 84 | 42% |
| Did Not Annualize Employee Compensation per CACM | 30 | 15% |
| Silent | 87 | 43% |
Year 1 Early Disclosures:
| Cost of Living Adjustments |
Prevalence |
Percentage |
| Summary Statistics (n=300) | ||
| Utilized COLA For Median Employee Pay | 3 | 1% |
| Did Not Utilize COLA For Median Employee Pay | 95 | 32% |
| Silent | 202 | 67% |
| Annualized Employee Compensation |
Prevalence |
Percentage |
| Summary Statistics (n=300) | ||
| Annualized Employee Compensation per CACM | 132 | 44% |
| Did Not Annualize Employee Compensation per CACM | 40 | 13% |
| Silent | 128 | 43% |
Comparability Disclaimer
| Comparability Disclaimer |
Prevalence |
Percentage |
| Summary Statistics (n=201) | ||
| Disclosure Includes Disclaimer | 56 | 28% |
| Disclosure Does Not Include Disclaimer | 145 | 72% |
Year 1 Early Disclosures:
| Comparability Disclaimer |
Prevalence |
Percentage |
| Summary Statistics (n=300) | ||
| Disclosure Includes Disclaimer | 80 | 27% |
| Disclosure Does Not Include Disclaimer | 220 | 73% |
CEO & Median Employee Compensation Includes Non-Discriminatory Benefits
| Compensation Includes Non-Discriminatory Benefits? |
Prevalence |
Percentage |
| Summary Statistics (n=176) | ||
| Yes | 25 | 14% |
| No | 151 | 86% |
Year 1 Subset of S&P 500:
| Compensation Includes Non-Discriminatory Benefits? |
Prevalence |
Percentage |
| Summary Statistics (n=353) | ||
| Yes | 45 | 13% |
| No | 308 | 87% |
Joshua Hovden and Stella Kovoros provided research assistance for this report.
Founding Partner Kelly Malafis discusses the current state of gender pay equity
In January 2018, gender pay equity took a national stage as news outlets reported on the dramatic disparity in pay between actress, Michelle Williams, and her male co-star, Mark Wahlberg. Ms. Williams received only $1,000 for re-shooting scenes for the film All the Money in the World, while Mr. Wahlberg received $1.5M, meaning that a male employee made 1500x his female counterpart. While the pay disparity in corporate America may not be as stark, and the employees not as famous, this example is illustrative of the type of pay inequity that has become a topic of discussion across industries. This CAPintel summarizes the current state of the conversation around gender pay equity to provide context to executives and directors as they begin to have these discussions at their organizations.
Key Takeaways
- Several institutional investors have specifically pushed gender pay equity into the limelight by engaging companies and requesting that they disclose their gender pay statistics
- CAP’s research finds that female representation among top 5 Named Executive Officers (NEOs) is limited; less than 50% of the companies in our sample had a female among the NEO group
- Among companies with female NEOs, non-CEO female pay was 87% of their non-CEO male counterparts at median
- 7% of companies had a female CEO. Among this small sample, median total compensation was 23% higher than median total compensation for male CEOs
- Mandatory gender pay gap disclosure went live in the U.K. in 2018 and the data supports unequal representation of women in higher paying roles
- While disclosure is not required in the U.S., momentum is building among both institutional investors and state legislatures to act to prevent pay inequity
- In CAP’s view, the focus on gender pay equity is not an isolated event, but part of a larger movement toward establishing greater equality and diversity in work environments
Background
Gender pay equity is a topic being discussed in the news and across corporate America. In the U.S., the pay of working women is 80% of the pay earned by males, according to the Institute for Women’s Policy Research. Boards of directors and chief executive officers have become increasingly focused on promoting equality and diversity initiatives as institutional investors have incorporated board diversity and other Environment, Social and Governance (ESG) issues into their proxy voting guidelines. Several institutional investors have specifically pushed gender pay equity into the limelight by engaging companies and requesting that they disclose their gender pay statistics. Individual states and cities in the U.S. are taking steps to prevent future pay inequity.
Outside the U.S., several countries, including the U.K., Nordic countries, Germany and Australia, have adopted laws requiring organizations to disclose, or in some of the more aggressive cases eliminate, their gender pay gaps. These laws highlight that companies around the world need to be thinking about the pay disparities that exist within their organizations and try to understand the underlying issues that cause these disparities.
Gender Pay Equity in the U.S.
In recent years several institutional shareholders have helped bring gender pay equity to the forefront by pressuring large public companies to voluntarily disclose statistics regarding the gap between wages for men and women. One institutional investor, Arjuna Capital, has effectively targeted companies through gender pay equity-related shareholder proposals since 2016. While none of these shareholder proposals received majority support, 21 companies have disclosed or committed to disclose gender pay gap information. Among the companies that have disclosed to date, many of which are from the financial services and technology industries, the disclosures generally reveal a wage gap of 0-1% for men and women in comparable roles and locations.
These reports seem to indicate that these companies have done a lot of work to close the gap in wages for men and women in the same job function; however, these voluntary disclosures do not include information about the number of men and women in each comparable pay band. As a result, it is unclear how successful companies have been in addressing the structural issue of inequitable representation of men and women in leadership roles and other high paying jobs, a factor viewed as contributing to overall gender pay inequity.
To date, it is not clear how major institutional investors and proxy advisory firms will use this information. In their 2018 policy updates, Institutional Shareholder Services (ISS) introduced guidelines on how they will assess shareholder proposals related to gender pay equity. Considerations include:
- The company’s current policies and disclosure related to both its diversity and inclusion policies and practices, its compensation philosophy and fair and equitable compensation practices,
- Whether the company has been the subject of recent controversy or litigation related to gender pay gap issues; and
- Whether the company’s reporting regarding gender pay gap policies or initiatives is lagging its peers.
U.S. Public Company Gender Pay Equity among Named Executive Officers (NEOs)
To get a sense of the current state of gender equality with respect to both pay and representation in leadership among U.S. public companies, CAP analyzed the compensation of top executives at 150 companies with revenues greater than $19B, as disclosed in the Summary Compensation Table in 2017/18 proxy statements. Among our sample, we found that:
- 7% of companies had a female CEO. Among this small sample, median total compensation was 23% higher than median total compensation for male CEOs
- 53% of our sample had a male-only NEO group
- Among the remaining 47% of companies, non-CEO female NEOs made 87% of their non-CEO male NEO counterparts at median. CAP arrived at this finding by calculating the ratio between average female non-CEO NEO pay and average male non-CEO NEO pay for each company with at least one female NEO, excluding those where the only female NEO was the CEO.
The NEO pay gap directionally aligns with the average median pay gap reported in the news. CAP’s analysis did not control for other circumstances that inform pay levels (e.g., job function, tenure, individual performance, etc.); however, these findings provide further support that the disparity in pay between men and women is, in many cases, attributable (at least in part) to the lack of female representation in top leadership positions at many organizations.
Gender Pay Equity in the U.K.
In February 2017, the U.K. government adopted rules requiring “relevant employers” with more than 250 U.K. employees to publish gender pay gap data for those employees located in the U.K. by April 4, 2018. The rule requires approximately 9,000 employers in both the private and public sectors to disclose the following:
- Mean and median gender pay equity gap in hourly pay
- Mean and median bonus gender pay gap
- Proportion of males and females receiving a bonus payment
- Proportion of males and females in each pay quartile
On April 5, the day after the filing deadline, the Financial Times reported that the average reported median pay gap between men and women was approximately 10%. We have seen that this gap varies by company and industry. For example, several large financial services companies have reported median pay gaps that are notably larger than average.
Unlike the voluntary disclosures in the U.S., U.K. companies do not have any flexibility in calculating these statistics because the rules are very prescriptive. Where U.S. disclosures have shown the pay gap between male and female employees in substantially similar roles, U.K. disclosures are required to disclose statistics for all U.K. employees regardless of role. While the reporting coming out of the U.K. does not tell us if men and women are receiving the same pay for the same work, it does tell us that men are, overall, earning more than women, indicating that there are more men in higher paying roles than women.
To address this point, many companies try to explain the “why” behind their reported figures. These explanations tend to support the notion that a greater proportion of male employees are in higher paying roles than their female counterparts. Specific rationales include:
- More men are in senior roles
- Fewer men are in part-time roles that tend to pay less
- More men are bonus eligible
Some organizations went further and disclosed how they plan to address the disparity including diversity targets that they plan to achieve in the next 5 to 10 years.
Anti-discrimination Laws in the U.S.
While U.S. regulators have not adopted gender pay equity disclosure requirements, several states and cities have passed, or have proposed, legislation aimed at preventing future pay inequity. These laws generally aim to accomplish this goal by prohibiting employers from inquiring about a prospective employee’s salary history among other provisions.
For example, in Massachusetts, the Act to Establish Equal Pay includes the following requirements:
- Employers may not inquire about salary/benefits history before extending an offer;
- Employers may not prohibit employees from talking to co-workers about wages/benefits;
- Employers must pay women based on competitive market rates and not salary history.
Laws in most other states and cities contain similar provisions to the Massachusetts law. One recent outlier is New Jersey’s Equal Pay Act, which passed the legislature on April 10, 2018 and is considered among the most rigorous. The law requires equal pay for “substantially similar work” and allows employees to seek up to six years of backpay for discriminatory pay practices.
Conclusion
In CAP’s view, the focus on gender pay equity is not an isolated incident, but part of a larger movement toward establishing greater equality and diversity in work environments. Research supports that organizations with greater gender diversity are stronger financial performers. While many organizations have initiatives to promote and achieve a better gender balance, accountability and tone from the top is important to achieving those goals.
While the U.S. may not have prescriptive national legislation in the near term, we expect that institutional shareholders will continue to push for companies to voluntarily disclose diversity statistics, including gender pay gaps. It will be important for companies to be able to assess the state of their gender pay gap, and to diagnose the underlying issues that cause any identified disparity in pay between male and female employees. We view the current spotlight on gender pay gaps as the first step towards addressing equality in pay as well as the more structural issue of representation across all levels in the organization.
The CAP 100 Company Research consists of 100 companies from 9 industries, selected to provide a broad representation of market practice among large U.S. public companies. In this report, CAP reviewed Pay Strategies, Annual Incentives, Long-Term Incentives, Perquisites, and Shareholder Friendly Provisions of these companies in order to gauge general market practices and trends.
Characteristics of the CAP 100 Company Research Sample
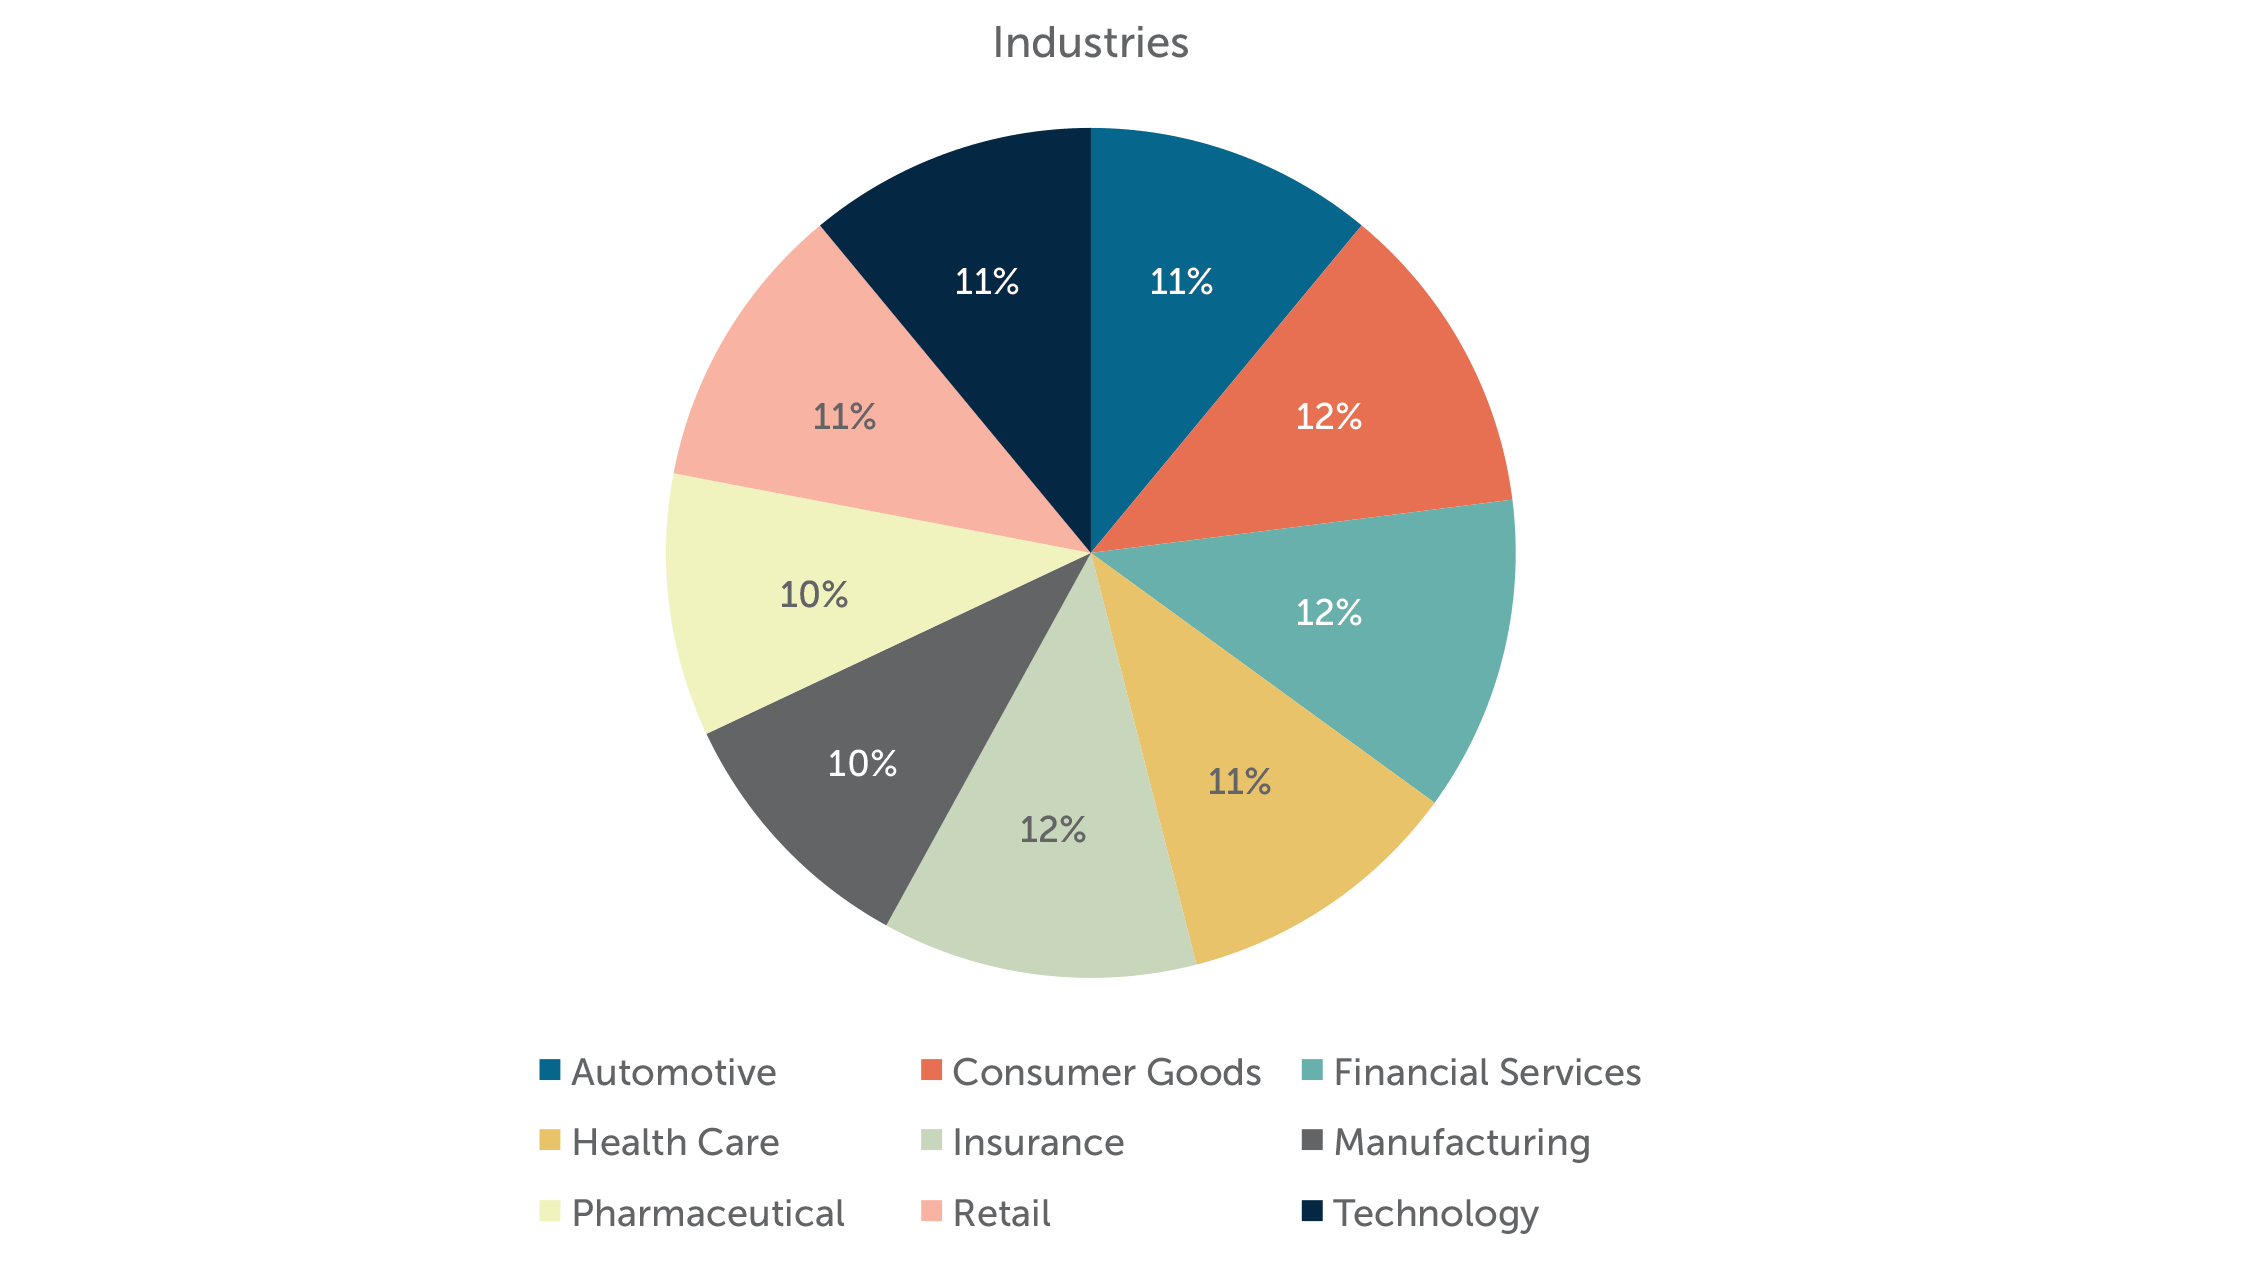
The CAP 100 Company Research Study consists of 100 companies selected from nine industries intended to provide a broad representation of market practice among large U.S. public companies. The revenues of the companies in our sample range from $18 billion at the 25th percentile to $64 billion at the 75th percentile, with median revenues of $32 billion.
| Percentile Rank | Revenue | Net Income | Assets | Market
Cap |
Cumulative TSR for Periods ending on 12/31/2016 | ||
| 1-Year | 3-Year | 5-Year | |||||
| 75th | $63,783 | $6,379 | $177,135 | $106,570 | 94% | 78% | 49% |
| Median | $31,928 | $2,814 | $62,396 | $49,149 | 64% | 52% | 31% |
| 25th | $18,029 | $1,303 | $28,107 | $25,261 | 41% | 35% | 19% |
Pay Strategy
Among companies in CAP’s 100 Company Research, 100% disclose using a peer group of public companies for pay benchmarking purposes. The median number of companies in a peer group is 18 companies.
Approximately one-third of these companies (31%) use more than one peer group. Companies with two or more peer groups may use an industry specific peer group as well as a general industry peer group for benchmarking purposes. Alternatively, an industry peer group may be used for benchmarking purposes and a second broader peer group, typically from an index of stocks, may be used for relative performance comparisons.
| Peer Group | ||
| % of companies with a disclosed peer group | % of companies with more than one peer group (among companies with a peer group) | Median # of companies in peer group |
| 100% | 31% | 18 |
54% of the companies disclose a target pay philosophy for total compensation. The vast majority of these companies (91%) use median as a benchmark, with only 9% of companies targeting compensation above the median. This reflects a 10 percentage point decrease from last year in companies targeting pay above median.
| Target Pay Philosophy | |||||
| Element | Base | Bonus | Cash | Long-Term Incentive | Total Compensation |
| % Disclosing | 39% | 28% | 27% | 31% | 54% |
| % Target Median Pay | 92% | 100% | 100% | 97% | 91% |
| % Target Above Median Pay | 3% | 0% | 0% | 0% | 9% |
Annual Incentive
Award Leverage
CAP reviewed proxy disclosure to understand how companies are establishing the annual incentive payout ranges (i.e., the threshold payout and the maximum payout expressed as a percentage of the target payout) for annual incentives. Most companies that we reviewed identify the minimum payout as zero and do not separately disclose a threshold level of performance. For the 41 companies that did disclose a threshold bonus payout other than zero, a payout of 50% of target is the most common percentage. 19 companies disclose a minimum bonus payout of less than 50% of target.
84 companies disclose a maximum bonus opportunity. A majority of companies (70%) have a maximum bonus opportunity of 200% of target. Four companies have a maximum bonus of 250% of target or higher, with 300% of target being the highest.
| Annual Incentive Plan Payout Range | ||||||||||||||||||||||||||||||||||||||||
|---|---|---|---|---|---|---|---|---|---|---|---|---|---|---|---|---|---|---|---|---|---|---|---|---|---|---|---|---|---|---|---|---|---|---|---|---|---|---|---|---|
|
|
|||||||||||||||||||||||||||||||||||||||
Annual Incentive Plan Metrics
Revenue, Operating Income, EPS, and Cash Flow are the most common metrics used in annual incentive plans. Most companies use two or three performance metrics to fund their annual incentive plans. Absolute financial performance targets based on a company’s budget predominate, with relative metrics used infrequently in annual incentive plans.

The use of multiple performance metrics allows for annual incentive payouts to be tied more closely to overall company performance in a balanced fashion. For example, companies using bottom-line measures in the annual incentive plan will often also include top-line measures for balance.
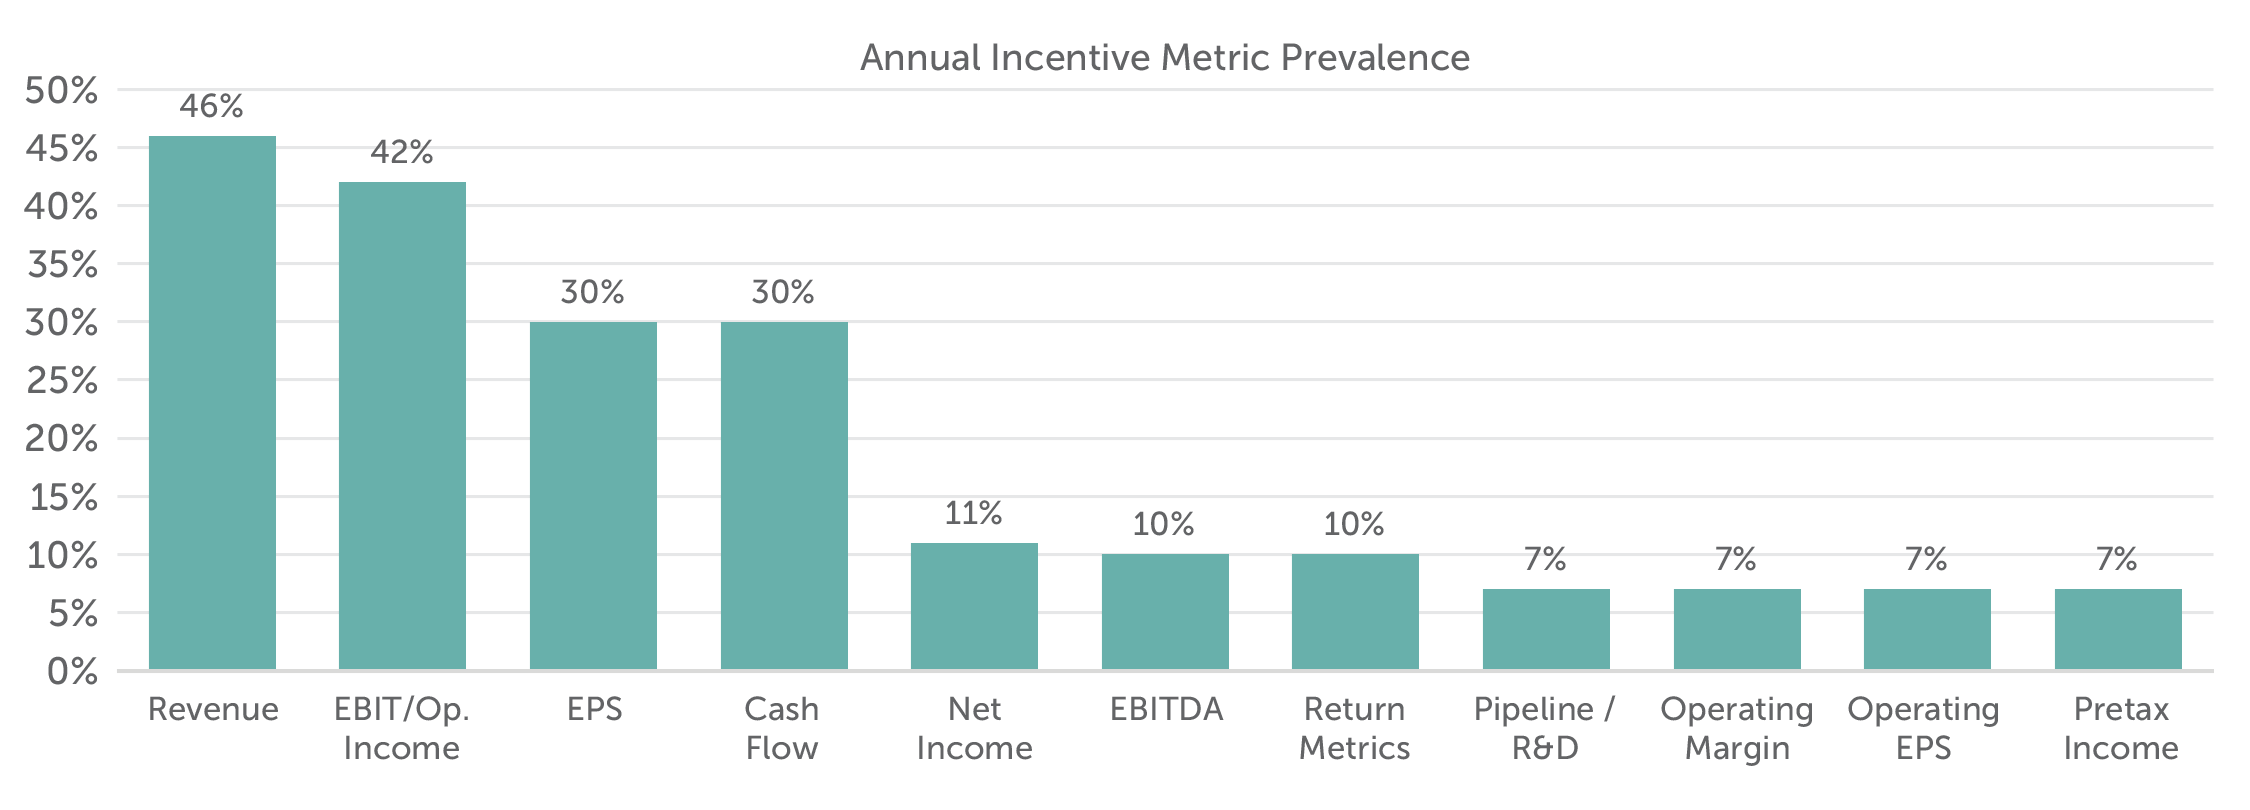
The use of revenue as an annual incentive metric is prevalent across most industries, along with a profit metric (e.g. operating income, EPS, net income, etc.) and cash flow.
The chart below shows the three (3) most common metrics by industry in 2016:
| Industry | Metrics | ||
| Metric #1 | Metric #2 | Metric #3 | |
| Automotive | EBIT / Op. Inc. (55%) | Cash Flow (55%) | ROA / ROE (36%) |
| Consumer Goods | Revenue (67%) | EPS (58%) | EBIT / Op. Inc. (42%) |
| Financial Services | EPS (17%) | n.m. | n.m. |
| Health Care | EPS (55%) | EBIT / Op. Inc. (36%) | Revenue and Cash Flow (both 27%) |
| Insurance | EBIT / Op. Inc. (50%) | Op. EPS (33%) | Op. ROE (25%) |
| Manufacturing | Cash Flow (60%) | EPS (40%) | EBIT / Op. Inc. (30%) |
| Pharmaceuticals | Revenue (80%) | Pipeline / R&D (70%) | EPS (60%) |
| Retail | Revenue (73%) | EBIT / Op. Inc. (73%) | n.m. |
| Technology | Revenue (64%) | Cash Flow (55%) | EBIT / Op. Inc. (45%) |
Note: Percentages reflect the prevalence of companies disclosing the metric.
2016 Actual Bonus Payouts
Overall, the median CEO bonus payout for 2016 performance was 101% of target – generally flat compared to the median payout for 2015 performance of 104%. Across industries, bonuses for Pharmaceutical and Consumer Goods CEOs exceeded target by the greatest amount (125% and 123% of target, at median, respectively). Three of the nine industries CAP surveyed had a median bonus payout of less than 100%: Financial Services, Manufacturing, and Retail. Compared to bonuses paid for 2015 performance. Compared to bonuses paid for 2015 performance, Consumer Goods experienced the greatest increase and Retail the greatest decrease, year-over-year.
Median CEO bonus payouts for 2016 compared to 2015
| Industry | CEO Bonus Payout at a Percent of Target | |||||
| 75th Percentile | Median | 25th Percentile | ||||
| 2016 | 2015 | 2016 | 2015 | 2016 | 2015 | |
| Automotive | 160% | 163% | 109% | 100% | 76% | 75% |
| Consumer Goods | 149% | 146% | 123% | 98% | 109% | 71% |
| Financial Services | 98% | 124% | 86% | 113% | 81% | 91% |
| Health Care | 129% | 156% | 106% | 138% | 86% | 117% |
| Insurance | 133% | 117% | 100% | 102% | 84% | 82% |
| Manufacturing | 116% | 108% | 99% | 102% | 85% | 96% |
| Pharmaceutical | 145% | 165% | 125% | 155% | 117% | 113% |
| Retail | 98% | 153% | 57% | 102% | 38% | 84% |
| Technology | 118% | 105% | 100% | 94% | 94% | 81% |
| Total Sample | 131% | 152% | 101% | 104% | 85% | 84% |
Note: Most companies in the Financial Services industry do not disclose a target bonus for the CEO. For these companies, three-year average actual bonus was used as a substitute for target.
Long-Term Incentives
Over the past six years, the percentage of companies using stock options declined by 14 percentage points to 61%. The prevalence of time-based restricted stock/units declined by three percentage points. Performance-based vehicles have replaced stock options and time-based restricted stock/units over the last five years.
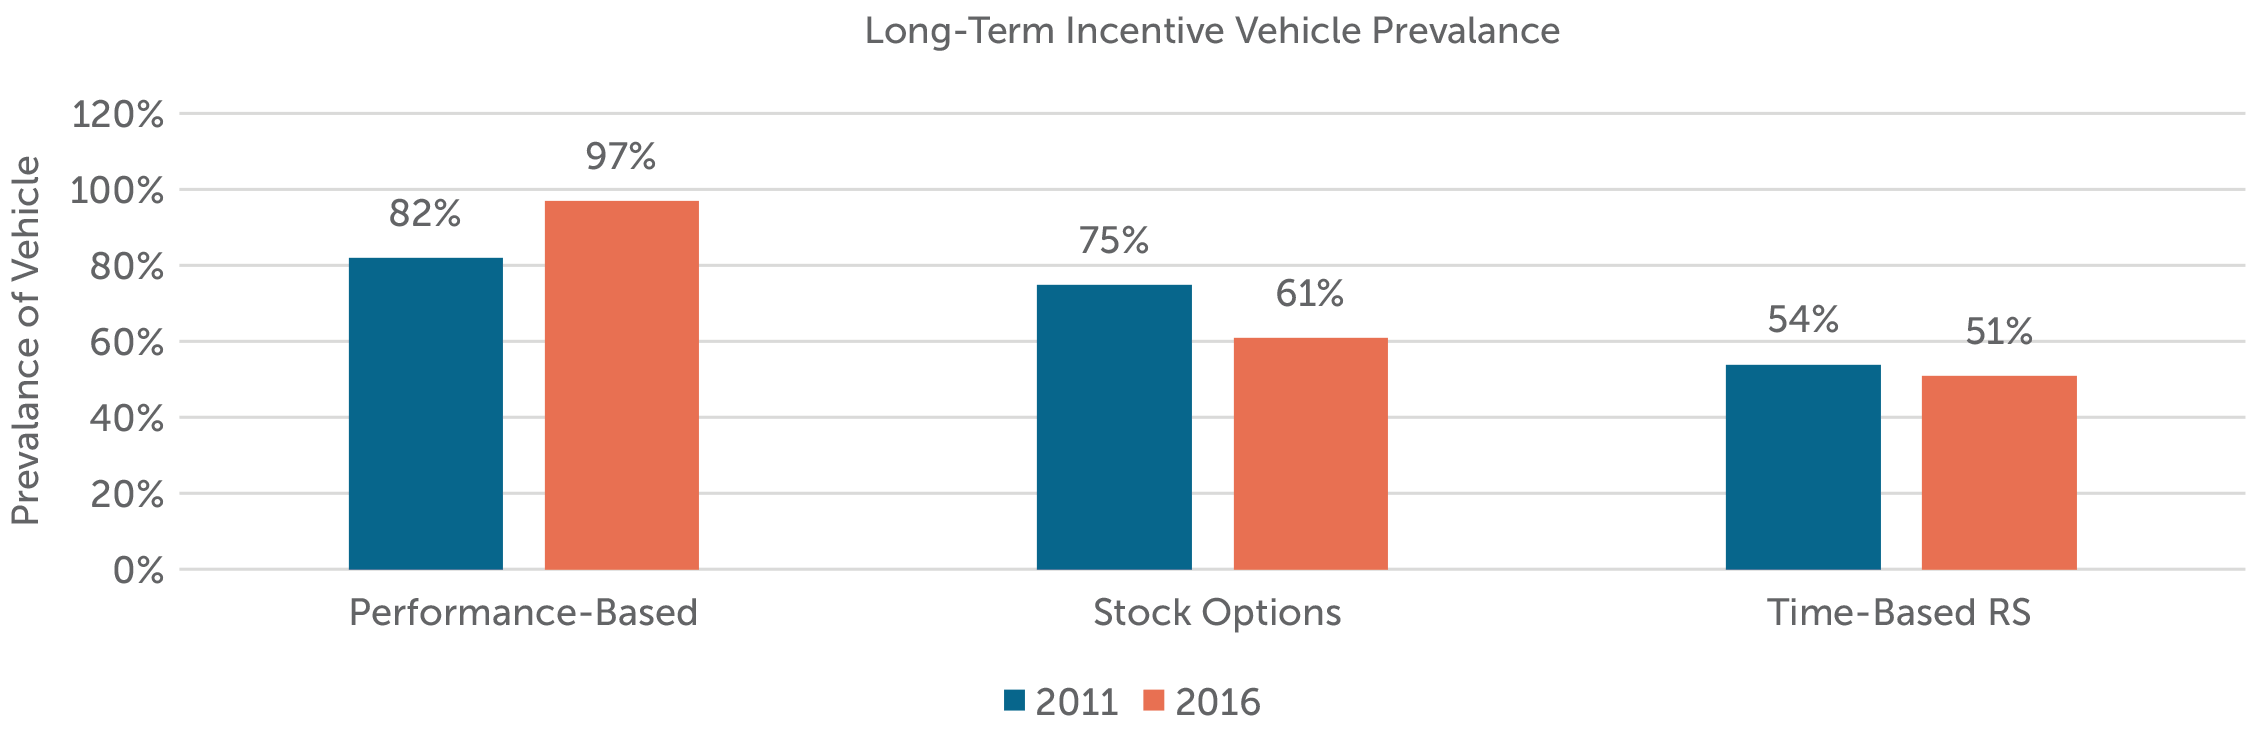
The majority of companies (59%) use two vehicles to deliver long-term incentives. Of these companies, most use a combination of a long-term performance plan and stock options (57%). The next most common approach is to use three vehicles (25% of companies), and the least common approach is to use only one vehicle (16% of companies). Among companies only using one vehicle, all but two use a long-term performance plan.

LTI AWARD MIX
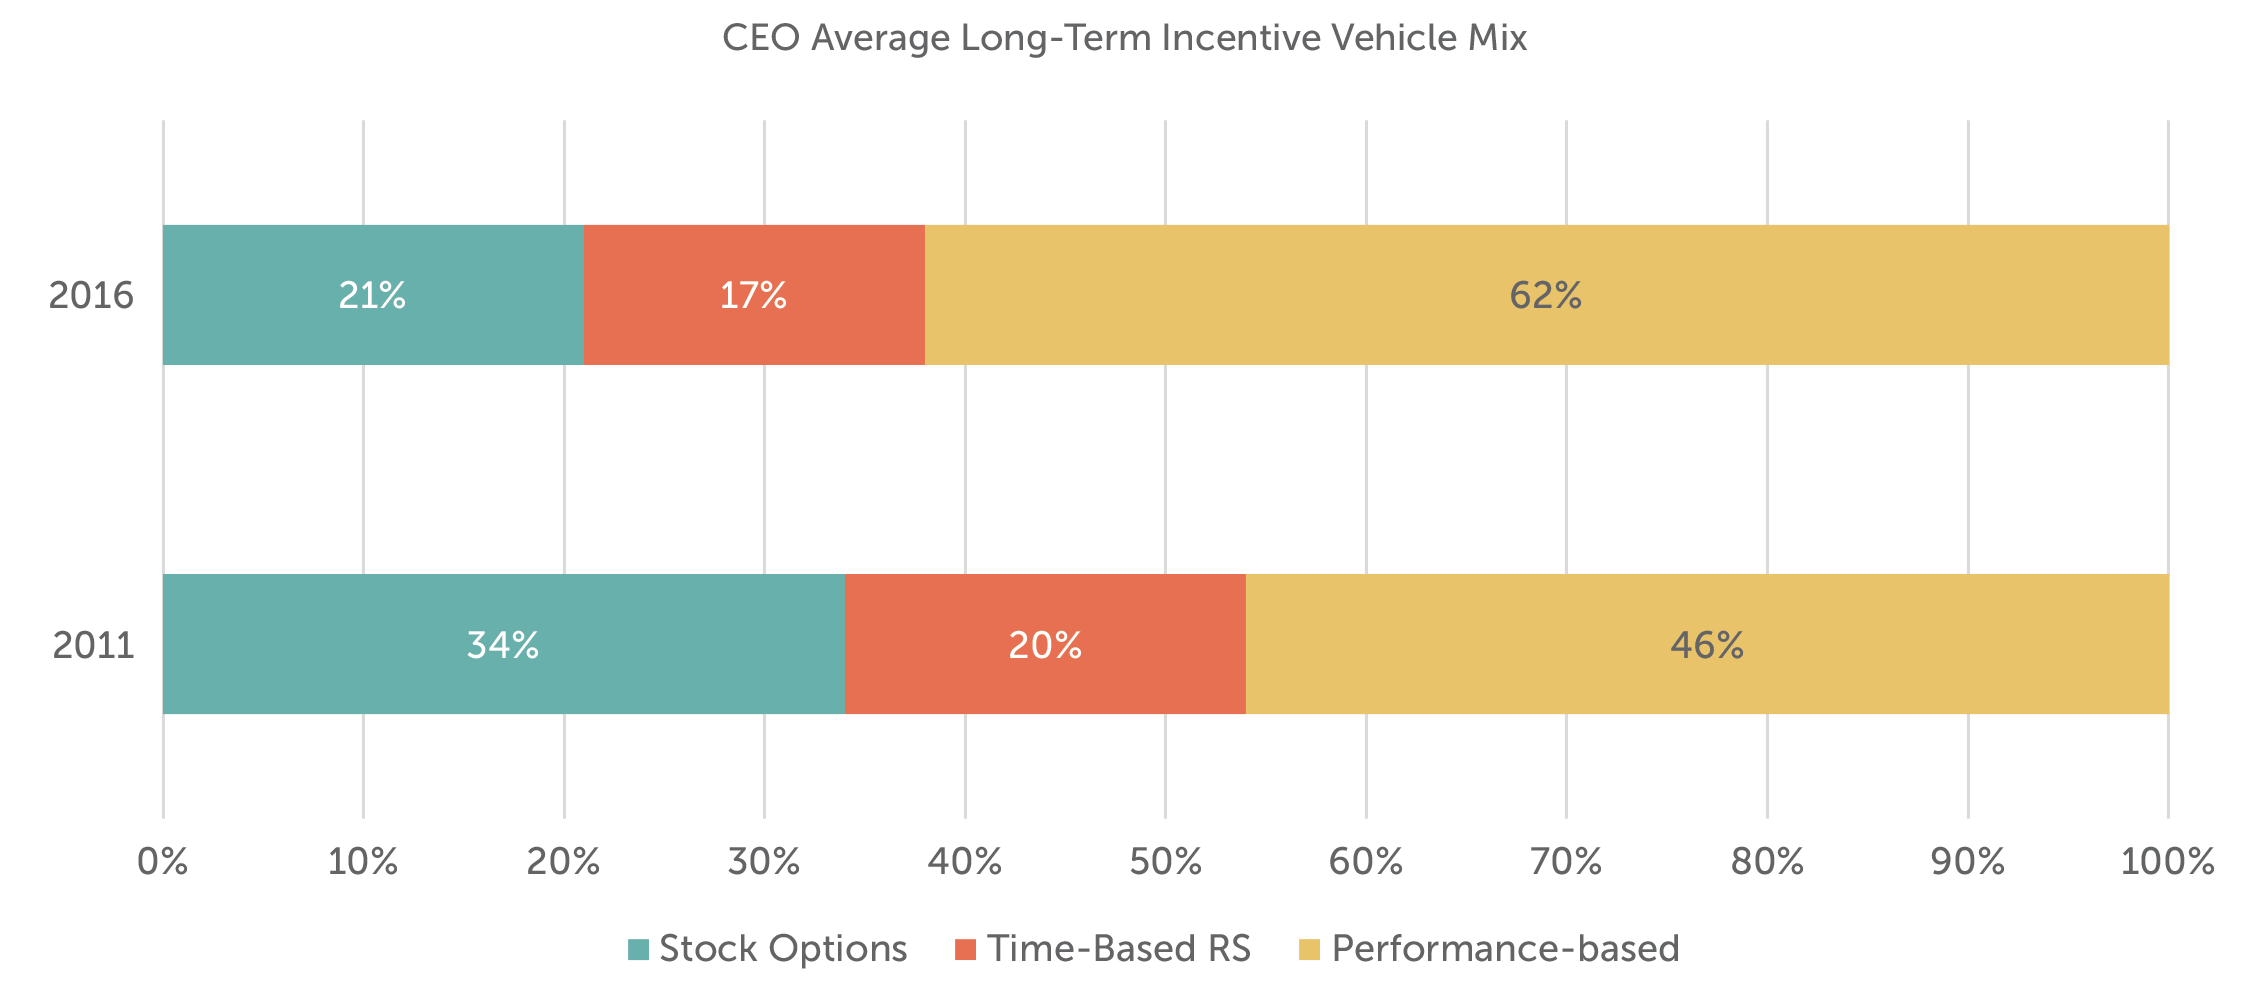
Since 2011, there has been a significant shift away from the use of stock options and time-based RS/RSUs, towards performance-based awards in the overall CEO LTI award mix.
Restricted Stock / Units (RS/RSU)
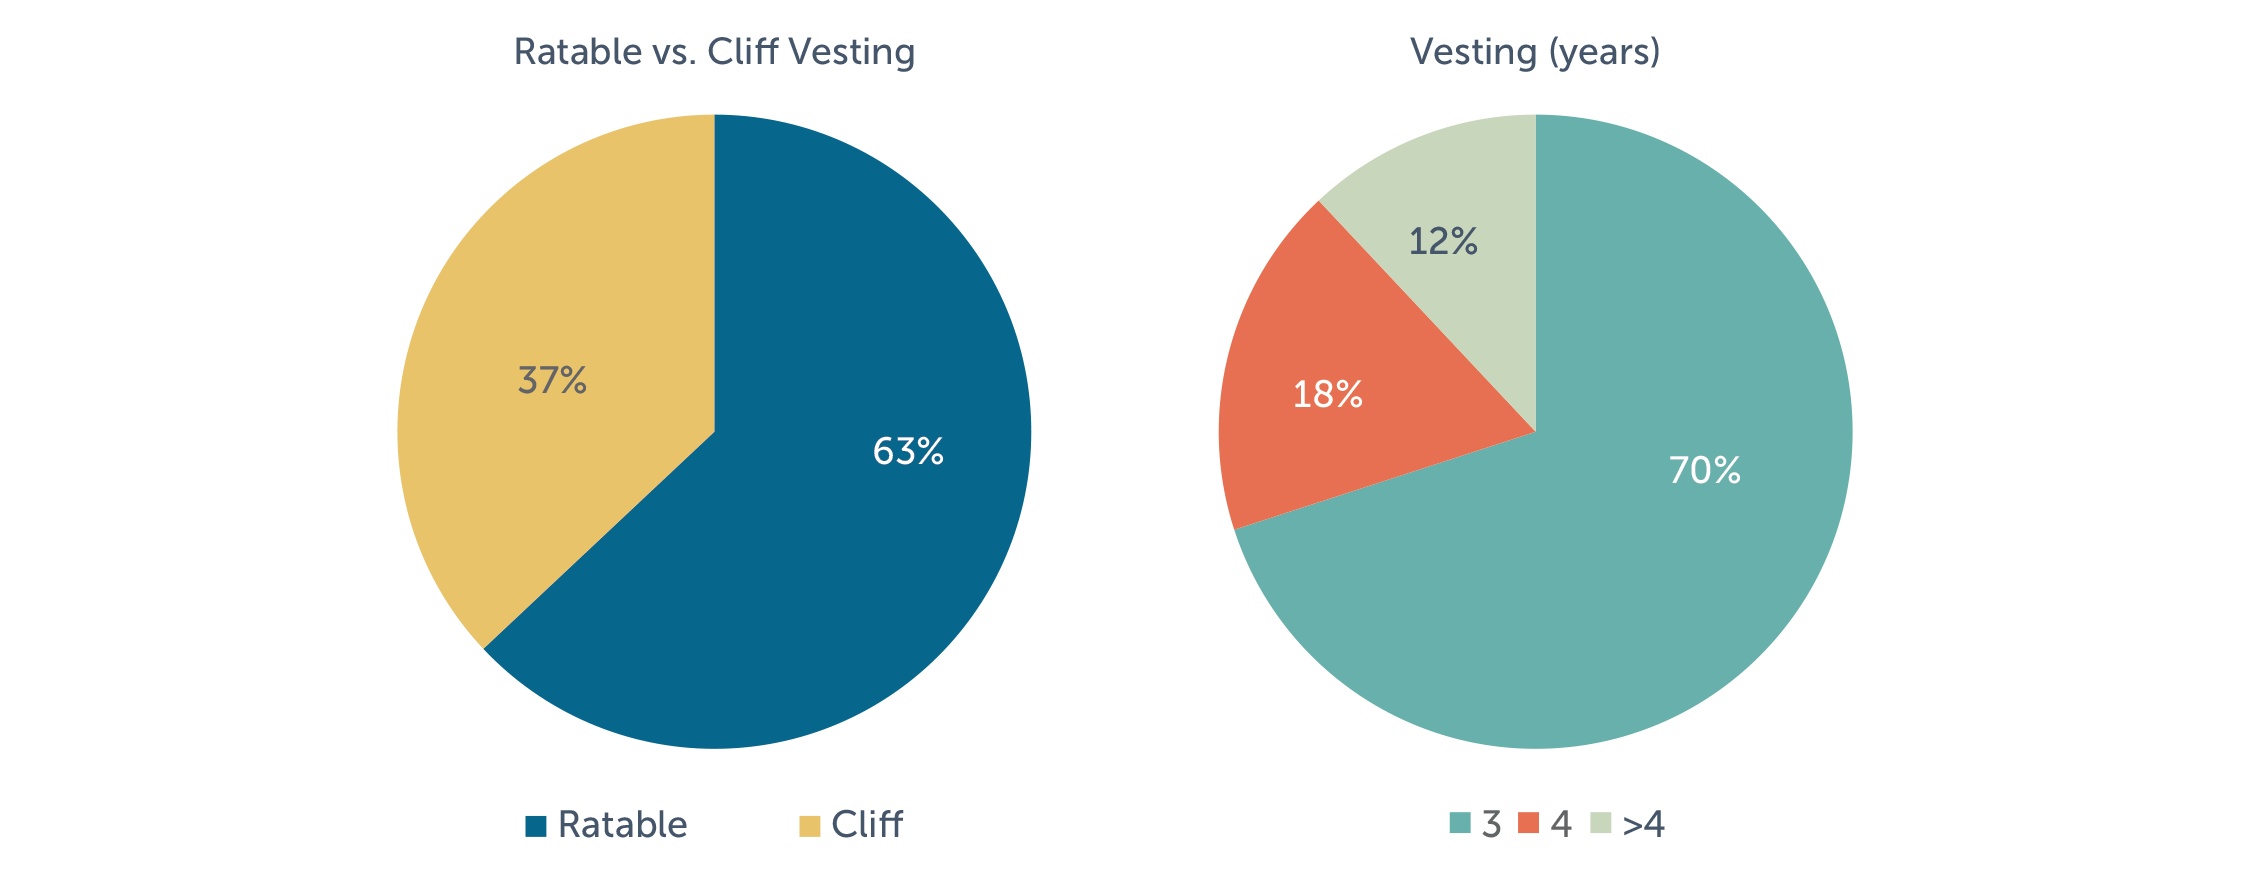
The majority of companies use ratable vesting over a period of three years for time-based RS/RSU awards. 30% of companies use a vesting schedule of four years or more.
| Ratable Vesting | Cliff Vesting | Vesting (years) | ||
| 3 | 4 | >4 | ||
| 63% | 37% | 70% | 18% | 12% |
Stock Options
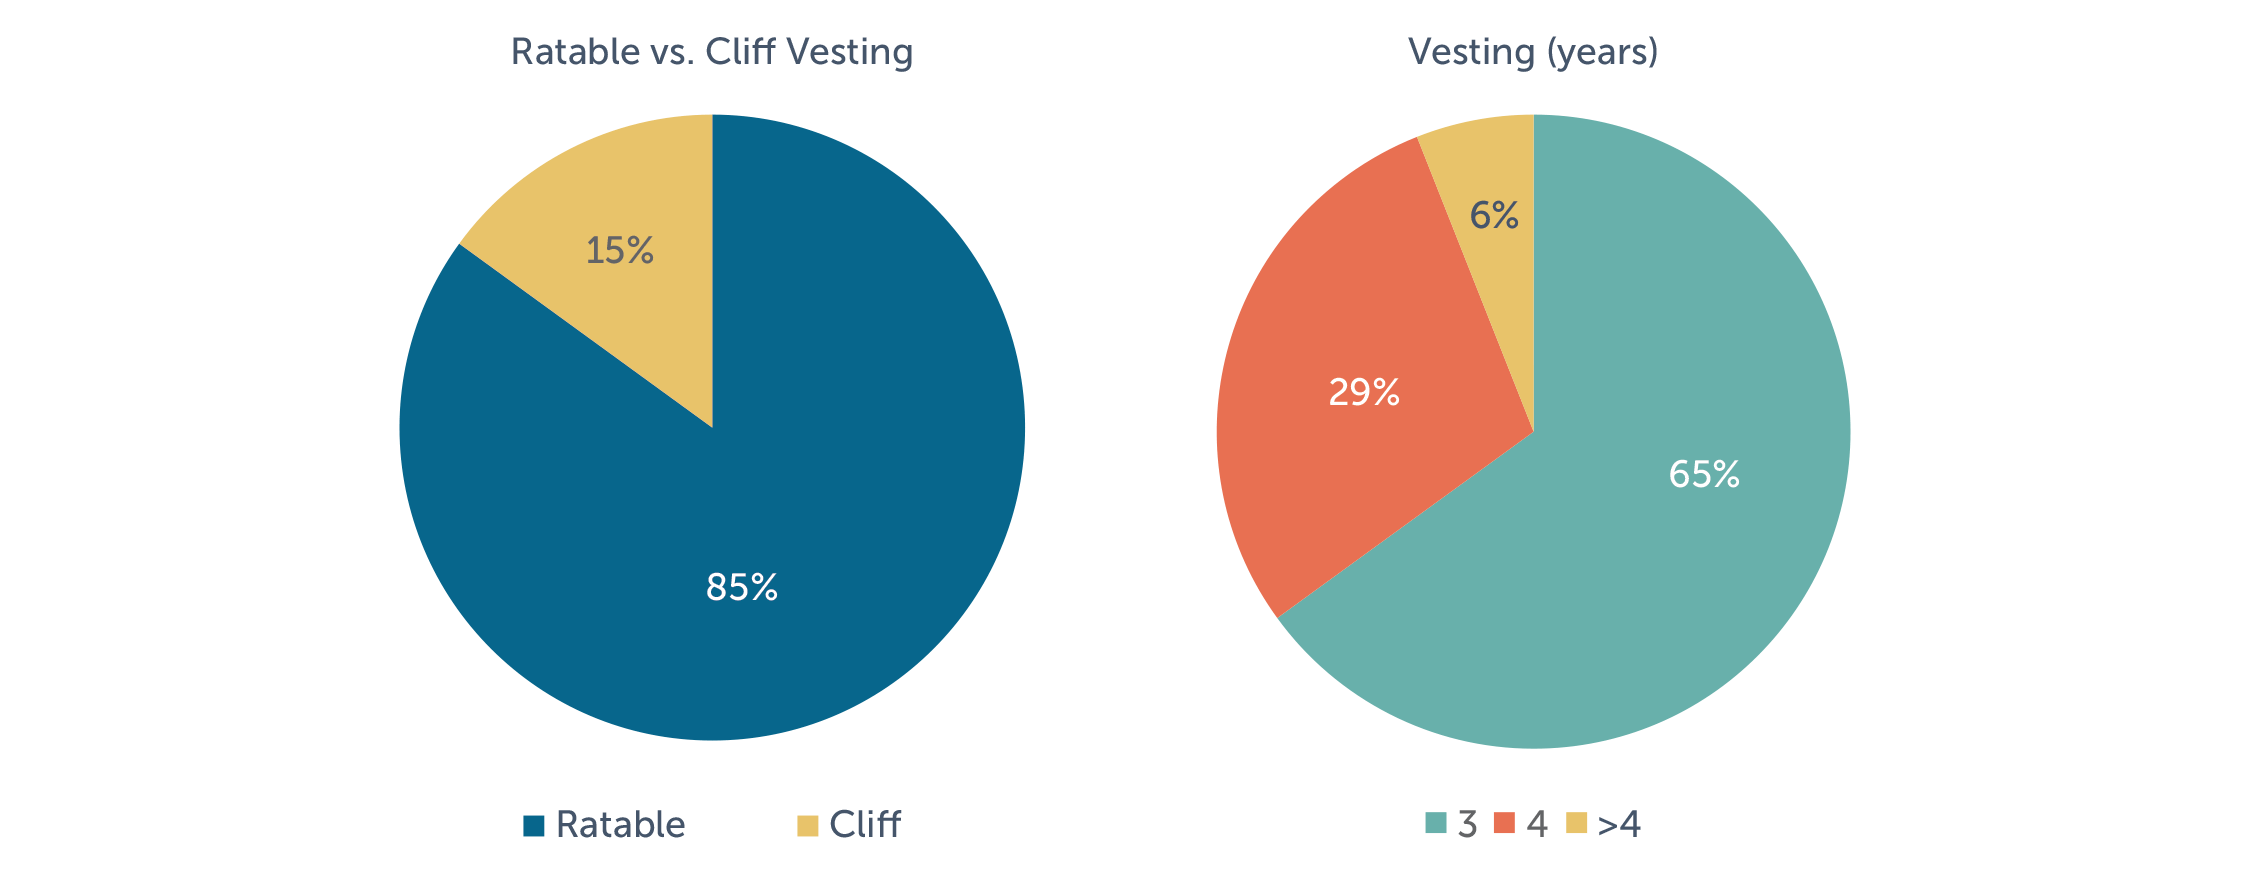
The majority of companies use a three-year ratable vesting schedule for stock options. An option term of ten years is most common.
| Option
Term |
Ratable Vesting | Cliff Vesting | Performance Vested | Vesting (years) | ||
| 3 | 4 | >4 | ||||
| 90% 10 yrs. | 85% | 15% | 1% | 65% | 29% | 6% |
Performance Based Awards
Among companies that grant performance-based awards with downside leverage, 97% of companies define the threshold payout as 50% of target or less. At maximum, the most common payout opportunity is 200% of target with only 3% of companies providing payout opportunities greater than 200%.
|
|
||||||||||||||||||||||||
Performance Metrics
Among companies in our study, Total Shareholder Return (TSR) is the most prevalent performance metric in long-term performance plans (used by 56% of companies with an LTIP). Most companies (87%) that use TSR as a performance metric measure TSR on a relative basis, while only a few companies (13%) measure TSR on an absolute basis versus pre-established goals. In general, TSR is viewed as a shareholder friendly design feature. It also provides a credible way for companies to measure multi-year success, while avoiding challenges with setting multi-year financial or operational goals.
TSR does have short-comings though. It is an outcome of business strategy, rather than a driver of longer term company success. Relative TSR can also be heavily influenced by a company’s position in the cycle. For example, a period of lower performance can be followed by a sharp upswing or vice versa. However, most companies (91%) that use TSR as a metric use it with another metric—most commonly, a return metric or EPS. Further, among companies that use TSR, 32% use it as a modifier only.
Return measures are the second most prevalent (47% of companies) type of performance metric, followed by EPS (29%) and Revenue (24%). Companies use these metrics – often in combination – in long-term performance plans to support operational efficiency and/or profitable growth.
When selecting specific performance metrics and adjustments, if any – companies should consider metrics that support long-term value creation in their industry. For example, many companies in the Technology and Pharmaceutical industries use TSR as a metric. Companies in these industries want to motivate executives to drive success through the development of new products. As successes in new product development impact a company’s stock price before impacting its financial statements, TSR is a good indicator of future growth and profitability and aligns executives’ interests with those of shareholders.
Companies tend to use multiple metrics to create balance in their performance plans.

Performance Measurement – Absolute Vs. Relative
Among the companies in our study, 51% use a combination of absolute and relative performance goals in their long-term performance plans, up from 48% in the prior year. This approach motivates executives to achieve the company’s internal financial goals, while also balancing results relative to comparable companies. When goals are relative, goal setting is also, typically, substantially simplified.
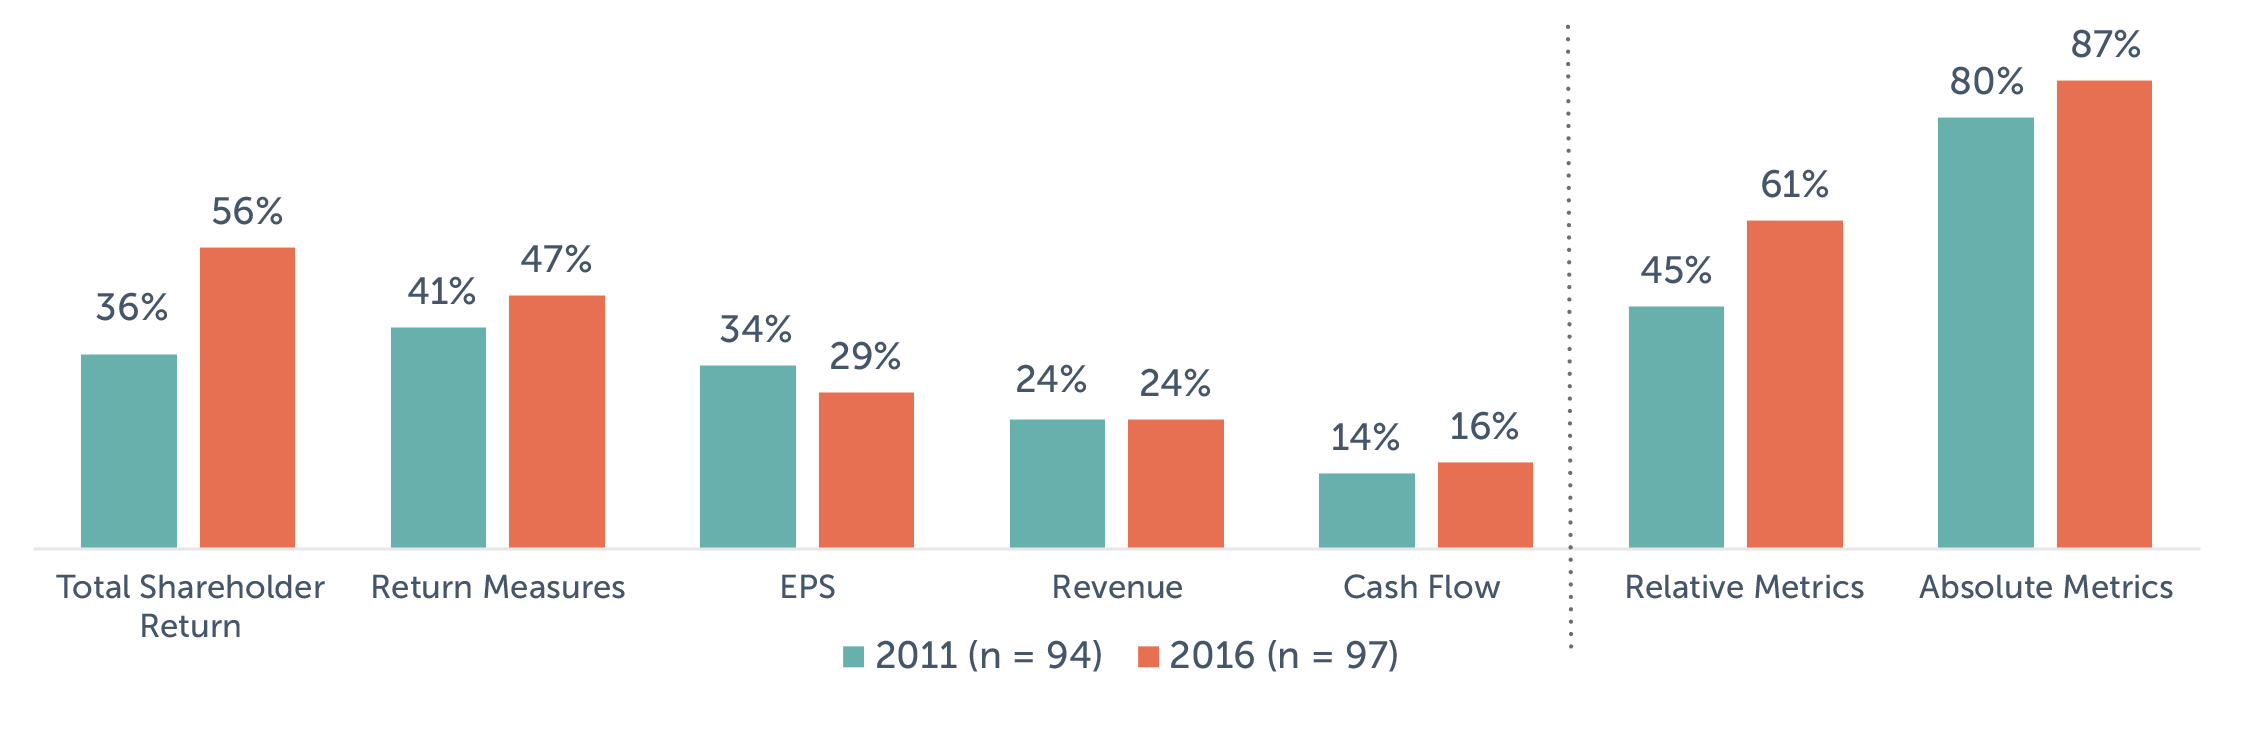
Note: Percentages add to greater than 100% due to multiple responses. Return measures reflect ROE, ROI, ROIC, and ROA.
Performance Measurement Period
Among companies that use a long-term performance plan (stock/units or cash), 96% have at least one plan with a three-year performance measurement period. Only two companies have a plan with a longer measurement period.
Perquisites:
The percentage of companies in our research providing perquisites to their CEO increased from 82% in 2013 to 87% in 2016. The percentage of companies providing perquisites to CFOs was 73% in 2016.
In 2016, the four most common CEO perquisites were: personal use of corporate aircraft (58%), personal security (30%), automobile allowance (30%) and financial planning (27%).
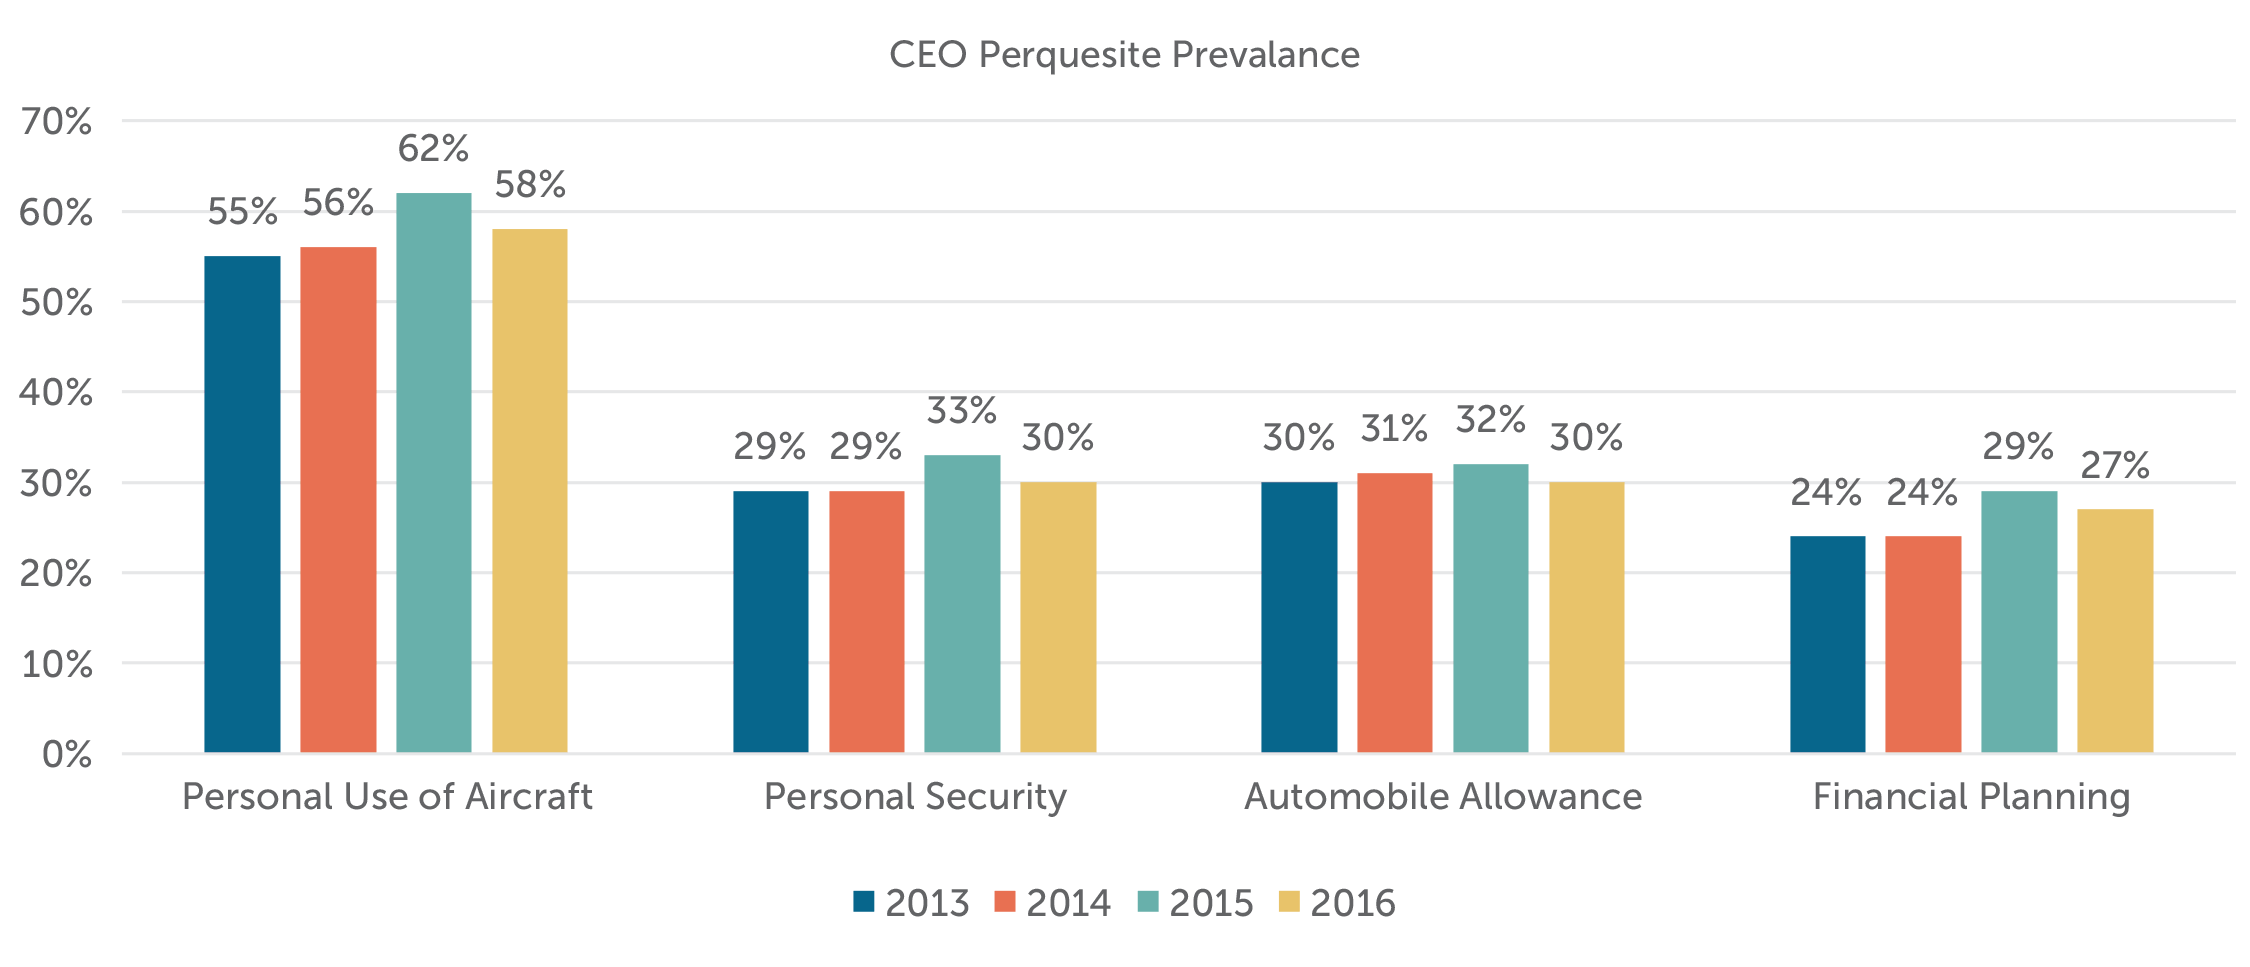
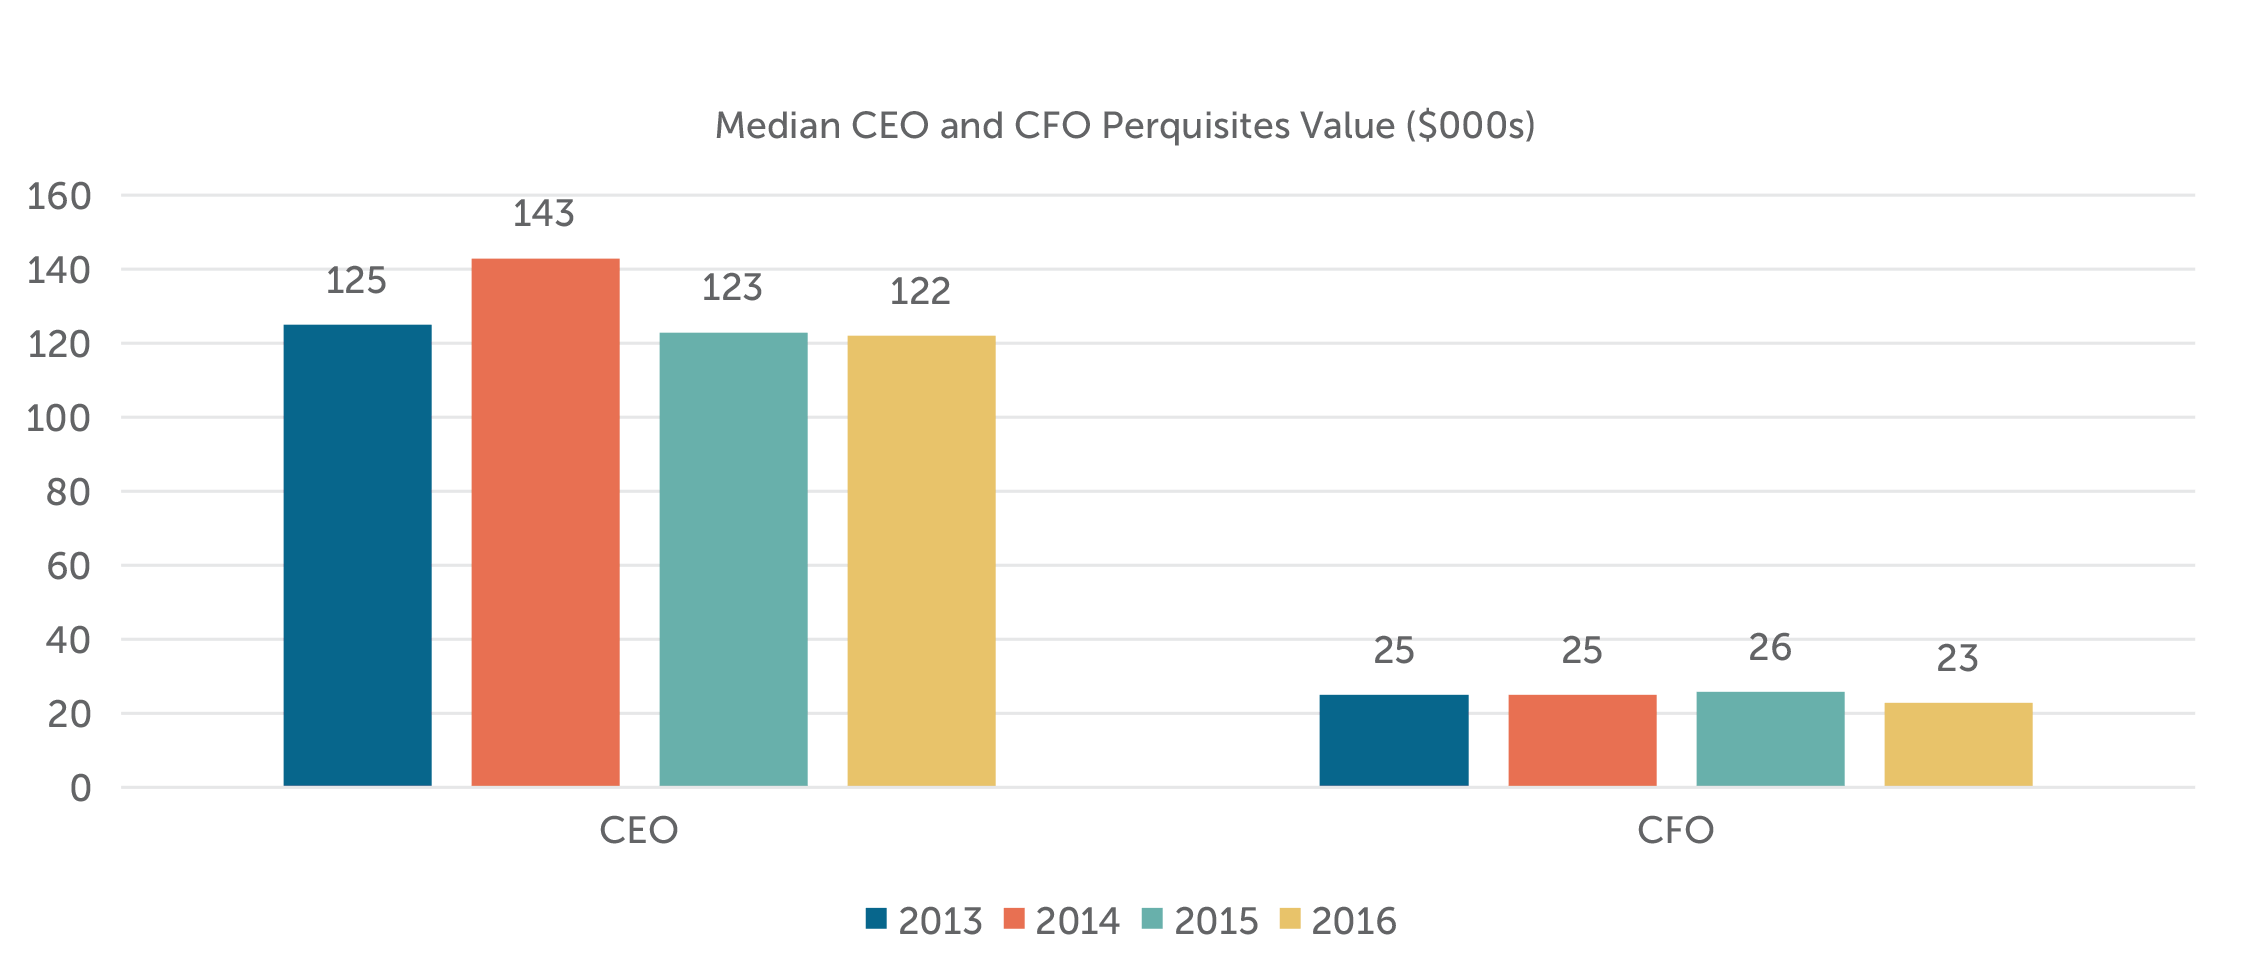
The median total value of CEO perquisites in 2016 remained steady vs. 2015 at ~$122,000. This value has ranged from $122,000 to $143,000 over the last four years. For CFOs, the median value of perquisites has also been relatively flat year-over-year and has ranged from $23,000 to $26,000 since 2013.
Shareholder Friendly Provisions:
Stock ownership guidelines (SOG), hedging, pledging, and clawback policies have become very common for publicly traded companies. Companies are encouraged to implement these polices by pending legislation/rules, proxy advisory firms, and by shareholders.
| Stock Ownership Guideline | Hedging | Pledging | Clawback |
| 96% | 97% | 82% | 98% |
In addition to stock ownership guidelines, many companies, particularly larger companies, have instituted stock holding policies. Among companies with stock ownership guidelines, 55% have a holding policy associated with the SOG. Among these companies, 89% require holding until the stock ownership guideline is met. Independent of stock ownership guidelines, 33% of companies have instituted a “stand-alone” holding requirement.
| Holding Policy in Relation to SOG | If there is a holding policy in relation to SOG | Holding requirement, independent of SOG | ||
| Until Guideline Met | After Guideline met | |||
| 55% | 89% | 32% | 33% | |
For questions or more information, please contact:
Melissa Burek Partner [email protected] 212-921-9354
Margaret Engel Partner [email protected] 212-921-9353
Michael Keebaugh Associate [email protected] 646-532-5931
Michael Bonner Associate [email protected] 646-486-9744
Michael Biagi Associate [email protected] 646-486-9743
Ryan Colucci provided research assistance for this report.
Compensation Advisory Partners (CAP) provides an annual update on pay levels for Chief Financial Officers (CFOs) and Chief Executive Officers (CEOs). This year’s update is based on a sample of 118 companies with median revenue of $12 billion. Additional information on criteria used to develop the sample of companies is included in the Appendix.
Highlights 2016 vs 2015
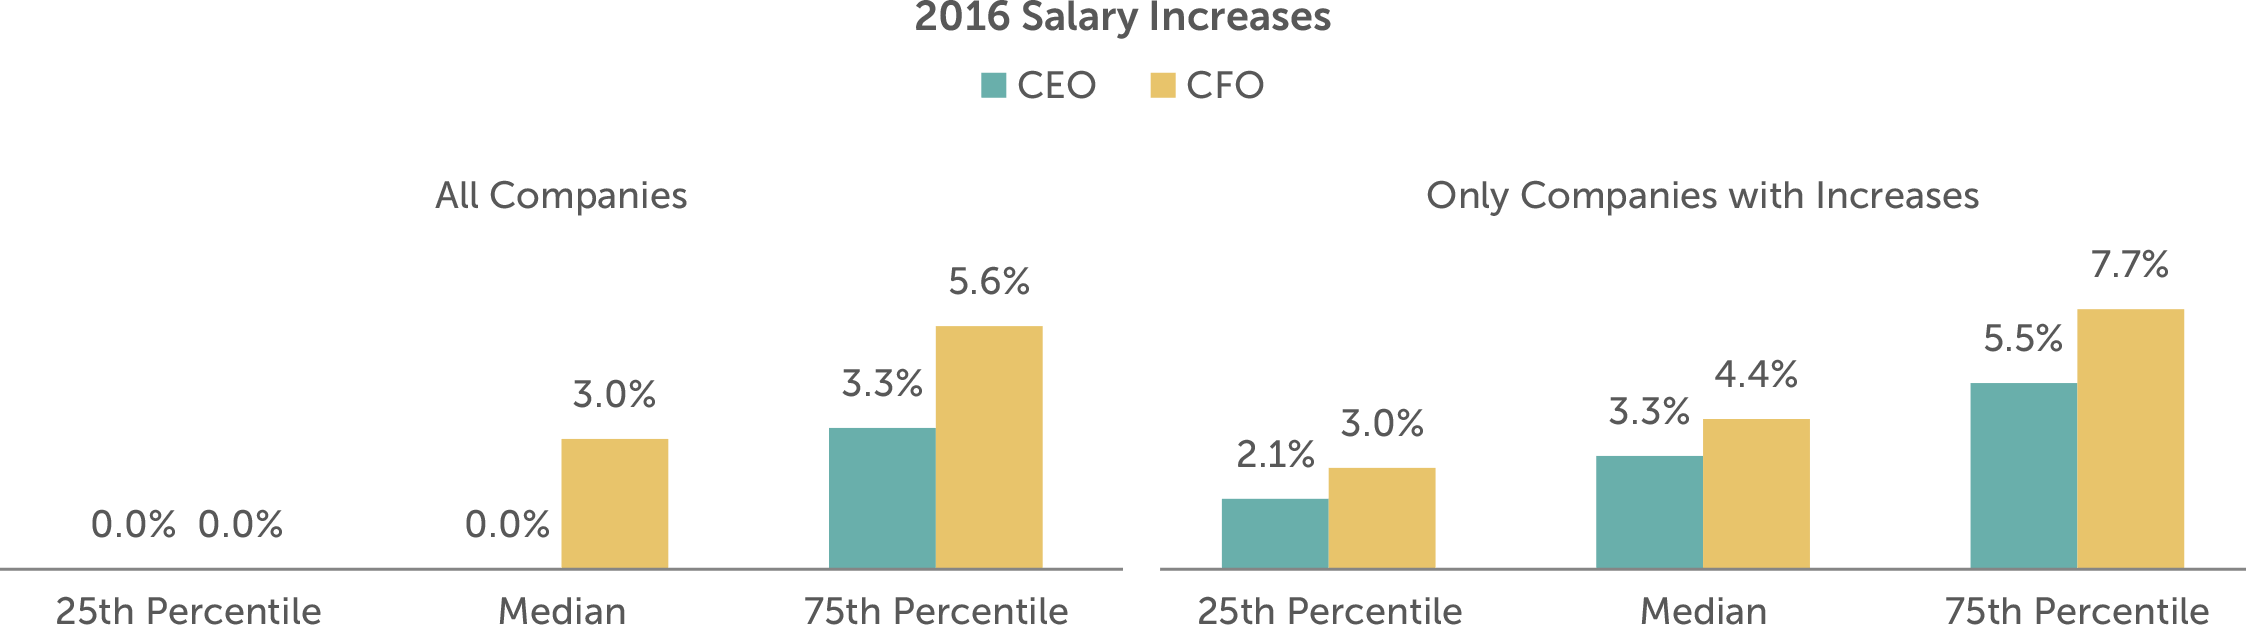
- Adjustments to base salaries were less frequent in 2016 than in the past 3 years for CEOs and CFOs. Less than 50% of companies made increases in 2016 for CEOs, resulting in a median increase of 0%, while 70% of CFOs received an increase, with median increase of 3.0%
- Among the companies that made salary increases, the median CEO and CFO 2016 increase was 3.3% and 4.4%, respectively, and these increases were lower compared to the increases in our 2015 study (3.8% and 5.1% respectively)
- The 2016 median increases in actual total direct compensation (i.e., cash plus equity) for both CEOs and CFOs were 5.4% and 3.9%, respectively
- Median actual bonus increases were up modestly, 1.5% for CEOs and 1.1% for CFOs, reflective of modest performance improvement (revenue and net income growth) in 2016
- Median target bonus opportunities remained unchanged for both CEOs (150% of salary) and CFOs (100% of salary), with CEO target bonus unchanged for the fourth year of our study
- Growth in long-term incentive opportunities at median approximated 4% for both positions
- CFO total compensation continues to approximate one-third of CEO total pay
- The emphasis of variable pay over fixed pay, and performance-based equity over time-based equity, continues
Study Results
Salaries
In the past, we have seen a steady growth in the number of CEOs and CFOs receiving salary increases in each year. However, for the 2015-2016 period the salary increase prevalence of 49% for CEOs and 71% for CFOs was lower than more recent years and comparable to the 2012-2013 period where only 48% and 69% of CEOs and CFOs, respectively, received increases. Median 2016 salary increases were 3.0% for CFOs and 0% for CEOs.
|
% of Executives Receiving Salary Increases |
||||
|
|
2014 – 2015 |
2015 – 2016 |
||
|
Position |
No Increase |
Receiving Increase |
No Increase |
Receiving Increase |
|
CEO |
42% |
58% |
51% |
49% |
|
CFO |
23% |
77% |
29% |
71% |
Actual Pay Levels
As shown in the table below, salary increases were higher for CFOs since most CEOs did not receive an increase. Yet, the median increases in actual bonus and long-term incentives remained similar for both CFOs and CEOs.
The median rate of increase in actual total direct compensation levels for CEOs and CFOs was 5.4% and 3.9% in 2016, respectively. We also found that in 60% of companies CFOs were receiving higher increases (6.2% at median) than CEOs. However, in the 40% of companies where CEO increases were higher, the median increase approximated 1.5x the CFO increase, contributing to the slightly higher increase in actual total direct compensation for CEOs.
|
Median Percentage Change in Pay Components |
||||
|
Pay Components |
2014 – 2015 |
2015 – 2016 |
||
|
CEO |
CFO |
CEO |
CFO |
|
|
Salary |
2.5% |
3.9% |
0.0% |
3.0% |
|
Actual Bonus |
0.0% |
-0.1% |
1.5% |
1.1% |
|
Long-Term Incentives |
6.8% |
7.6% |
3.8% |
4.1% |
|
Actual Total Direct Compensation |
2.2% |
1.4% |
5.4% |
3.9% |
Similar to actual bonuses, median target bonuses remained flat for both CFOs and CEOs.
|
Target Bonus as % of Salary |
||||
|
Summary Statistics |
2015 |
2016 |
||
|
CEO |
CFO |
CEO |
CFO |
|
|
25th Percentile |
130% |
80% |
138% |
85% |
|
Median |
150% |
100% |
150% |
100% |
|
75th Percentile |
180% |
120% |
190% |
120% |
Median Pay Increase by Industry1
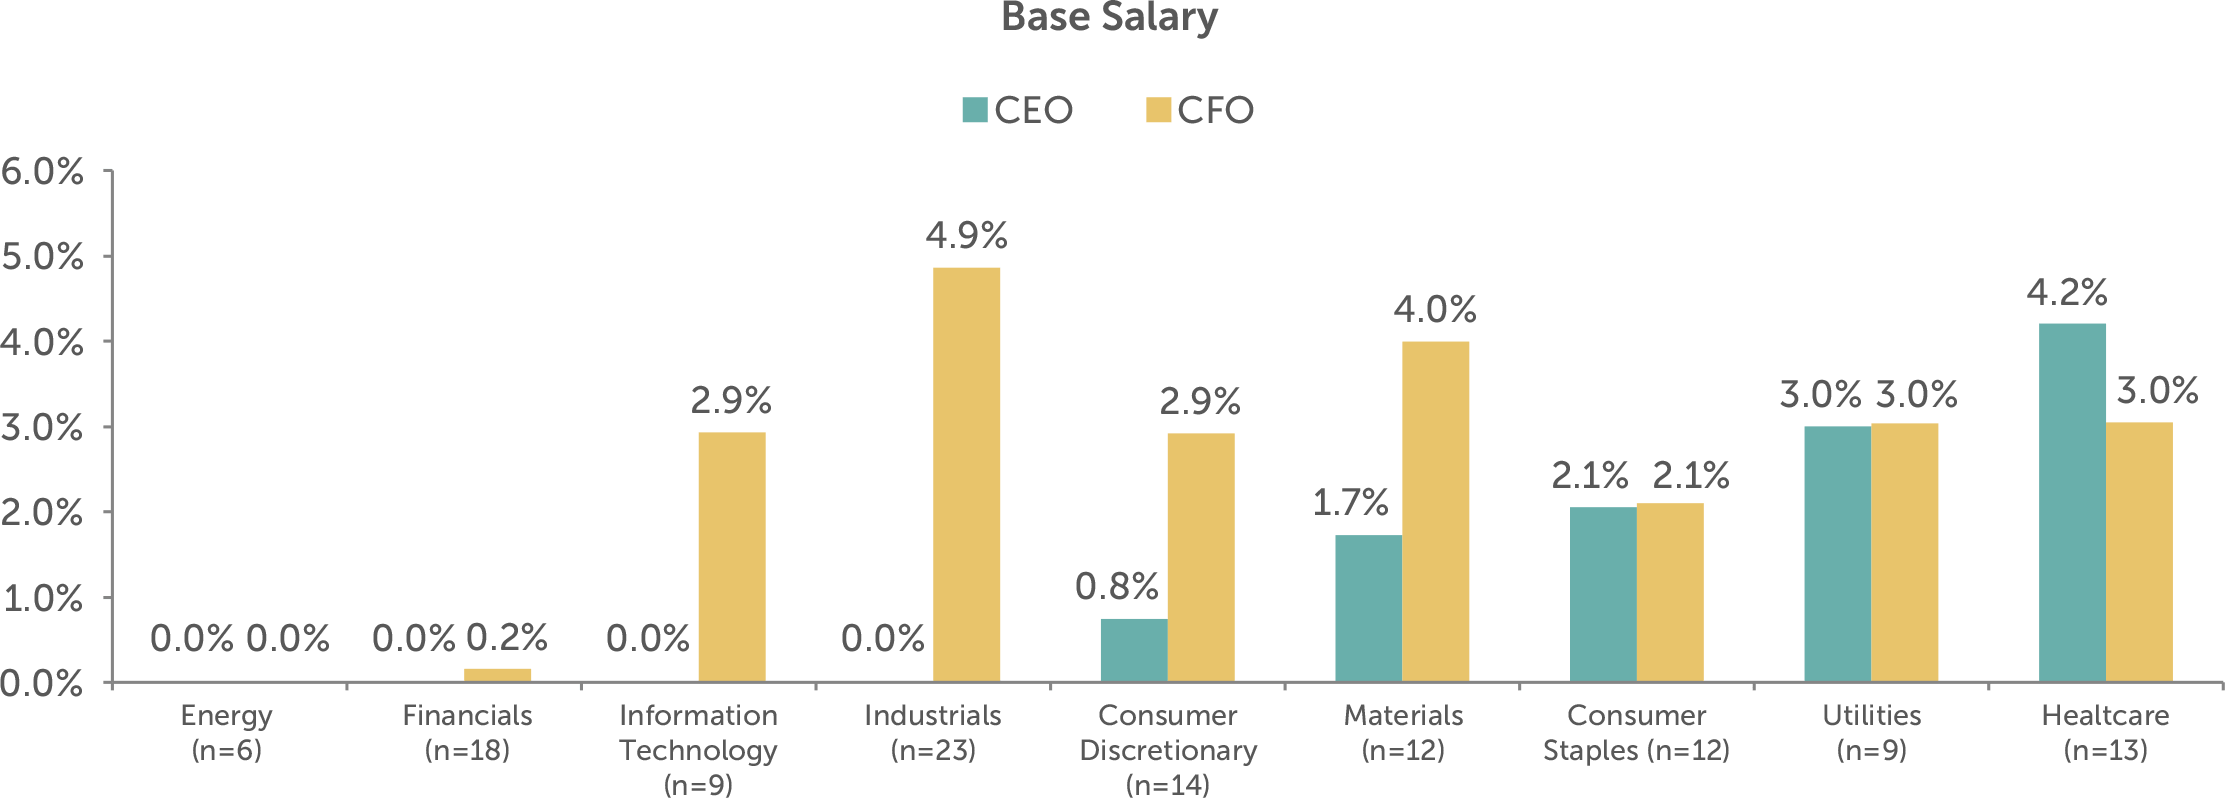
Median salary increases were generally aligned between CEOs and CFOs in 5 of 9 industries. There were some differences in the Consumer Discretionary, Industrials, Information Technology, and Materials industries. The biggest difference was in the Industrials industry where the median CEO increase was 0% compared to the CFO median increase of 4.9%. In the Industrials industry, only 10 of 23 CEOs received a salary increase with a median of 3.2%, compared with 19 of 23 CFOs received salary increases with a median of 6.3%. The Energy industry increases were 0% for both CFOs and CEOs for the second year in a row as the industry continues to face challenges with low oil prices.
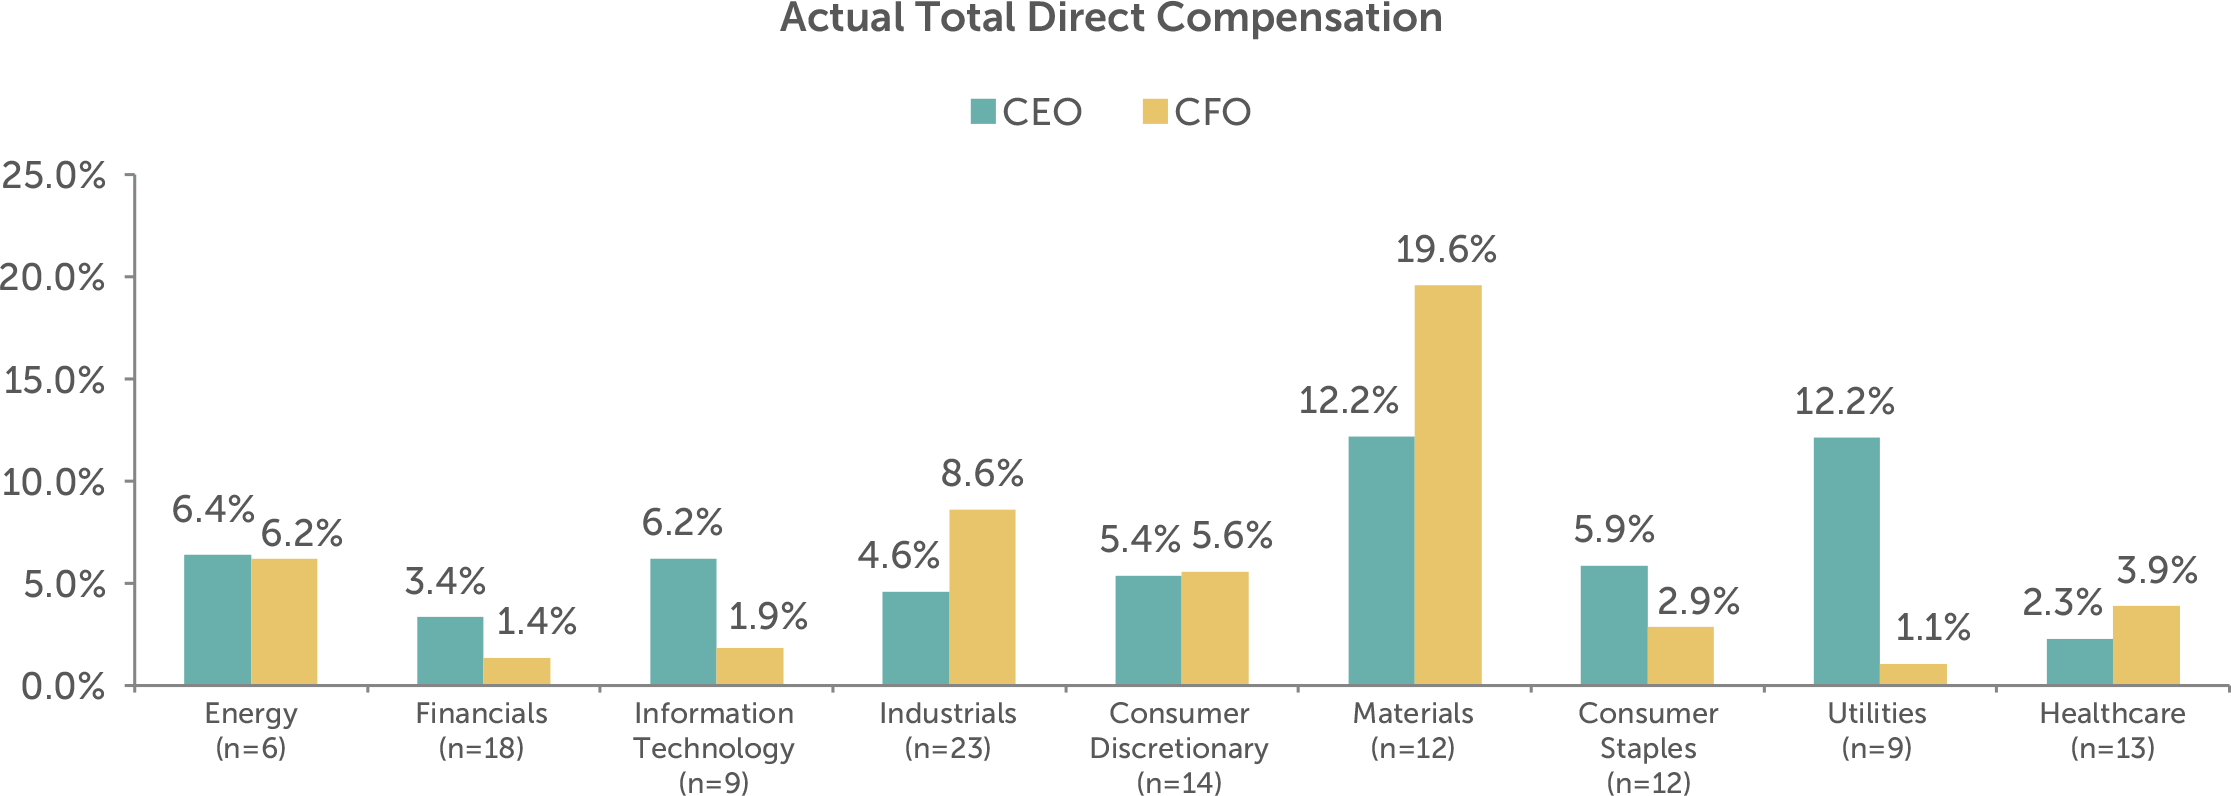
Differences by industry were slightly more pronounced when looking at actual total direct compensation, with the biggest difference in the Utilities industry where the median increase was 12.2% for CEOs and 1.1% for CFOs. Given a sample of 9 companies, the median results are skewed by two companies that had very different increases for each position. Excluding these outliers creates a narrower difference (approximately 3%) between median CEO and CFO increases. None of the industries saw a decrease in total compensation at median.
Target Pay Mix
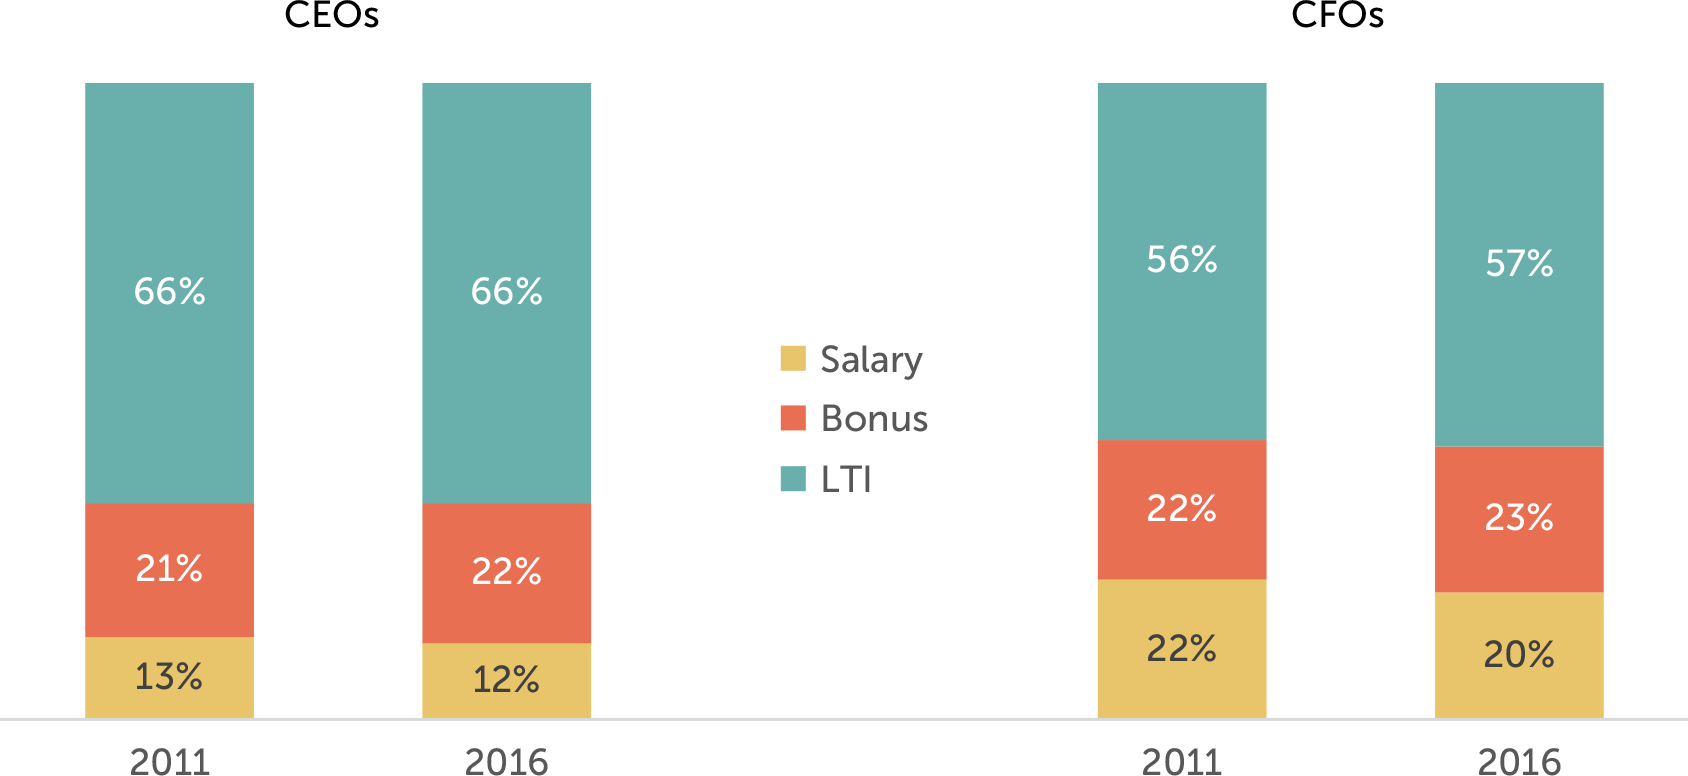
The structure of the overall pay program (salary, bonus, LTI) has remained largely unchanged since 2011. CEOs continue to receive less in the form of salary and more in variable pay opportunities, especially LTI, than CFOs.
Long-Term Incentive (LTI) Vehicle Prevalence and Mix
There was very little change in the type of vehicles used to deliver LTI awards in 2016 vs. 2015. Most companies continue to use two different vehicles to deliver LTI, with approximately 20% of companies studied using all 3 equity vehicles (stock options, time-based stock awards, and performance plan awards).
Performance plans account for roughly 50+% of LTI awards on average among companies studied. The other half of LTI is delivered through an almost equal mix of stock options and time-vested restricted stock awards.
The most notable change since 2011 has been a general shift from stock options to performance plans.
|
LTI Mix |
||||||
|
|
2011 |
2015 |
2016 |
|||
|
LTI Vehicles |
CEO |
CFO |
CEO |
CFO |
CEO |
CFO |
|
Stock Options |
32% |
32% |
24% |
23% |
23% |
22% |
|
Time Vested Restricted Stock |
17% |
22% |
20% |
25% |
20% |
24% |
|
Performance Plans |
51% |
46% |
56% |
52% |
57% |
54% |
Conclusion
2016 performance overall, was generally flat compared to last year. Median revenue growth was 1% (vs -1% in 2015) and net income growth was 0% (vs -1% in 2015). Total shareholder return was much higher in 2016 and most of the growth was post the election results; the full year return was 16% (vs -2% in 2015). Yet total pay increases were slightly higher than in 2015, which we believe were directionally aligned with the small performance improvements.
We expect the overall executive pay mix to continue to emphasize the variable, at-risk components of pay (such as bonuses and LTI). We also expect the emphasis on performance-based LTI plans to remain similar to current practice. Given increased shareholder scrutiny and influence of Say on Pay, we anticipate that aligning pay outcomes with company performance is the imperative for all companies and Boards.
Appendix
Sample Screening Methodology
Based on the screening criteria below, we arrived at a sample of 118 public companies with median 2016 revenue of $12B.
|
Revenue |
At least $5B in revenue for fiscal year 2016 |
|
Fiscal year-end |
Fiscal year-end between 9/1/2016 and 12/31/2016 |
|
Proxy Statement Filing Date |
Proxy statement filed before 3/31/2017 |
|
Tenure |
No change in CEO and CFO incumbents in the past three years |
|
Industry |
All industries have been considered for this analysis |
1 Excludes one company in the Telecommunications Services industry and one in the Real Estate industry.
On a panel of leading executive compensation experts, Margaret Engel discusses some of the top executive compensation issues and trends including: the current public mistrust of executive compensation programs, the importance and the rigorous process of target goal setting, the challenges that many companies face with long-term performance awards, and the likely increase in the use of performance-based stock options in the future.
In the last few weeks, we’ve seen mainstream media highlight the competition for talent at tax-exempt organizations. The Wall Street Journal reported that CEO pay at tax-exempt organizations increased in aggregate by a third from 2011 levels. While this increase can be explained in part by the economic rebound of these organizations since the Great Financial Recession, there are larger factors at work.
Complexity and organization size, two main drivers of executive compensation in the for-profit world, apply to tax-exempt organizations as well. From a complexity standpoint, tax-exempt CEOs must simultaneously attend to multiple priorities and constituents. They have a tough balancing act managing multiple stakeholders’ interests to achieve the organization’s mission. This visible position must serve his or her community, court donors, navigate the political landscape, handle the press, and fiscally steward the organization. In contrast, Fortune 500 CEOs’ primary focus is to satisfy shareholders’ financial expectations (with other demands being subordinate). Further, the number of executives with the experience of successfully leading significantly-sized tax exempt organizations is limited. As a result, the talent pool is small, and the demand for them is fierce. For example, the Los Angeles Times just reported that the storied but financially struggling New York Philharmonic hired Deborah Borda as its new CEO with the expectation that she can sprinkle on it the “same magic” she did during her tenure at the Los Angeles Philharmonic.
The structure of compensation reflects this intense demand for talent, as well as the strategic planning and economics of these tax-exempt organizations. The typical tax-exempt CEO receives a base salary and a bonus opportunity, which is prevalent in three-quarters of such organizations according to Vivient Consulting’s survey. Some organizations also provide longer-term financial arrangements that serve as a retention hook and provide financial security in retirement. Most large tax-exempt organizations have multi-year strategic objectives (such as passing important legislation, multi-year capital campaigns, etc.) and want to focus their top executive on the extended time horizon required to create lasting legacies. However, unlike for-profit companies, there is no equity compensation available. As a result, long-term incentives need to be designed to reflect both mission and fiscal success, incorporating qualitative and qualitative measures that support these organization’s values and mission.
From a governance standpoint, we find that CEO pay at larger tax-exempt organizations is governed in an independent and structured process that mirrors that of for-profit companies. In our experience, independent Boards of Directors spend a significant amount of time and attention to the reasonableness, fairness, and pay-for-performance (defined more broadly to include the achievement of the organization’s mission) of CEO compensation. This is not surprising as sophisticated businessmen and women who sit on these organizations’ boards of directors bring their independence and expertise to the pay discussion. Further, the boards are careful to maintain good governance process over CEO pay decisions in order to maintain the “rebuttable presumption of reasonableness” and avoid IRS intermediate sanctions.
With increased demand for talent, we see more cross-over of executives and compensation practices between tax-exempt and for-profit organizations. Thoughtful compensation practices and programs grounded to the organization’s mission and economics can help retain and motivate these uniquely skilled executives.