Proposed amendments to Item 402 of Regulation S-K outline additional disclosure requirements designed to implement Section 14(i) of the Securities Exchange Act of 1934 (the “Exchange Act”), as added by Section 953(a) of the Dodd-Frank Wall Street Reform and Consumer Protection Act (“Dodd-Frank”).
Today’s forward-thinking companies strategically use non-qualified deferred compensation plans as a way to pay top executives for performance. Almost 70% of CEO pay is delivered through annual and long-term incentives, according to the Conference Board. With such high value opportunities, many executives are seeking tax-efficient programs.
One solution is to use deferred compensation plans, which have several benefits. First, participants can defer the timing of receipt and therefore taxation of the incentive awards. Second, the incentive awards can accrue returns on a compounded tax-deferred basis until distribution. It’s no wonder that high net-worth executives find deferred compensation plans attractive.
There are many ways deferred compensation plans can be created to mimic bonus or long-term incentive plans. Performance features can be incorporated into the Company contribution, vesting, and crediting rate. For instance:
- Contributions to executives’ accounts can be based on either attaining specific performance goals, service requirements, or a combination of both
- Vesting of company contributions can be based on attaining specific performance goals
- Crediting rate can track company stock performance
One example is a retail client that underwent a spin-off and sought to motivate and retain its store managers. The Company wanted to offer a long-term incentive plan that had performance requirements and a retention hook. The Company implemented a two-pronged approach: 1) a retention bonus based on store performance and 2) a grant of phantom stock based on the enterprise-wide value.
- For the retention bonus, the Company contributed to each store manager’s deferred compensation account a percentage of the cumulative net cash flow of his/her store at the end of five years
- For the phantom stock plan, each store manager received a grant of phantom stock that tracked the value of the Company over time
- Upon termination, the value of the deferred compensation account and the phantom stock were distributed to the store manager based on his/her election preferences (at termination or at a future date).
In situations where equity-like incentives are desired, deferred compensation plans are an elegant way to provide such incentives without using real equity. For instance, privately held companies, publicly traded companies that need to conserve shares, or subsidiaries that wish to tie their executives to subsidiary value use can use deferred compensation as a way to provide phantom equity to their executives in a tax-efficient manner.
Deferred compensation plans have drawbacks, though. Deferred amounts (employee and company contributions) are subject to creditor claims in the event of company bankruptcy. Design and administration of such plans are subject to various regulations, including IRS Code Section 409A. Each company should evaluate the drawbacks and weigh them against the tax-efficiency and design features that make deferred compensation plans attractive.
Increasingly we find that private companies are adopting public company governance practices such as using formal Compensation Committees consisting of internal or external Board members.
Unlike publicly traded companies where a Board Compensation Committee is a requirement, private companies establish formal Compensation Committees for reasons such as the desire for:
- A more defined and objective process. This is welcome in delicate situations such as where there are conflicting shareholder interests that need to be aligned, or there is a perception that management has undue influence on setting their own pay levels.
- Additional Board-level attention and/or external compensation expertise. This may be necessary when companies establish new key executive compensation plans or need to have one point of contact to negotiate employment contracts with key executives.
A Compensation Committee is able to take a “deep-dive” into specific compensation issues in a manner that would be more difficult and/or impractical with an entire Board.
Below we outline the key aspects of well-run Compensation Committees:
Purpose: Typically, the Compensation Committee’s purpose is to carry out the responsibilities delegated by the Board relating to the review and determination of the performance and compensation of the Chief Executive Officer and the executive team. Each company’s Board needs to decide whether the Compensation Committee itself has the authority to approve compensation decisions, or makes its recommendation for Board approval.
Membership: Compensation Committees are usually comprised of a small select number of members, which can be a sub-set of the Board of Directors and can be supplemented by independent outside advisors, if desired. As an example, one of our private company clients has a Compensation Committee which consists of internal Board members supplemented by an external compensation consultant and a long-time outside advisor. Ideally, the Compensation Committee should include at least one member with compensation experience and/or a member with related, although not necessarily direct, subject matter expertise.
Duties: The duties of the Compensation Committee are to review the compensation and performance of the Chief Executive and, to some extent (to be defined by each company), the members of the executive team. The Compensation Committee also typically reviews compensation levels and plans (annual incentive, long-term incentive, supplemental benefit and perquisites) and major agreements (employment, severance, change of control, etc.). It may also review non-executive officer compensation and broad-based plans on a periodic basis, as and when appropriate. Increasingly, the role of CEO succession planning is also being assigned to the Compensation Committee.
Operations: We recommend that companies establish a Compensation Committee Charter and Calendar. The Charter specifies the Compensation Committee’s role, duties, responsibilities, and membership, as well as its operations (such as the number of meetings per year, review of its own performance, etc.). The Calendar sets the schedule of topics to be addressed at each of its meetings throughout the year. For instance, at the Q1 meeting, the Committee will review and approve salary increases for the upcoming year, bonuses for the prior year and equity grants. Topics would also be outlined for the remaining fiscal quarters. By having both of these documents, the purview and process of the Compensation Committee are clear to all constituents (Board members, shareholders, and management).
While it takes some time for private companies to recognize the benefits of establishing a Compensation Committee, we find that Boards come to appreciate having a dedicated and knowledgeable resource that can regularly address compensation issues on its behalf.
On Wednesday April 29, the SEC held an open meeting and approved by a vote of 3-2 a staff proposal to amend Section 14(i) of the Securities Exchange Act of 1934 to expand disclosure requirements for executive compensation. The proposed amendment was added by Section 953(a) of the Dodd-Frank Wall Street Reform and Consumer Protection Act of 2010. The proposed rules will require clear disclosure of the relationship between executive compensation actually paid and company financial performance.
The SEC’s objectives – enhanced disclosure, more transparency, alignment of pay and performance – are praiseworthy, but some of the new rules are complex. CAP predicts that compliance will prove to be burdensome for most companies.
Highlights of the Proposed Rules
Publication of a New Table: The proposed rules add a new table to the current disclosure on executive compensation. This new table will include:
- Executive compensation actually paid for the principal executive officer and the average amount actually paid to the remaining named executive officers. For purposes of the table, compensation actually paid is total compensation as disclosed in the summary compensation table with adjustments to the amounts included for pensions and equity awards.
- The total executive compensation reported in the summary compensation table for the principal executive officer and an average of the reported amounts for the remaining named executive officers.
- The company’s total shareholder return (TSR) on an annual basis as presented in the existing stock performance graph. The definition of TSR is provided for the stock performance graph in Item 201(e) of Regulation S-K.
- The TSR of the companies in a peer group or index, using either the peer group identified by the company in its stock performance graph or in its compensation discussion and analysis.
CAP predicts that graphic representations, similar to the Stock Performance Graph, will be a popular approach.
Additional Disclosure: In addition to the new table, companies will be required to provide a clear explanation for the relationship between compensation actually paid and the company’s TSR performance. An explanation of the company’s TSR performance and the TSR performance of the peer group or index is also required. Companies will have the flexibility to provide this explanation as a narrative, in a graph or by using both.
Adjustments to Calculate Compensation Actually Paid: Companies will need to make two adjustments to total compensation reported in the summary compensation table to calculate compensation actually paid. The adjustments relate to equity award values and pension values. Companies will be required to disclose the adjustments to the compensation reported in the summary compensation table in a footnote.
First, the reported grant date value of equity will be subtracted from reported total compensation and the fair value of equity vesting in that year and re-valued on the date of vesting will be added to calculate compensation actually paid. Companies will need to disclose the vesting date valuation assumptions if they differ materially from the assumptions used for financial statements as of the grant date.
In the second adjustment, the reported change in pension value will be subtracted from reported total compensation and the change in pension value attributable to the actuarially determined service cost for services rendered by the executive during the applicable year will be added.
Time Period Covered: The disclosure will be required for the last five fiscal years, provided a company was subject to disclosure rules during this period.
Interactive Data Format Required: Companies will be required to tag the disclosure in an interactive data format using eXtensible Business Reporting Language, or XBRL.
Covered Companies: The proposed rules apply to all reporting companies, except that foreign private issuers, registered investment companies and emerging growth companies are exempt.
Transition Period: The proposed rules provide a phase-in for all companies. In the first year, companies will be required to provide the information for three years. The fourth and fifth years of disclosure will be added in each subsequent year’s annual proxy filing that requires this disclosure.
Rules for Smaller Reporting Companies: These companies are required to provide disclosure for only the last three fiscal years, rather than for five fiscal years. Smaller reporting companies will not be required to include peer group TSR, since they do not disclose either a stock performance graph or a compensation discussion and analysis. In addition, smaller reporting companies will not be required to make adjustments to pension amounts because they are subject to scaled compensation disclosure requirements that do not include disclosure of pension plans. The requirement to tag disclosure in an interactive data format will also be phased-in for smaller reporting companies, so that they will not be required to comply with the tagging requirement until the third annual filing in which the pay-versus-performance disclosure is provided. Initially, smaller reporting companies will provide the information for two years, adding an additional year in the next annual proxy or information statement.
Process: The proposed rules will be published on the SEC’s website and in the Federal Register. The comment period for the proposed rules will last for 60 days after publication in the Federal Register.
Adjustment to equity award values adds complexity and creates disconnects. By revaluing equity on the date of vesting, timing differences between the TSR calculation and the date(s) of vesting will occur. In addition, compensation actually paid will include tranches of different awards that happen to vest in a particular year so Board decision-making on pay and performance in the year of grant will be unclear.
CAP’s Initial Assessment of the Proposed Rules
We applaud the SEC’s attempt to improve disclosure and we agree that pay and performance alignment is critical to good governance and effective executive compensation programs. We also agree that some standardization is necessary. Our research indicates that approximately 15% to 20% of S&P 250 companies provide supplemental disclosure of either realized or realizable pay. Currently, there is no standard definition for either formulation of total compensation. Supplemental pay disclosure is frequently compared to TSR performance, but a consistent approach that can be compared across companies does not exist. The proposed rules impose a standard approach, but at what cost?
We are concerned that the proposed rules are too prescriptive and overly complex. Implementation will burden many companies. The proposed definition of compensation actually paid stands out as our biggest concern. The SEC proposal requires companies to re-value equity awards that vest in each year as of the date of vesting. This approach instantly creates timing differences between the stock prices used in the TSR calculation and the stock prices on the date(s) of equity award vesting. Vesting dates occur throughout the year, but occur most frequently in February – April for calendar year companies. As a result, the proposed approach allows for a re-valuation of equity awards at a more current stock price, but that stock price will likely not correlate with the fiscal year end stock price used in the TSR calculation. This is an obvious disconnect.
In addition, the re-valuation of equity awards for most companies will be composed of tranches of different awards that were granted in different years — likely spanning a three to five year period — that happen to vest in a single year. This approach contributes to confusion around the Board’s thinking on pay and performance alignment, rather than increasing clarity. Instead of focusing on the date of vesting, a better approach would be to re-value equity awards granted in a single year using a year-end stock price consistent with the TSR calculations.
Finally, to the extent that a company uses stock options, updating the assumptions used in option pricing models, such as Black-Scholes, to reflect the date of vesting will be time-consuming at best. This means that stock options will not only be re-valued at a new stock price, but that other assumptions, such as expected life, volatility, dividend yield and risk-free rates, must also be updated.
Two other aspects of the proposed rules contribute greatly to the compliance burden. First, the requirement to include compensation of the average of the remaining named executive officers in the new table in addition to the compensation of the CEO will be very complicated for companies to work through. Publication of this average based on equity grants made over a three to five year span to at least four executives for five years potentially requires dozens of calculations. The SEC should have limited the new disclosure to the CEO since that would greatly reduce the compliance burden and arguably allow for a simpler and more targeted explanation of the Board’s thinking. After all, the CEO normally sets the tone for the entire organization!
The second aspect of the proposed rules that increase the compliance burden is the decision to publish five years of information, rather than three years. Arguably longer time frames are positive when assessing TSR performance, but the summary compensation table shows three years of compensation. Most supplemental disclosure of realized and realizable pay out there today incorporates only three years of compensation and performance data. Even though the SEC provides transition relief, building out the new table to cover five years will be burdensome.
Adjustment to change in pension value is appropriate since it eliminates the impact of changes in assumptions for mortality and discount rates.
We will refine our initial assessment and provide more finely tuned comments back to the SEC during the public comment period. We would not be surprised if the SEC backs off on the date of vesting re-valuation of equity in favor of date of grant re-evaluation. Many will recall that when the proxy disclosure rules were initially proposed, equity award values reflected the amounts recognized for financial reporting purposes. After much public discussion and pushback, the SEC amended the disclosure rules in 2009 to incorporate the grant date fair value of equity awards.
More to come on these points in the next few months! We hope that the SEC achieves consensus on effective pay and performance disclosure before the 2016 proxy season begins.
Key Takeaways
- Compensation Committees face intense scrutiny with respect to executive annual bonus payouts and their alignment with performance
- Over a multi-year period, executives tend to earn an annual incentive payout approximately 90% of the time
- As a general rule of thumb, based on analysis of the past 6 years, the degree of difficulty, or “stretch”, embedded in performance goals translates to:
- A 90% chance of achieving Threshold performance
- A 70% chance of achieving Target performance
- A 15% chance of achieving Maximum performance
- This pattern indicates that threshold and target performance goals are set at attainable levels, but maximum payouts commonly reflect rigorous goals and superior performance
- Annual incentive payouts have generally been aligned with financial performance over the past six years for the companies reviewed
Background
Goal setting is one of the most challenging aspects of the compensation process. Compensation Committees struggle with this critical activity and try to determine if they are “getting it right”. Goals tied to annual incentive compensation face scrutiny from both internal and external stakeholders, pressuring Committees to achieve a balance between the rigor and the attainability of their goals. Appropriate performance targets will motivate and retain executives while driving corporate performance and creating returns for shareholders.
Summary of Findings
Plan Design
Annual incentive plans can be categorized as either “Goal Attainment” plans or “Discretionary” plans. Goal attainment plans contain traditional performance and payout scales that consist of a pre-determined minimum, target and maximum level of performance and corresponding payouts. Discretionary annual incentive plans allow the Committee to determine payouts by using discretion and targets are not necessarily defined up front.
In this study, we found that 71% of the sample companies have goal attainments plans. Discretionary plans are most prevalent among Financial Services companies. Our analysis focuses on those companies with goal attainment plans.
|
Plan Type |
|||
|
Industry |
Sample Size |
Goal Attainment |
Discretionary |
|
Auto |
n= 7 |
100% |
0% |
|
Consumer Discretionary |
n= 10 |
90% |
10% |
|
Consumer Staples |
n= 11 |
91% |
9% |
|
Financial Services |
n= 12 |
17% |
83% |
|
Healthcare |
n= 10 |
100% |
0% |
|
Industrials |
n= 14 |
79% |
21% |
|
Insurance |
n= 11 |
45% |
55% |
|
IT |
n= 12 |
75% |
25% |
|
Pharma |
n= 10 |
60% |
40% |
|
Total |
n= 97 |
71% |
29% |
Performance Metrics
In most goal attainment plans, awards are earned based on corporate performance related to two or three metrics. While the metrics vary by industry, some of the most common metrics are revenue and profitability. These metrics are popular because they are indicators of financial health to the investment community. From an internal perspective, revenue and profitability are simple to understand and in the “line of sight” for most executives in that the correlation can be seen between actions/decisions and results. From an external perspective, most shareholders would support an above target payout for executives who are driving top-line growth while maintaining or expanding margins.
|
# of Metrics Used in Goal Attainment Plan |
||||
|
Industry |
1 Metric |
2 Metrics |
3 Metrics |
4+ Metrics |
|
Auto |
0% |
43% |
57% |
0% |
|
Consumer Discretionary |
33% |
22% |
45% |
0% |
|
Consumer Staples |
20% |
40% |
10% |
30% |
|
Financial Services |
0% |
50% |
50% |
0% |
|
Healthcare |
20% |
50% |
20% |
10% |
|
Industrials |
27% |
55% |
9% |
9% |
|
Insurance |
0% |
40% |
40% |
20% |
|
IT |
11% |
22% |
56% |
11% |
|
Pharma |
0% |
0% |
50% |
50% |
|
Total |
16% |
36% |
33% |
15% |
Pay and Performance Scales
At companies with goal attainment plans, Compensation Committees must annually approve minimum, target and maximum goals and corresponding payout levels, for each metric in the incentive plan. Among companies included in our research, the most prevalent payout scale awarded executives 50% of target for threshold performance and 200% of target for maximum performance. Companies most often structure payout scales so that executives will earn 100% of their target annual incentive award for target performance and the actual payout is interpolated between threshold and target and target and maximum.
Annual Incentive Plan Payouts Relative to Goals
All Companies
Based on CAP’s review of annual incentive payouts, companies achieve threshold performance goals 90% of time. Annual incentive payouts most often fall between target and maximum. Companies’ annual incentive plans pay at this level 48% of the time or approximately one out of every two years. Executives earn bonuses in the range of threshold to target about 20% of the time, roughly once in every five years. Approximately 10% of the time, companies do not achieve threshold and executives do not earn a bonus. Payouts for the total sample are distributed as indicated in the following charts:
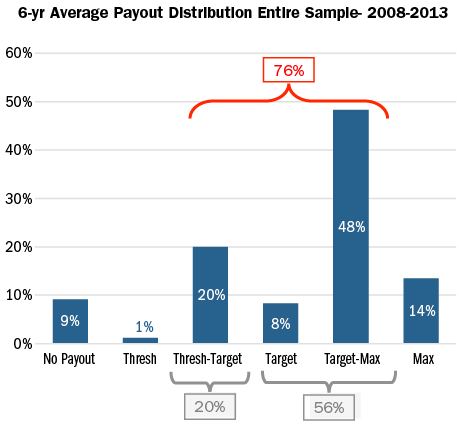
This analysis of the payout distribution is helpful in defining the degree of difficulty, or “stretch”, embedded in performance goals. Our analysis can be summarized with the following rule of thumb where Compensation Committees structure annual bonus performance goals with:
- A 90% chance of achieving Threshold performance
- A 70% chance of achieving Target performance
- A 15% chance of achieving Maximum performance
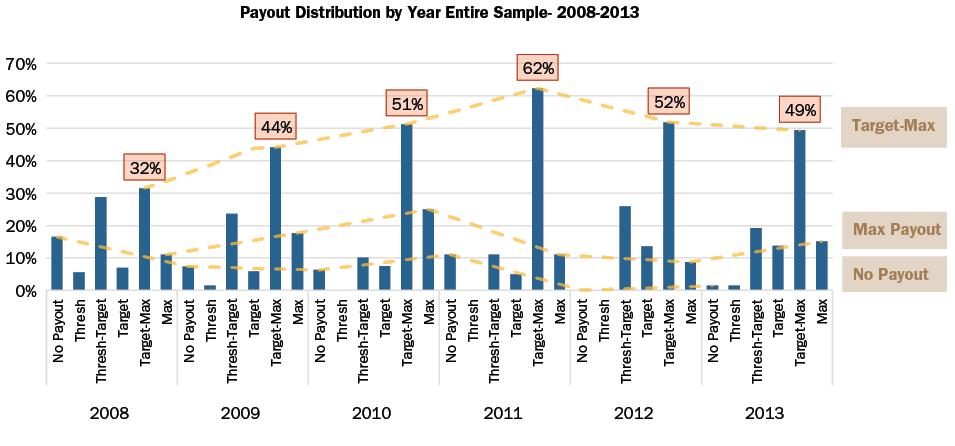
When the payout distributions are reviewed by year, the percentage of companies that paid target to maximum steadily increased from 2008-2011. This reflects an improvement in the overall economy since the financial crisis in 2008 as well as a greater ability to forecast performance in a more stable environment.
By Industry
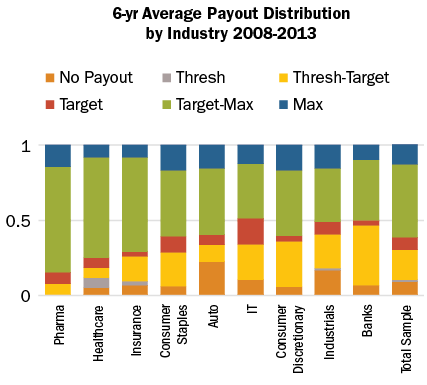
While historical payout levels vary by industry, all industries, on average, have most frequently paid bonuses between target and maximum. The Auto and Industrials industries are notable outliers in that executives received zero payouts once in every four years and once in every five years, respectively, likely indicative of industry dynamics and macro-economic conditions more than overly rigorous goal setting. Most cases when Auto companies did not pay annual incentives occurred in 2008, the peak of the financial crisis. Average payouts for each industry are distributed as indicated in the following chart:
Relative to Performance
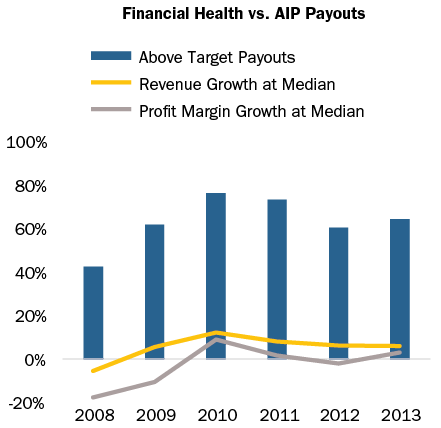
Over the past 6 years, the number of above target annual incentive payouts in a given year has generally tracked revenue growth and profit margin growth in the same year. In particular, payouts at Industrial and Pharmaceutical companies have aligned directionally with revenue and profit margin growth. This pay and performance relationship is key to aligning executives’ interests with those of shareholders. If the company exceeds anticipated performance, executives will earn above target payout levels without contest from internal or external stakeholders; however, if an executive is able to achieve extraordinary levels of pay without extraordinary performance, Committees risk facing opposition from shareholders and proxy advisory firms.
The chart below depicts the relationship between median revenue and profit margin growth and above target annual incentive payouts.
Conclusion
Threshold and target annual incentive performance goals are intended to be challenging but attainable. Maximum performance goals are meant to be attained only when executives achieve exceptional performance, exceeding internal/external expectations. Our study supports the formulation of a general rule of thumb, based on analysis of the past 6 years, where the degree of difficulty, or “stretch”, embedded in performance goals translates to:
- A 90% chance of achieving Threshold performance;
- A 70% chance of achieving Target performance; and
- A 15% chance of achieving Maximum performance.
This distribution indicates that Compensation Committees have built an appropriate degree of stretch into annual incentive plans overall.
We believe that when Committees set performance goals, they are influenced by prior year performance as well as economic and industry outlooks. Yet when measuring the directional trend over the past six years, we believe that Compensation Committees are adequately aligning internal performance goals with incentive payout objectives, and developing rational stretch above and below target — thus striking the right balance between the size and frequency of annual incentive payouts.
Methodology
Compensation Advisory Partners (“CAP”) reviewed the annual incentive plan designs of approximately 100 large companies representing a cross-section of industries. The companies included in this study have median revenues of $33 billion, a median market cap of $52 billion and a median 6-year total shareholder return of 9%, through year end 2013.
CAP analyzed the annual incentive plan payouts of the companies in the sample over the past 6 years to determine the distribution of incentive payments and the frequency with which executives typically achieve target payouts. In this analysis, CAP categorized actual bonus payments (as a percent of target) into one of six categories based on payout ranges as depicted in the following chart:
|
Payout Category |
Payout Range |
|
No Payout |
0% |
|
Threshold |
Up to 5% above Threshold |
|
Threshold – Target |
5% above Threshold to 5% below Target |
|
Target |
+/- 5% of Target |
|
Target – Max |
5% above Target to 5% below Max |
|
Max |
5% below Max to Max |
To address the limitations of SCT and GPBA data, companies have begun to disclose realized and realizable pay (see table below for definitions of realized and realizable pay). In order to evaluate this growing trend, Compensation Advisory Partners (“CAP”) reviewed the 2013 proxy statements of public Fortune 500 companies and tallied the disclosure of realized and realizable pay. For companies that presented a discussion on this topic, we recorded the use of graphics (e.g., tables and charts), we considered what methods companies used to compare different definitions of pay (e.g., vs. SCT/target pay, relative to a peer group, etc.), and we also tracked companies that supplemented their disclosure with the use of performance metrics.
|
Pay Component |
Realized |
Realizable |
|
Time Period |
1 – 5 years |
|
|
Base Salary |
Base salary disclosed in Summary Compensation Table (“SCT”) |
|
|
Bonus |
Actual bonuses/non-equity incentive (annual variable cash incentive) disclosed in the SCT |
|
|
Time-based Equity Awards |
||
|
Stock Options |
Value gained upon exercise for all stock options exercised within measurement period |
Valued at end of performance/measurement period Two alternative approaches: Intrinsic (in-the-money) value of awards granted during measurement period Updated Black-Scholes valuation of awards granted within measurement period |
|
Restricted Stock/Units |
Value at vest for all shares/units that vest within measurement period |
Value at end of measurement period, of all shares/units granted during measured period |
|
Performance-Contingent Equity Awards |
||
|
Stock/Stock Units |
Value upon payout, for all awards that paid during measured period |
Two alternative approaches: Value upon payout, for all awards that paid during measured period Awards granted, vested, and paid out during measured period; if unvested, target value of shares awarded during measured period |
|
Long-term Cash |
Long-term cash incentive payouts during measurement period disclosed in SCT |
Two alternative approaches: Long-term cash incentive payouts during measurement period disclosed in SCT Awards granted, vested, and paid out during measured period; if unvested, target value of long-term cash awarded during measurement period |
Results
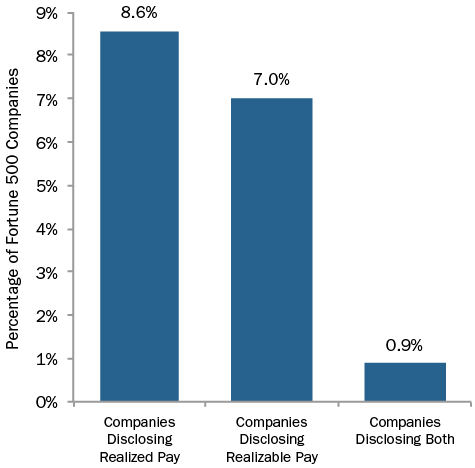
Among our sample of Fortune 500 companies, 15% supplemented the SCT and GPBA with realized and/or realizable pay disclosure. Approximately 9% of our sample disclosed realized pay, 7% disclosed realizable pay, and 1% disclosed both.
Realized Pay Disclosure
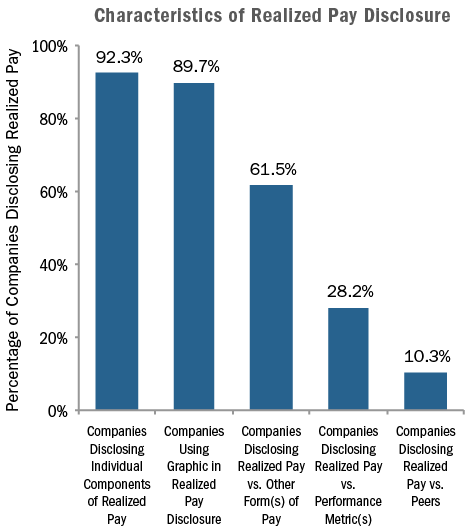
For companies disclosing realized pay, the most common methodology used was base salary actually paid, bonus actually paid, the value of restricted stock that vested during the period, and the value realized upon exercise of options during the period. In a lesser number of cases, companies also included all other compensation and the change in pension value. The majority of companies presented realized pay on an absolute basis (i.e., on an individual company basis, not against peers or some other index). CAP found that of the companies disclosing/discussing the concept of realized pay, most (90%) used some type of chart or table to discuss the concept, 62% compared their realized pay to some other definition of compensation (companies were equally divided between disclosing a comparison of realized pay to SCT pay or to the executive’s target compensation), and approximately 28% of companies compare a performance metric (most commonly TSR) to a graphic depiction of realized pay.
Companies disclosing realized pay had a median cumulative TSR of 7% and 5% on a 1- and 3-year basis, respectively—placing the majority of disclosing companies well below the median of the Fortune 500.
|
|
Cumulative TSR at 12/31/2012 |
|
|
Fortune 500 |
1-year |
3-year |
|
Median |
14.1% |
35.5% |
|
25th Percentile |
1.6% |
2.4% |
|
15th Percentile |
-3.9% |
-6.4% |
|
10th Percentile |
-10.8% |
-18.7% |
|
Companies Disclosing Realized Pay |
|
|
|
75th Percentile |
24.7% |
38.6% |
|
Median |
6.5% |
5.2% |
|
25th Percentile |
-7.8% |
-10.7% |
Realizable Pay Disclosure
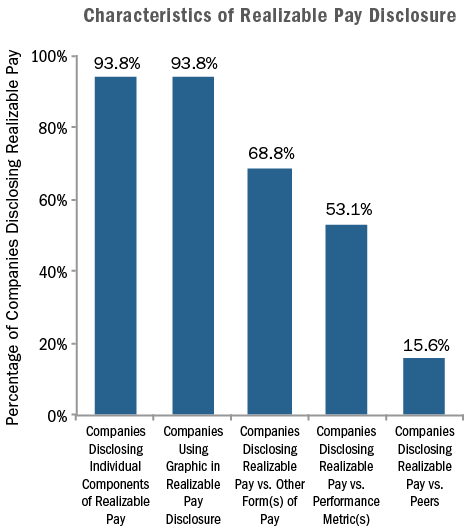
As stated above, among companies that disclosed a supplemental definition of pay, approximately half used some form of realizable pay. Typically, realizable pay is calculated as base salary, actual bonus paid, and long-term incentives granted and valued at the end of the period. For restricted stock, the value is calculated by multiplying the number of shares granted by the stock price at the end of the period. For stock options, the value is most often calculated as the intrinsic (in-the-money) value based on the stock price at the end of the period (Black-Scholes option values are also used, albeit less frequently). For performance shares, the calculation is generally based on the payout for shares granted within the period or the target number of shares granted for awards that have not vested, valued at the end of the period. Most of the companies disclosing used an accompanying table or graph to demonstrate the concept and the most commonly used graphics were: tables or charts showing the side-by-side difference between grant date/target pay vs. realizable pay, realizable pay vs. total shareholder return (TSR), or some combination of the two. Approximately 90% of companies disclosing realizable pay had SCT/GPBA pay data that was greater than realizable pay.
Like realized pay companies, a majority of Fortune 500 companies disclosing realizable pay had 1- and 3-year TSR at 12/31/2012 that trailed the median of the full Fortune 500 group. More specifically, the median TSR of realizable pay companies was slightly above the 25th percentile of the Fortune 500 on a 1-year basis, and between the 15th percentile and 25th percentile on a 3-year basis.
|
|
Cumulative TSR at 12/31/2012 |
|
|
Fortune 500 |
1-year |
3-year |
|
Median |
14.1% |
35.5% |
|
25th Percentile |
1.6% |
2.4% |
|
15th Percentile |
-3.9% |
-6.4% |
|
10th Percentile |
-10.8% |
-18.7% |
|
Companies Disclosing Realizable Pay |
|
|
|
75th Percentile |
19.2% |
37.1% |
|
Median |
1.7% |
-1.8% |
|
25th Percentile |
-15.0% |
-30.0% |
Conclusion
The 2013 proxy season was the first year where we saw a meaningful number of companies disclosing realized and/or realizable pay and with the 2014 proxy season fast approaching, we fully expect to see an increase in supplementary pay disclosure, particularly for those companies with below-average TSR.
Research assistance provided by: Kyle Eastman, Michael Biagi, Ryan Colucci.
Note: For detailed findings or specific company examples, please call or email Eric Hosken at Compensation Advisory Partners. We expect to publish a more comprehensive discussion of the topic in the Q2 2014 World at Work Journal.
Email: [email protected]
Phone: (212) 921-9363
In January, 2013, Institutional Shareholder Services (ISS) made two announcements of note related to executive compensation
- Realizable Pay: Updated the Evaluating Pay for Performance document to provide a detailed description of its methodology for calculating realizable pay
- QuickScore: Rolled out QuickScore as a replacement for its GRId score
Realizable Pay
For S&P 500 CEOs at companies with an annual meeting after February 1, 2013, the standard ISS research report will show three-year total realizable pay in addition to the three-year total grant date pay that is used in its quantitative analysis. If a company’s quantitative test results in a medium or high level of concern, ISS will discuss realizable pay levels vs. grant date pay as a part of the qualitative review. If realizable pay is significantly lower than grant date pay, it could be a potential indicator that the actual pay-for-performance relationship is more aligned than the quantitative analysis indicates. Conversely, if realizable pay is greater than grant date pay in a company whose quantitative analysis results in a medium or high level of concern, it may aggravate concerns about the pay for performance alignment. Although there are still some limitations to realizable pay analysis (discussed further below), we believe that, on an overall basis, this brings ISS’ analysis one step closer to assessing the true pay-for-performance relationship.
|
ISS methodology for total realized pay is to include all of the following (typically for the three-year period): |
||
|
Compensation Element |
ISS Approach |
CAP Perspective |
|
Base Salary |
As reported for all three years |
We support this approach |
|
Bonus / Short-term Non-Equity Incentives |
As reported for all three years |
We support this approach as it reflects what was actually earned |
|
Long-term Cash |
The earned value of the award (if earned during the same measurement period) or its target value in the case of on-going award cycles (i.e., not completed before the end of the measurement period) |
|
|
Share-based Awards |
The value (based on stock price as of the end of the measurement period) of awards made during the period (less any shares/units forfeited due to failure to meet performance criteria based on complete and clear disclosure); or, if performance awards remain on-going, the target level of such awards |
|
|
Stock Options |
The net value realized with respect to such granted options which were also exercised during the period; for options granted but not exercised during the measurement period, ISS will re-calculate the option value, using the Black-Scholes option pricing model, as of the end of the measurement period |
|
|
Change in Pension Value and Nonqualified Deferred Compensation Earnings |
As reported for all years |
|
CAP Perspective Almost any definition of realizable pay will be subject to criticism and scrutiny. Our main concern with the realizable pay approach proposed by ISS is that it is not directly connected to a review of the firm’s performance over the time period. Comparing realizable pay to grant date pay may be an indicator of the pay for performance relationship, but it is our position that it would be better viewed next to multiple years of performance relative to peers. We suspect that over time ISS will refine how realized pay is defined and could directly incorporate it into the pay-for-performance quantitative test.
ISS notes that it is their intent to collect the required information in a standardized way that is easily obtained from a company’s tabular disclosure. Companies can help improve the accuracy of ISS’ analysis by clearly revealing, in a supplemental table, any performance based awards that have been forfeited prior to the completion of ISS’ assessment period (i.e., most recent three years).
ISS QuickScore
On January 25th, ISS rolled out QuickScore as a replacement of its GRId score. It will apply a scoring system based on the decile ranking of a company relative to others in the respective country.
- Coverage: 3,000 largest U.S. public companies
- Methodology: The scoring will be applied over the same four quadrants used for the GRId score, with several subcategories in each quadrant
|
Categories for the Quickscore |
|||
|
Board Structure |
Compensation/Remuneration |
Shareholder Rights |
Audit Practices |
|
|
|
|
- Screening Process:Assesses companies based on multiple qualitative factors to see if they exceed, meet, or fall short of market practices
- Quantitatively assessed correlation between 16 performance and risk factors
- Factor Criteria: Provides red flag summary of practices that raised concern and green stars for practices that mitigate concern
- Data Verification: Companies have the ability to verify their data between January 28th and February 15th. When the product launches, companies will once again be able to verify their data
CAP Perspective: The structure and criteria of the QuickScore appear very similar to what was used under the GRId score. The main change appears to be the relative scoring approach, which should provide a better indicator of governance risk compared to other companies
Conclusion
While ISS’ evaluation criteria are always challenging for companies to address, the changes made to the ISS pay-for-performance evaluation and the transition from GRId to QuickScore represent directional improvement. We expect that the calculation of realizable pay and its role in the pay for performance evaluation will continue to evolve over time. Similar to GRId, it is not clear what role QuickScore will play in shareholder voting decisions. We expect that it will be a starting point for deeper analysis in cases where the score indicates governance concern.