Highlights
- Nearly all companies (94%) have adopted a clawback policy, even without SEC guidance on Dodd Frank requirements for clawbacks
- Consistent with our past findings, the most common forms of compensation that are potentially subject to recoupment are prior year’s cash and stock incentives
- Hedging policies are in place at most companies, with 95% disclosing a hedging policy (vs. 91% in 2013)
- Pledging policies can vary in scope as companies, but 63% of companies have a policy of some type in place
- Some companies ban all pledging (68%), while others require advance approval for pledged shares (20%) or only prohibit pledging of shares subject to stock ownership guidelines (12%)
Survey Sample
Compensation Advisory Partners (“CAP”) reviewed 2014 proxy disclosures at a sample of 100 companies among the Fortune 500 representing nine industry groups. Industry groups included: Automotive, Consumer Goods, Financial Services, Health Care, Insurance, Manufacturing, Pharmaceutical, Retail, and Technology. For the companies studied, the median revenue size and market capitalization was $32B and $52B, respectively. The median 2013 total shareholder return (TSR // change in stock price plus dividends) was 43%.
Clawbacks
Although companies are still waiting for SEC guidance on Dodd Frank, many have already implemented clawback policies on their own. Dodd Frank requires a broader definition of clawback compared to Section 304 of SOX, which applies to CEOs and CFOs.
Similar to our findings last year, 94% of companies we studied have some form of clawback policy, compared to 86% and 80% in 2011 and 2010, respectively. Because the majority of companies have now adopted robust clawback policies, the number of changes made in 2013 as compared to prior years has decreased. In 2013, there were no companies that adopted a new clawback policy, while only 7 modified existing provisions. The most common changes made were to expand the compensation subject to clawbacks and expand the triggers for clawbacks beyond financial restatements.
As in prior years, a financial restatement (87%) and misconduct (77%) are the most common triggers for a clawback. For the first time in our study, fraud (50%) will trigger a clawback for a majority of the companies analyzed.
Under nearly all policies, it is most common for companies to include the ability to recoup compensation previously granted. Some companies will also have clawback provisions in place that allow them to either adjust the amounts of future incentive compensation given or cancel any outstanding performance-based stock or cash awards.
|
Compensation Subject to Clawback |
2013 |
% of Cos. |
2012 |
% of Cos. |
2011 |
% of Cos. |
2010 |
% of Cos. |
|
Prior LTI |
91 |
98% |
88 |
95% |
95 |
97% |
79 |
89% |
|
Prior Annual Incentive |
89 |
96% |
86 |
92% |
92 |
94% |
81 |
91% |
|
Future Annual Incentive |
20 |
22% |
19 |
20% |
16 |
16% |
20 |
22% |
|
Future LTI |
21 |
23% |
18 |
19% |
15 |
15% |
14 |
16% |
Note: Percentages add up to greater than 100% due to multiple responses
Coverage extends to all NEOs in 97% of companies, which is higher than our findings in 2010, 2011, and 2012. Interestingly, many companies extend coverage beyond the NEO level, with 50% of companies having clawback policies in place for all Section 16 officers. Companies are not required to disclose the level of program detail in the proxy, but we expect most program provisions are more broad-based.
Similar to our findings in prior years, less than a quarter of companies indicate the length of the look-back period during which compensation can be recovered. Of the 21 companies that disclosed a time frame, the most common is 1 year (52% of companies) from date of restatement, followed by 3 years (38% of companies).
As we wait for the SEC to propose final rules, there are several practical challenges to clawing back compensation, such as how to clawback equity gains, how to claw back from former employees and the tax implications of clawbacks.
Hedging and Pledging
With increasing scrutiny from shareholder services such as ISS, hedging and pledging policies have become more significant governance / shareholder issues. ISS has taken the stance that any hedging and significant pledging by insiders to be indicative of a potential failure of risk oversight on behalf of a company’s Board. The Board’s policy regarding these practices is most commonly reflected in the company’s insider trading policy, but it can be addressed through Board resolutions or a stand-alone policy.
Hedging is viewed as a poor practice as it insulates executives from stock price movement and reduces alignment with shareholders. Pledging, in modest amounts, may not be viewed as negatively, yet can become problematic if there were a significant decline in stock price which necessitated a sale of shares from a senior executive. Given the potential negative perception of insider hedging and pledging, as well as the pending Dodd Frank guidance, companies have begun to adopt policies to limit these provisions. Anti-hedging and pledging policies are in place at 95% and 63% of companies studied, respectively; 63% of companies have both policies in place and 32% only have a hedging policy.
|
Hedging / Pledging Policies |
2013 |
% of Cos. n=100 |
2012 |
% of Cos. |
|
Hedging Policy |
95 |
95% |
91 |
91% |
|
Pledging Policy |
63 |
63% |
59 |
59% |
|
Both |
63 |
63% |
59 |
59% |
|
Hedging Only |
32 |
32% |
42 |
42% |
Note: Percentages add up to greater than 100% due to multiple responses
An example of typical disclosure of a prohibition on hedging/pledging is reflected in 3M’s proxy disclosure:
“The Company’s stock trading policies prohibit directors and the Company’s executive officers from (i) purchasing any financial instrument that is designed to hedge or offset any decrease in the market value of the Company’s common stock, including prepaid variable forward contracts, equity swaps, collars and exchange funds; (ii) engaging in short sales related to the Company’s common stock; (iii) placing standing orders; (iv) maintaining margin accounts; and (v) pledging 3M securities as collateral for a loan.”
Our analysis of pledging policies was broken down further to show that there are variations to prohibit pledging. A company can ban all pledging (68% of companies with anti-pledging policies), prohibit pledging of shares unless an employee receives advance approval (20%) or prohibit any shares subject to stock ownership guidelines to be pledged (12%).
An example of the latter two anti-pledging policies can be found in Best Buy and ACE’s proxy statements, respectively:
Best Buy: “…our executive officers and Board members are prohibited from holding Company securities in a margin account or pledging Company securities as collateral for a loan, unless approved in advance by the Compensation Committee.”
ACE: “The Company prohibits NEOs from pledging shares that are held in satisfaction of the share ownership guidelines.”
Pledging was not addressed in Dodd-Frank per se, and we do not know what the SEC’s position will be in the future. We do however expect more companies to adopt pledging policies going forward given ISS’ 2012 policy statement that identified pledging of company stock by executives as a poor practice.
Conclusions
We continue to see companies stay ahead of the curve and track “best practices” in order to satisfy shareholders and proxy advisory firms. This results in reevaluations of company pay and governance practices, and as our research shows, continued modification of clawback policies, and adoption of hedging and pledging policies. While formal guidelines have not been given to date, companies are adopting these policies as good governance, regardless of any final SEC guidance.
Highlights
- The look and feel of proxy statements have changed
- Best practices for CD&A include a concise executive summary
- Pay mix charts, other charts, a list of “best practices” that the issuing company follows and a proxy summary are now commonly included
- Financial performance frames the discussion of executive compensation
- A trend in recent years is the disclosure of realized/realizable pay
Compensation Discussion & Analysis (CD&A)
Survey Sample
Compensation Advisory Partners (“CAP”) reviewed 2014 proxy disclosures at a sample of 100 companies among the Fortune 500, representing nine industry groups. Industry groups included: Automotive, Consumer Goods, Financial Services, Health Care, Insurance, Manufacturing, Pharmaceutical, Retail, and Technology. For the companies studied, the median revenue size and market capitalization was $32B and $52B, respectively. The median 2013 total shareholder return (TSR // change in stock price plus dividends) was 43%.
The Say on Pay vote has succeeded in improving and increasing communication with shareholders regarding executive compensation programs. Many companies have adopted what are commonly referred to as “best practices” for proxy disclosure.
|
Elements Included in 2014 Proxy Disclosure Among Fortune 500 companies |
||
|
# of Cos |
% of Cos |
|
|
Executive Summary |
89 |
89% |
|
Pay Mix Chart(s) |
79 |
79% |
|
Use of Other Charts and/or Graphics |
73 |
73% |
|
List of “Best Practices” |
67 |
67% |
|
Realized and/or Realizable Pay |
15 |
15% |
- Executive Summary: Most important part of the CD&A. Continued enhancement over past few years. Typically includes thorough discussion of financial performance and key company achievements, a summary of CEO compensation, and key changes to executive compensation programs, if any
- Pay Mix Charts: Very common. Typically reflect variable vs. fixed pay or performance-based vs. non-performance-based pay
- Use of Other Charts and/or Graphics: Very common. Most often used to directly, and concisely, describe company performance. May include absolute and/or relative performance
- Realized Pay and Realizable Pay: Emerging practice. Intended to illustrate the impact of performance outcomes on pay over time. In contrast, while the Summary Compensation Table reflects actual cash payments, equity awards reflect target values
- List of “Best Practices”: Very common. Often takes the form of “What We Do/Don’t Do” list. Eliminates need for shareholders to take the time to seek these things out
Another trend related to enhanced proxy disclosure of executive compensation programs and decision-making, is increased disclosure of incentive plan goals. Shareholders and proxy advisory firms have expressed the desire for more information on short- and long-term incentive compensation performance targets/goals. Two examples of companies that increased proxy-based incentive plan goal disclosure in reaction to shareholder input are Coca-Cola and Dow Chemical.
|
Company |
Shareholder Feedback |
Action by Company |
|
Coca-Cola |
|
|
|
Dow-Chemical |
|
|
Conclusions
We have observed companies more frequently modifying and enhancing their executive compensation and governance practices, given increasing influence and input of shareholders (and proxy advisory firms). Shareholder communication has also been enhanced, including the proxy statement.
During the 2015 proxy season, we expect more companies to disclose realizable and/or realized pay, particularly if TSR or Say on Pay support are low, and enhance transparency and highlight best practices in executive compensation disclosure. The goal is for executive compensation programs to best support business strategy, while aligning with shareholder interests. Disclosure is an opportunity to highlight all the good work and thought that goes into the design of these programs and the related decision-making.
The SEC recently updated its regulatory agenda. As part of the update, the deadline to adopt final pay ratio rules was pushed back to October 2015 (from October 2014).
- Implication: companies with a Dec 31 fiscal year end are not expected to be required to comply with pay ratio rules/disclosure until publication of 2017 proxy statements
The deadline for other outstanding compensation-related rulemaking coming out of the Dodd-Frank Act was also delayed to October 2015: standardized pay vs. performance disclosure, hedging policies, and clawbacks requirements.
- Note: Timeline changes reflect a new deadline, not the date at which rulemaking will be published or adopted
We will provide additional updates as this issue continues to evolve.
Underlying the Fed’s input to financial institutions is a legitimate concern about the potential for incentives to encourage excessive risk taking. The Fed has stated that: “risk-taking incentives provided by incentive compensation arrangements in the financial services industry were a contributing factor to the financial crisis that began in 2007” and “Before the crisis, large banking organizations did not pay adequate attention to risk when designing and operating their incentive compensation systems.” Agree or disagree with these points, over the past several years compensation-related risk management processes have vastly improved.
In this CAPflash, we provide an overview of how compensation practices have evolved following the Fed’s guidance, what (in our view) the Fed has got “right” and where they may have gone too far, and what we expect to see from banks and regulators in the near future.
Where We Are Now
The Final Guidance was principles-based, leaving leeway for implementation to consider differences among the institutions subject to this new level of oversight. For example, companies with significant differences in their businesses, such as select investment banks, custody banks, regional banks, and credit card companies were all subject to the same guidance. In its October 2011 publication, the Federal Reserve noted, “The interagency guidance helps to avoid the potential hazards or unintended consequences that would be associated with rigid, one-size-fits-all supervisory limits or formulas.” In our experience, banks devoted considerable time and resources to demonstrate substantial conformance with the new requirements, but went about responding and demonstrating conformance to regulators in different ways.
The Interagency Guidance was founded on three key principles:
- Balance between risks and results. Incentive compensation arrangements should balance risk and financial results in a manner that does not encourage employees to expose their organizations to imprudent risks;
- Processes and controls that reinforce balance. A banking organization’s risk-management processes and internal controls should reinforce and support the development and maintenance of balanced incentive compensation arrangements; and
- Effective corporate governance. Banking organizations should have strong and effective corporate governance to help ensure sound incentive compensation practices, including active and effective oversight by the board of directors.
Improved Risk Management
In our experience, companies have come a long way in addressing all three key principles. Most banks have greatly strengthened their risk management processes and ensured that the risk function has a defined role in reviewing compensation design, as well as performance outcomes and their impact on compensation payments. Where the risk function seldom had any role in the incentive compensation process in the past, they are now integrated into the process. Similarly, great strides have been made to ensure that Compensation Committees are informed about risk-taking within the organization and how incentive compensation designs across the company address risk. Many banks have also formed internal committees responsible for maintaining controls and risk oversight of incentive compensation plans across their organizations.
Prescribing Plan Design
The Fed and other agencies have become more prescriptive in their “guidance” to banks, at times almost to the point of allowing for limited leeway in compensation practices. The table below provides a summary of the methods for linking compensation and risk outcomes described in the Final Guidance, and select examples of how current compensation design practices have evolved based on input from regulators.
|
Areas of Principles- based Interagency Guidance |
Select Examples of Design Practices Reacting to Fed Direction |
|
Deferred Incentive Compensation |
Significant Changes Reduced upside leverage in long-term performance plans (from 200% to 125%-150% of target) Elimination of stock options (or significant reduction to modest percentage of total long-term) |
|
Risk Adjustment of Incentives |
Significant Changes Risk-adjusting incentive pools Performance-based adjustments that apply to deferrals/long-term incentives over the full vesting period with ability to reduce awards to zero based on risk outcomes |
|
Other Methods that Promote Balanced Risk-Taking Incentives |
Modest Changes Discretionary annual incentives most common (some shifts where formula-based payouts had existed) Reduced upside leverage in annual incentive plans, at times with corresponding increases to fixed pay (salaries) Some reduction in the use of relative performance measures in annual and/or long-term incentive plans |
|
Enhanced Control Functions |
Modest Changes Risk management and internal control functions involved in designing, implementing, and evaluating incentive arrangements to ensure proper risk-balancing in a more formal way |
|
Strong Corporate Governance |
Modest Changes Increased Board/Committee oversight of incentive compensation arrangements below senior executive level, for other covered employees (including non-executives) Mechanisms to facilitate communication between the Compensation Committee and Risk and Audit Committees |
In our view, the area where the Federal Reserve has had the most positive impact on incentive compensation design is in requiring deferrals to be subject to performance adjustment, before and after grant, based on risk outcomes (generally not the case before the guidance). Other changes encouraged by the Fed (e.g., eliminating/reducing stock options, reducing upside incentive plan leverage to 125%-150% of target, reducing the use of relative measures, etc.) seem to be less well founded in the principles of risk balancing and more arbitrary. It is difficult to identify the role that these incentive design features played in the financial crisis and it seems to us that Fed input on these areas is based more on theoretical objections than any empirical data supporting the hypothesis that these incentive design features encouraged excessive risk-taking among executives at financial institutions.
Future Concerns and Expectations
U.S. regulators should be commended for maintaining a largely hands off approach thus far with respect to pay levels, focusing primarily on incentive compensation design and control features. This approach provides a strong focus on risk balancing of incentive compensation, while recognizing the need for the industry to maintain competitive compensation programs. In contrast, in the European Union, CRD-IV places caps on the level of incentive pay that may be delivered (as a ratio of fixed pay). This type of regulation severely limits the ability to implement a pay-for-performance compensation design and, in response, has led many companies to increase fixed pay. As a result, CRD-IV has potentially harmed shareholders by weakening the pay-for-performance relationship. Thankfully, to-date, the Fed has avoided this kind of heavy-handed approach in addressing compensation in U.S. financial institutions.
Still, we may have unanticipated consequences in the U.S. Many shareholders and shareholder advisory groups prefer formulaic performance-based incentive arrangements to discretionary incentives, as they fear that discretion will be used for the benefit of management. However, because regulators have discouraged formulaic, performance-based upside in incentive compensation plans, many financial institutions have moved to more discretionary incentive arrangements to allow for greater flexibility to compensate executives. Another potential response to the Fed’s input is that, over time, financial institutions may increase pay levels to address concerns that executive talent will depart for other industries (e.g., hedge funds, private equity, asset management) where there are no restrictions on incentive design.
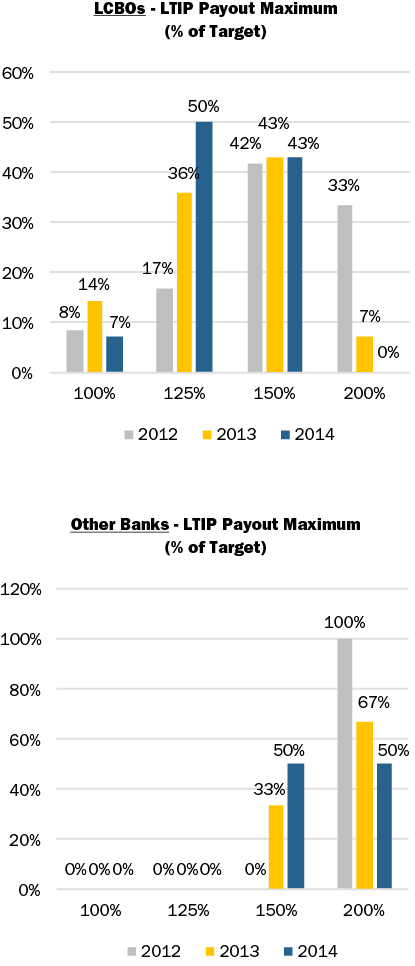
Going forward, we expect regulators to provide more guidance on monitoring and validation processes and results. Many companies developed approaches to retrospectively review risk outcomes and the corresponding impact on compensation decisions, but communicating these processes and results for all covered employees to regulators is still, generally, in early stages. Regarding incentive plan upside leverage, regulators have started to state more and more directly a belief that 125% is most appropriate, but many banks have held their ground at 150%. Some of the banks that moved to 125% may start to re-evaluate their program and consider moving back to 150% to remain competitive.
As companies and Committees try to “live with” the restrictions of the guidance, we expect to see a continued move away from formal targets and increased use of discretion, increases in pay levels to recognize decreased incentive plan upside leverage, and challenges in applying risk adjustments and clawbacks.
Conclusion
Incentive compensation processes and designs among financial institutions have changed a great deal over the past four years, to a large degree driven by regulatory input. If we look back at the principles (Final Guidance), most banks have come a long way in addressing them. At this point, we hope that regulators can step back and consider how much progress has been made and consider taking a pause to begin to evaluate what changes were necessary and effective and what changes may have been excessive.
Appendix – Summary Market Data
[company-by-company data available upon request]
Methodology
CAP reviewed 2012, 2013, and 2014 proxy statements and the most recent equity award agreements of the 23 large publicly-traded banks1 that were included as part of the Federal Reserve’s horizontal review of incentive compensation. Our analysis looked for year-over-year changes in compensation structure, annual and long-term incentive design, performance-based vesting, recoupment policies and stock ownership guidelines/retention requirements.
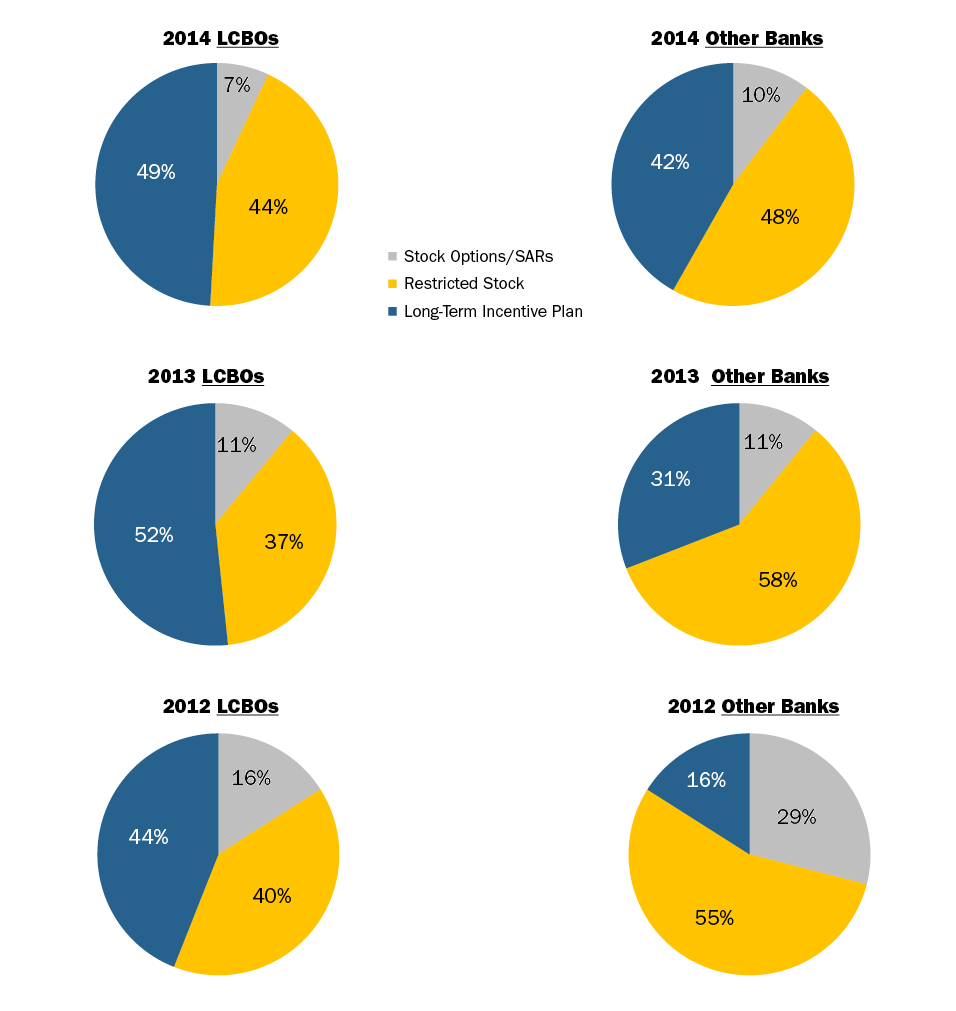
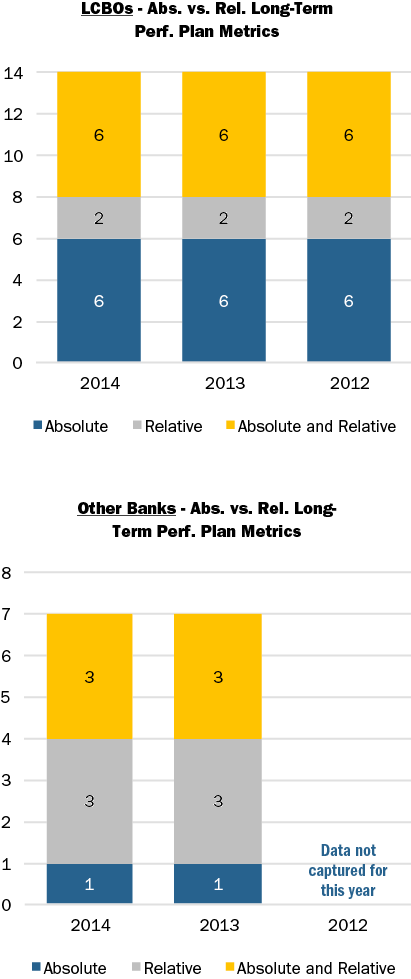
Select summary data is shown below. Findings have been divided into two data sets, large complex banking organizations (LCBOs) and other large banks with assets exceeds $50 billion. LCBOs are one year ahead of the other large banks in terms of their interaction with the Fed, and the related implications on compensation program design.
Long-term Incentive Mix, 2012-2014
Long-term Incentive Absolute vs. Relative Performance Metrics, 2012-2014
Long-term Performance Plan Maximum Upside Leverage, 2012-2014
Stock Ownership Requirements
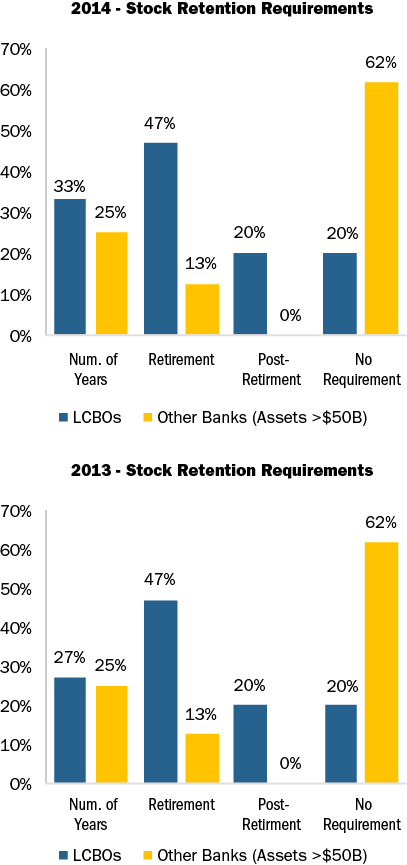
Some companies differentiate stock retention requirements for the CEO versus Other NEOs. Therefore in some instances the prevalence shown is greater than 100 percent.
Research assistance was provided by: Myron Lising, Roman Beleuta, Michael Biagi, Michael Bonner, Rachael Holland, and Jasmine Yanes.
1 Companies reviewed include American Express, Bank of America, BNY Mellon, Citigroup, Capital One Financial, Discover Financial Services, Goldman Sachs, JPMorgan Chase, Morgan Stanley, Northern Trust, PNC, State Street, SunTrust Bank, US Bancorp, Wells Fargo, BB&T, Comerica, Fifth Third, Huntington Bancshares, KeyCorp, M&T Bank, Regions and Zions Bancorp.
The SEC’s proposed rule requires companies to disclose in their registration statements, proxy statements and other annual reports where compensation is mentioned, the following three items: 1.) The annual total compensation of its median employee, 2.) The annual total compensation of the CEO, and 3.) The ratio of the two amounts above. While this calculation seems like straightforward arithmetic, it may prove to be difficult for many companies, especially those whose operations are complex and global.
- Employees Included. As a first step in the process of identifying the median employee, companies must incorporate all employees including full-time, part-time, temporary, non-US employees, and employees of a subsidiary, all of which have been employed on the last day of the fiscal year.
- Identifying the Median Employee: The proposed rule does not specify methodologies for identifying the median employee, aside from the requirement that all employees be considered. Instead, the proposed rule allows companies to choose a methodology for identifying the median employee in a way that is logical and appropriate for the company’s size and structure. Companies can, depending on their complexity, use the median employee of the full-employee population, or rely on statistical sampling to estimate what the median employee earns.
- Determining Compensation of the Median Employee. One of the greatest challenges in calculating the CEO pay ratio was identifying pay for employees in a consistent manner in order to calculate median pay. The proposed rule has provided wide latitude to companies in using alternative definitions of pay for purposes of estimating the median paid employee (e.g., total direct compensation, total cash compensation, W-2 compensation). However, the SEC is more stringent about annualizing pay. While companies may annualize compensation for workers hired mid-year, they would not be permitted to make full-time equivalent adjustments for part-time workers.
- Calculating the Ratio. Once the median employee is identified, compensation for that employee has to be determined. The Dodd-Frank Act requires that employee total compensation would be calculated using the same methodology as required for named executive officers, a requirement that is not currently applied to non-executive employees. A key advantage of the proposed rule is that this more complicated pay calculation only needs to be done for the employee identified as “the median employee”.
CAP Comments: While some commentators hoped that the rule would apply to only U.S. employees or only full-time employees, the proposed rule includes the total employee population. This will make the determination of the median employee more complicated for global employers. In addition, it may create challenges for investors in interpreting the ratio or comparing across companies, as the ratio will vary based on the number of workers employed in low wage countries or the number of part-time or temporary workers employed.
CAP Comments: It is a positive sign that the SEC recognizes the complexity of determining the median employee. Unfortunately, compensation professionals will have to dedicate time and resources to understanding the potential approaches available to them and will likely have to pay external experts to conduct the analysis, particularly if they rely on statistical sampling.
CAP Comments: The latitude provided should simplify calculating pay in a way that facilitates identifying the median employee. The downside of the proposal is that differences in approach may make comparisons of the ratio across companies less meaningful. The limitations on annualizing compensation will result in less favorable CEO pay ratios for companies employing temporary or part-time workers.
CAP Comments: This calculation should be relatively straightforward as the greatest complexity is in identifying the median employee.
Additional aspects to this regulation would require companies to disclose methodologies, estimates and assumptions used in the calculation. As provided by the JOBS Act, the proposed rule would not apply to emerging growth companies, nor would it apply to smaller reporting companies or foreign private issuers.
Implementation Time-frame
Following this proposal, there will be a 60 day public comment period. Companies would be required to report the pay ratio with respect to compensation for its first fiscal year beginning after the effective date. Depending on the effective date of the final rule (2013 vs. 2014), fiscal year companies will first have to report the ratio in their 2015 or 2016 proxy statement, covering pay for the 2014 or 2015 fiscal year.
Overall Comments
The intent of this legislation is to raise awareness around the disparity between pay levels for top executives and the typical worker. However, from our perspective the primary outcome of the rule is an additional burden on companies to comply with this law. Companies will need to spend time and resources collecting and compiling compensation records and will likely require the assistance of technical and legal advisors to establish and implement the approach to identify the median employee. In the cost-benefit analysis section of the proposal, the SEC struggled to identify any quantifiable benefits of the rule, while the costs of compliance are fairly obvious.
The CEO pay ratio will be challenging to interpret. The ratio may vary across companies due to corporate structure and business decisions, rather than the pay philosophy of the company. For example, companies in industries that depend on part-time and seasonal workers will have a pay ratio that looks less egalitarian than a company with only a full-time workforce, regardless of whether each company pays a competitive and market-based wage to each class of employees. Moreover, for companies with concentrations of employees in one or more developing countries, this ratio will exaggerate the difference between executive and employee pay, not to mention the additional administrative responsibilities necessary to convert workers’ wages abroad to US dollars. In contrast, a company that has outsourced all of its low paid administrative functions to India or China, may have a better CEO pay ratio than a company that completes these tasks in-house. While we expect that most investors will ignore the CEO pay ratio, there will likely be reporting of the ratio in the press. Companies should also monitor whether ISS and Glass-Lewis take interest in the pay ratio. While our sense is that the CEO pay ratio is not a primary concern of institutional investors, the shareholder advisory firms are active in finding new areas of executive pay to target for criticism.
Conclusion
Starting now, the SEC will review comments received within the 60 day window, and comments are already being submitted. While it is unknown how such comments will be received and/or incorporated by the SEC, it is important to be thinking ahead to future disclosure and the necessary changes corporate human resources professionals will need to make to comply with the new rule.
Many groups as well as factions within congress lobbied to have this provision of Dodd-Frank removed as the resources required to implement it are anticipated to outweigh the benefits of the additional disclosure. While there has been limited information released from the SEC, it is likely that the guidance will be somewhat less onerous than originally expected, possibly only requiring companies to compare CEO compensation to a sample of employees as opposed to the entire population. More questions than answers still remain, including when the disclosure will be effective. However, as soon as preliminary guidance is released, we will send a comprehensive CAPFlash on the guidance.
What We Found
Each of the 23 large banking organizations has adopted an annual Say on Pay vote, and among these companies average annual support from 2011-13 approximated 90%.
During this time period, only one company, Citigroup in 2012, did not receive majority shareholder support for its Say on Pay resolution. However, a number of additional large banking organizations (3 others in 2012; Northern Trust, Huntington Bancshares and BNY Mellon) received at or below 75% shareholder support. In each of these cases, we observed significant pay program changes in the subsequent year that were in line with changes seen among companies across industries, not just financial services firms that are affected by regulatory oversight. One company in 2013, Comerica, received below 75% shareholder support and as such we expect a similar response to efforts around shareholder outreach and potential program changes this year.
Proxy advisory firms (i.e., ISS and Glass Lewis) voting recommendations also have been impacting Say on Pay results. Our research shows that an ISS vote recommendation impacts Say on Pay vote results by approximately 30 percentage points.
Say on Pay Vote Results and Implications
Comparisons of results over the last 3 years generally show a consistent pattern with the majority of banks studied receiving 90+% shareholder support. Further, when comparing 2013 shareholder support levels to the S&P 500 to-date, results among the broader industry yields slightly higher support at median (95% vs. 93%).
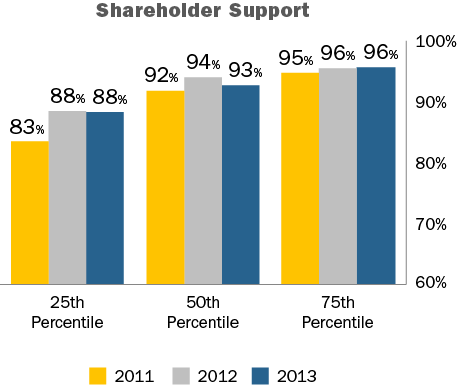
A company only “fails” a Say on Pay vote if a majority of shareholders do not vote in support of the Say on Pay resolution. However, an “acceptable” shareholder support threshold has emerged around 75%. ISS identified 70% as a minimum acceptable level of support, while Glass Lewis prefers 75%. Further, even with results above 70% or 75%, if results are significantly below prior year results, companies will reevaluate their compensation programs. It is important to note that companies and Boards may be subject to reputational risk with “low” pass rates (i.e., approximately 75% or below).
One company in 2013 – Comerica – reviewed received less than 75% shareholder support. Comerica’s low support level (61%) was likely attributed to two factors: 1) weak 1- and 3-year TSR and 2) ISS recommending shareholders vote “Against” the Say on Pay resolution. ISS’ “Against” recommendations are often driven by high pay relative to performance and/or poor pay practices.
Four companies in 2012 received 75% or lower shareholder support for their Say on Pay resolution – Citigroup (45%), Northern Trust (75%), Huntington Bancshares (61%), and BNY Mellon (58%). Several factors may have led to the low support levels among these large banks, including, low TSR, high pay levels for the CEO or problematic pay practices (i.e., high discretionary payouts associated with poor performance). TSR among these four companies was negative for the one, three and five year periods ending in 2011.
Following the low Say on Pay support level, all made significant changes to their pay programs and conducted enhanced shareholder outreach efforts. In the subsequent year, average support increased by 33 percentage points. In 2013, all four received an ISS “For” Say on Pay vote recommendation (only 1 of 4 did in 2012).
|
Company receiving at or below 75% support on Say on Pay in 2012 |
% Support Received in 2012 /2013 Say on Pay Vote |
Modifications Made to Compensation Program (from 2013 proxy statement disclosure) |
|
Citigroup |
2012 – 45% (ISS – Against) 2013 – 92% (ISS – FOR) |
|
|
Northern Trust Corp |
2012 – 75% (ISS – FOR) 2013 – 87% (ISS – FOR) |
|
|
Huntington Bancshares |
2012 – 61% (ISS – Against) 2013- 95% (ISS – FOR) |
|
|
BNY Mellon |
2012 – 58% (ISS – Against) 2013 – 97% (ISS – FOR) |
|
We have observed a link between Say on Pay vote results and company performance, as primarily measured by TSR. Not surprisingly, companies that enjoy high levels of shareholder support for their Say on Pay resolutions tend to have performed better in the prior year and over the latest three year period.
TSR vs. Say on Pay Vote Results
|
% in Favor |
Avg. 3-Yr TSR @ 12/31/12 |
Avg. 1-Yr TSR @ 12/31/12 |
|
Prior to 2013 Annual Meetings |
Prior to 2013 Annual Meetings |
|
|
95 – 100% |
16.3% |
38.2% |
|
90 – 94% |
5.2% |
42.8% |
|
70 – 89% |
2.5% |
27.6% |
|
50 – 69% |
2.1% |
19.7% |
|
Below 50% |
n.m. |
n.m. |
Another significant factor affecting Say on Pay vote results has been the vote recommendations of proxy advisory firms, with lower voting outcomes when companies do not receive support from the proxy advisory firms on their Say on Pay proposals. The factors generally used by these firms include level of CEO pay, program design and the use of non-performance based pay. These factors can drive an “Against” vote especially when in combination with poor TSR results. In 2013, only Comerica received an “Against” vote on Say on Pay from ISS, and they received 61% support compared to 93% support in 2012. In 2012, 3 companies received an “Against” vote recommendation from ISS, and the average support decreased by 34 percentage points. From 2011-13, ISS recommended shareholders vote Against the Say on Pay resolution at 8 of the companies reviewed. Each time the result was less than 80% support.
Given the growing importance placed on shareholder outreach regarding Say on Pay and executive pay programs, some of the companies (i.e., Morgan Stanley and Goldman Sachs) use supplemental filings as an additional outreach tool. In some cases, the large banks file supplementary soliciting materials pushing back on the voting recommendations of ISS or Glass Lewis. While the voting recommendations do not change, companies continue to push back on the proxy advisory firms when they believe they have strong programs.
Conclusion
Financial services firms will need to continue to strike the right balance between pay-for-performance and alignment among varying stakeholder perspectives. This is increasingly challenging for these companies as interests will conflict between shareholders, employees and the Federal Reserve. We expect to continue to see changes as companies balance these multiple constituencies.
Despite significant changes from large banks over the last 3 years (e.g. decreased upside on long-term performance plans, decreased emphasis on stock options or increased opportunity to make ex-post adjustments on deferred incentive awards), Say on Pay results have been strong from 2011-2013. We will continue to monitor how these risk-mitigating features are implemented by these banks as part of the Federal Reserve’s input and their effect on Say on Pay voting results.
- 1 Companies reviewed include: American Express, Bank of America, BNY Mellon, Citigroup, Capital One Financial, Discover Financial Services, Goldman Sachs, JP Morgan Chase, Morgan Stanley, Northern Trust, PNC, State Street, SunTrust Bank, US Bancorp, Wells Fargo, BB&T, Comerica, Fifth Third, Huntington Bancshares, KeyCorp, M&T Bank, Regions and Zions Bancorp.