


DOWNLOAD A PDF OF THIS REPORT pdf(0.4MB)
Contact
Roman BeleutaPartner [email protected] 646-532-5932 Kelly Malafis
Founding Partner [email protected] 212-921-9357 Robert Martin
[email protected] 212-921-9350
CAP periodically publishes a study on compensation for Chief Financial Officers (CFOs) relative to Chief Executive Officers (CEOs). Our analysis for fiscal 2019 compensation is based on a sample of 110 companies with median revenue of $13 billion. CFO total compensation continues to approximate one-third of CEO total pay. In this year's study, the increase in actual total compensation for both CEOs and CFOs slowed for the second consecutive year and was under 5% growth. This lower rate of change was driven primarily by decreased actual bonus payouts based on 2019 performance which were in line with lower top- and bottom line performance results among our sample companies. We expect the decrease in bonuses to continue for 2020 performance in light of the economic downturn resulting from the COVID-19 global pandemic.
Study Highlights
|
Pay Component |
Highlights |
|
Base Salary |
|
|
Bonuses |
|
|
LTI |
|
|
Total Compensation |
|
|
Pay Mix |
|
Study Results
Salaries
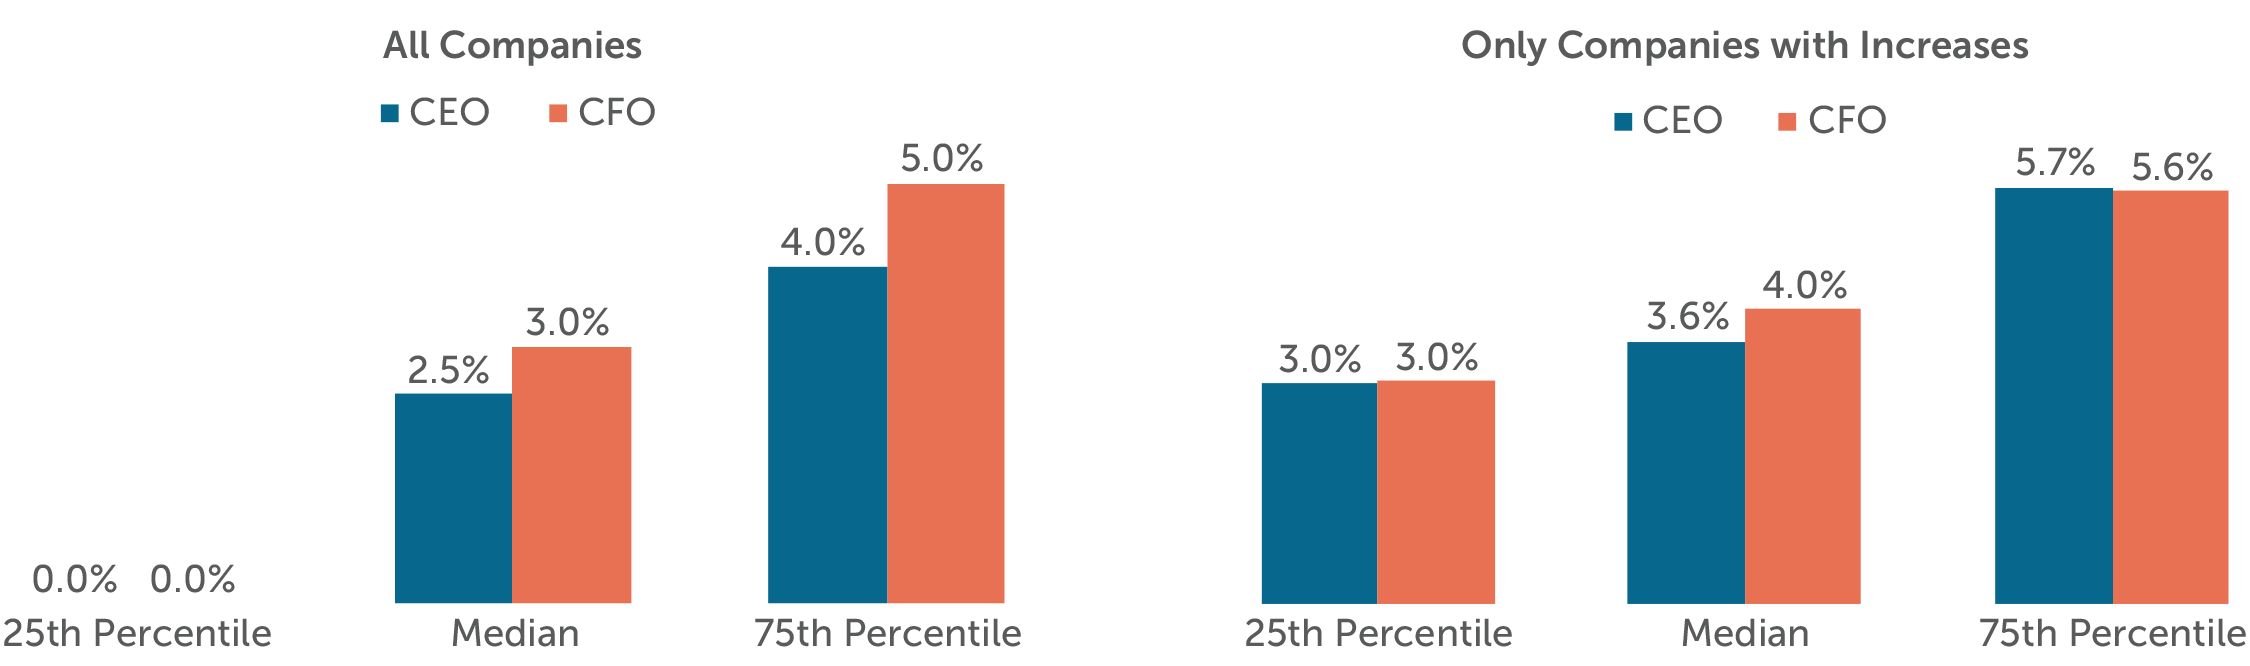
Since 2015, salary increase prevalence has been relatively consistent. In 2019, 54% of CEOs and 68% of CFOs received salary increases. The median 2019 salary increases were 2.5% for CFOs and 3.0% for CEOs for the total sample.
2019 Salary Increases
Changes in Actual Pay Levels
Salary increases have been trending upward for CEOs since 2017, while CFO salary increases hovered in the 3.0% to 3.5% range. LTI increases in 2019 were similar to 2018 and down slightly from 2017 increases. The median rate of actual total direct compensation change (4.4% for CEO and 3.6% for CFO) slowed for the second consecutive year. The slowdown in 2019 was driven by lower actual bonus payouts.
|
Median Percentage Change in Pay Components |
||||||
|
Pay Components |
2016 – 2017 |
2017 – 2018 |
2018 – 2019 |
|||
|
CEO |
CFO |
CEO |
CFO |
CEO |
CFO |
|
|
Salary |
0.6% |
3.1% |
2.0% |
3.5% |
2.5% |
3.0% |
|
Actual Bonus |
12.0% |
12.7% |
4.8% |
4.5% |
-2.2% |
-3.2% |
|
Long-Term Incentives |
8.1% |
10.3% |
6.5% |
8.7% |
6.1% |
8.3% |
|
Actual Total Direct Compensation |
10.9% |
9.9% |
5.8% |
7.4% |
4.4% |
3.6% |
Actual bonuses were lower in 2019, in line with slower growth in sales and operating income compared to 2018. In 2018 revenue and operating income growth both exceeded 9%, while 2019 growth was 3% and 5%, respectively. LTI grants are generally not tied to annual performance results so a disconnect is possible between bonus payout changes and LTI awards. However, the majority of LTI awards are performance-based, and payouts would vary based on long-term performance.
Median Total Compensation Increase by Industry1
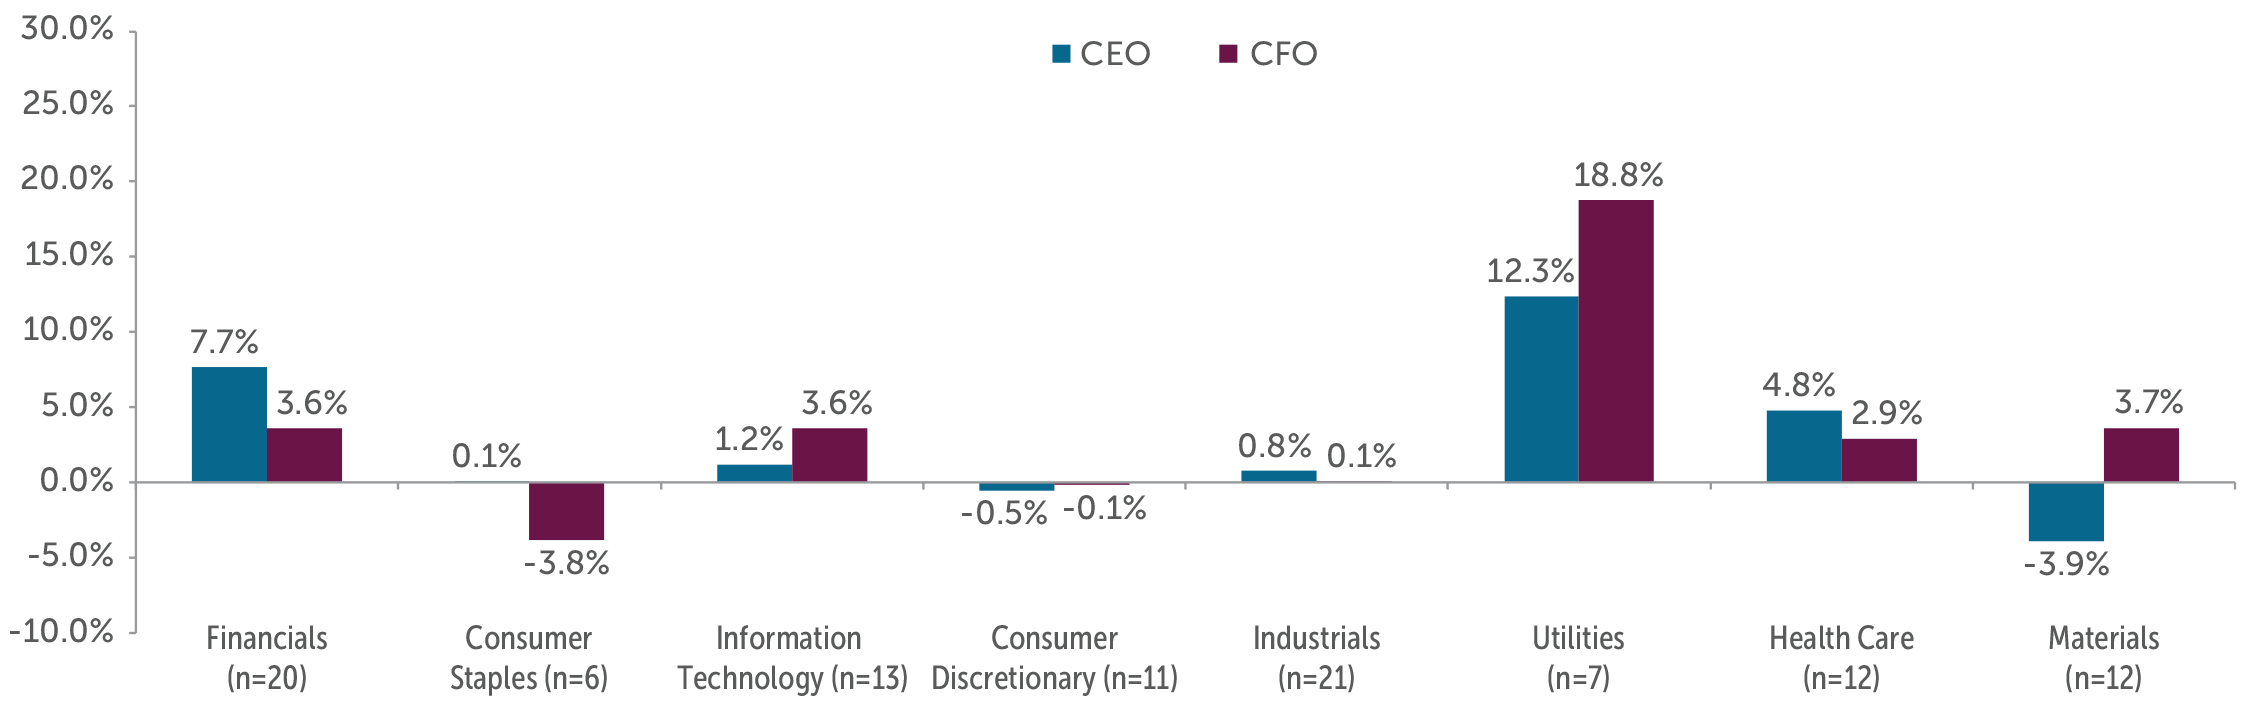
Median total direct compensation increases for the full sample are slower for the second consecutive year with variances by industry. In our 2018 update, all but two industries showed double-digit increases in total compensation for both CEOs and CFOs. This year, only the Utilities industry had double-digit increases.
Weakened manufacturing activity coupled with prolonged trade policy uncertainty led to many industries having depressed top and bottom-line financial growth year-over-year. The depressed financial growth led many industries to have a decrease in bonus payouts for 2019 compared to 2018. Despite bonus payouts being down from prior year, most companies saw growth in total compensation pushed by continued increases in target LTI grants.
In contrast to weakened manufacturing and trade, service sectors such as Utilities saw strong financial growth in 2019. Double digit total compensation increases in the Utilities sector were driven by sharp improvements in operating income growth of +7% in 2019 compared to -8% in 2018.
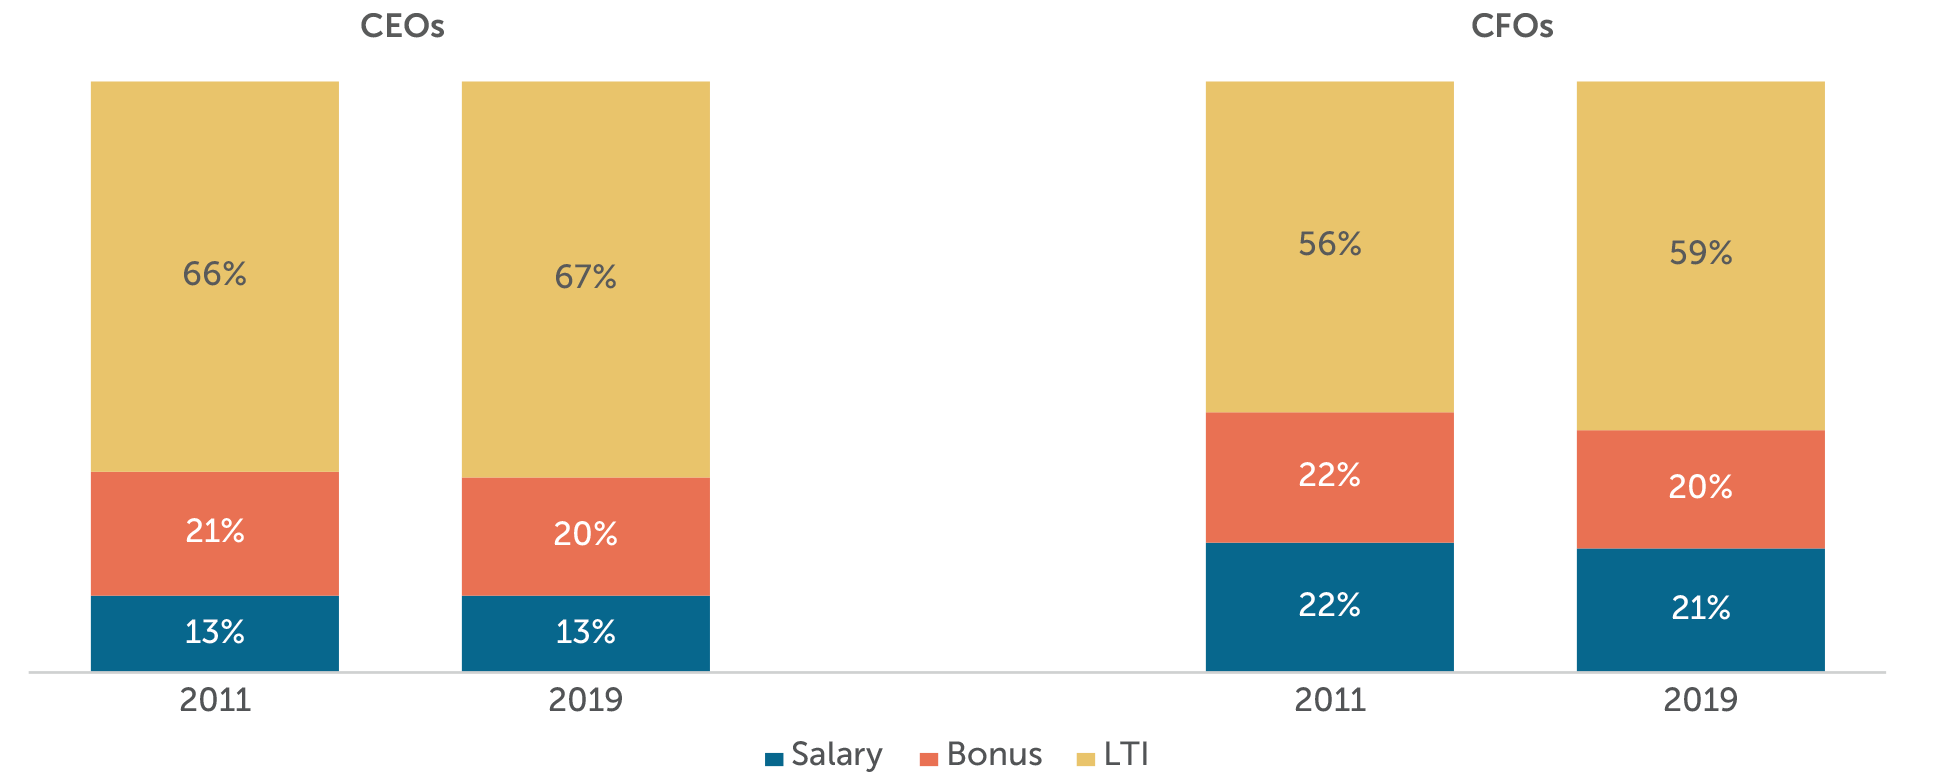
Target Pay Mix
The structure of the overall pay program (salary, bonus, LTI) has remained largely unchanged since 2011. CEOs continue to receive less in the form of salary and more in variable pay opportunities, especially LTI, than CFOs.
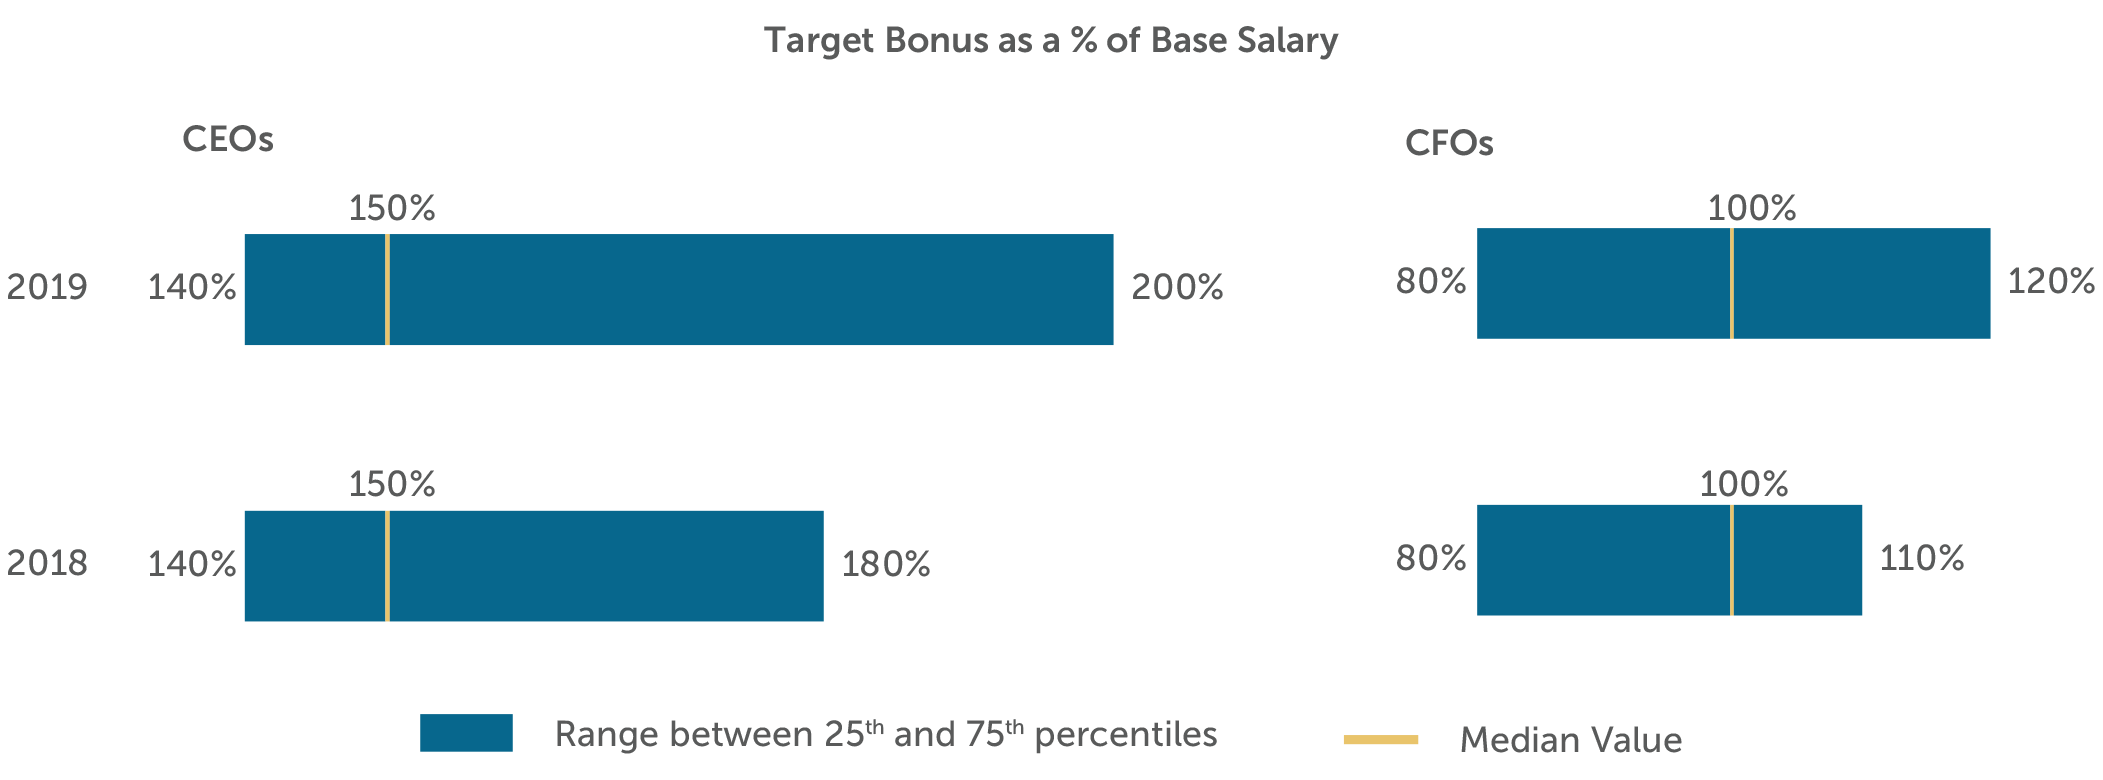
Target Bonuses
Target bonuses as a percentage of salary remained unchanged at 25th percentile and median, and increased at the 75th percentile. We expect target bonus levels to remain steady.
Long-Term Incentive (LTI) Vehicle Prevalence and Mix
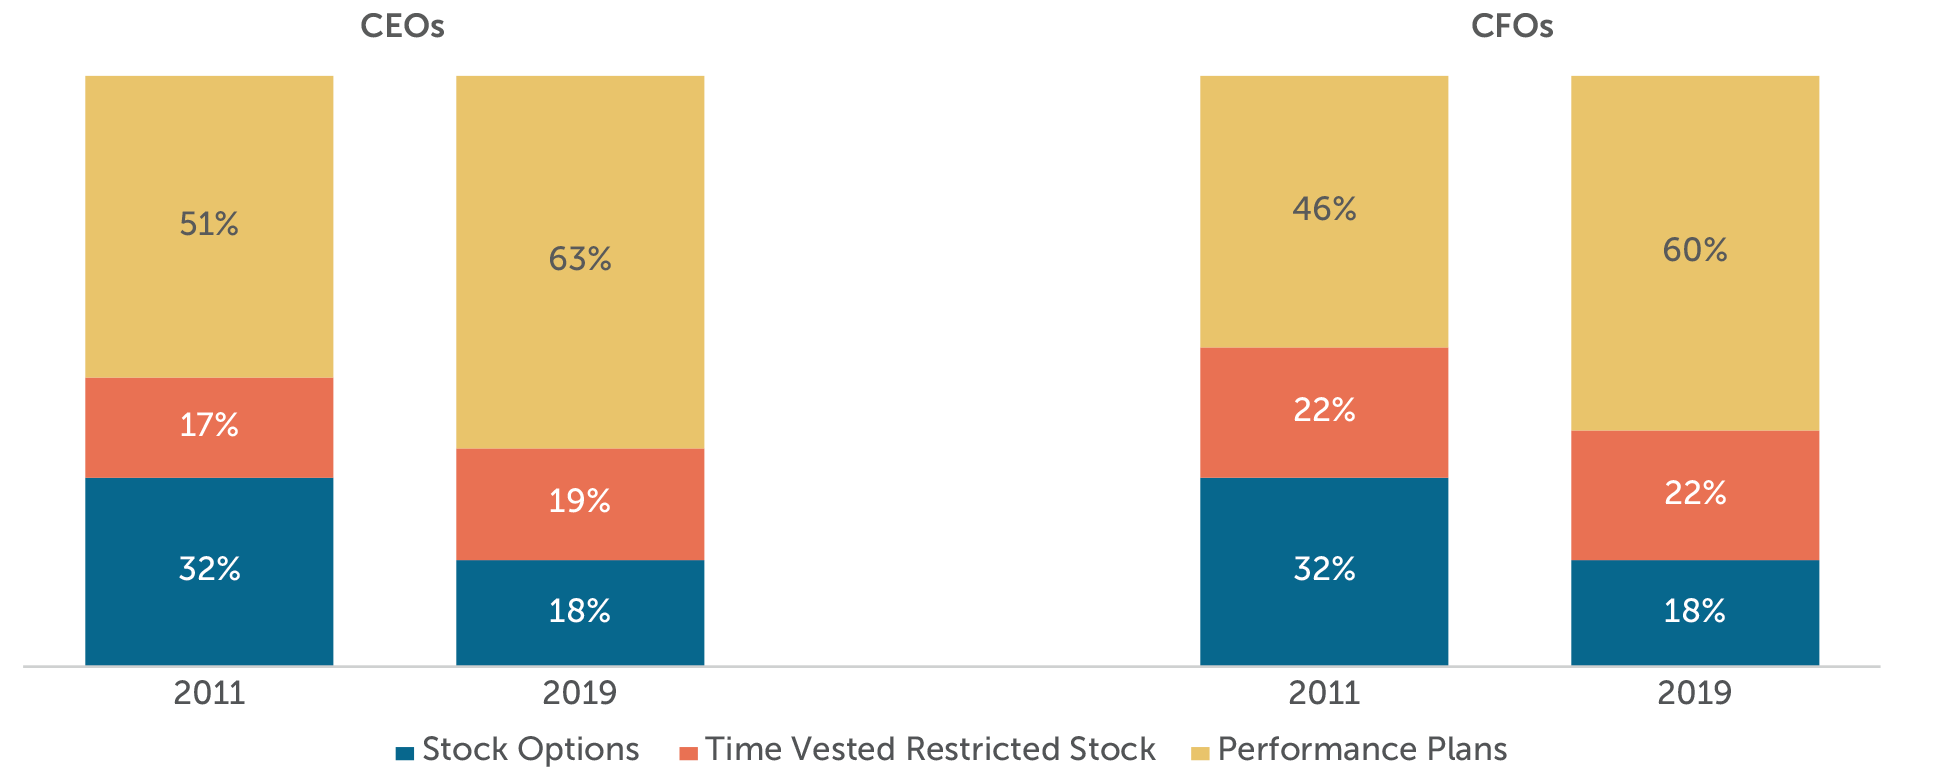
Prevalence of performance plans continued to increase in 2019. The use of two different vehicles to deliver LTI remains the most prevalent approach and approximately 33% of companies studied use all 3 equity vehicles (stock options, time-based stock awards, and performance plan awards).
Performance plans account for nearly 60% of LTI awards on average among the companies studied. The other portion of LTI is delivered through an almost equal mix of stock options and time-vested restricted stock awards.
Conclusion
Weaker financial performance in 2019 led to lower bonus payouts compared to 2018 and contributed to the second year of slowing growth of total compensation for both CEOs and CFOs. Higher tariffs and trade policy uncertainty contributed to declines in manufacturing and industries reliant on global trade. The outcomes in 2019 (i.e., lower bonus payouts on weakened absolute financial performance) reinforces that boards and senior management continue to emphasize the alignment of pay outcomes with company performance. With the COVID-19 pandemic and resulting economic turmoil in 2020, we expect to see even lower bonus payouts in 2020. Since many companies made their equity grants early in 2020, prior to the impact of the pandemic on the stock market, we may not see the pandemic’s impact on LTI levels until the 2021 grants are disclosed.
Since 2011 performance-based LTI plans have increased about 13% for both CEOs and CFOs with a similar drop in the prevalence of stock options, and time-vested stock being relatively the same. With the difficulty of setting goals in the time of a global pandemic, we expect to see an increase in time-based awards for grants approved after the pandemic started. This may be a short-lived shift as we expect the focus on executive pay with long-term shareholder value and performance will continue to be important.
Appendix
Sample Screening Methodology
Based on the screening criteria below, we arrived at a sample of 110 public companies with median 2019 revenue of $13B.
|
Revenue |
At least $5 billion in revenue for fiscal year 2019 |
|
Fiscal year-end |
Fiscal year-end between 9/1/2019 and 1/1/2020 |
|
Proxy Statement Filing Date |
Proxy statement filed before 3/31/2020 |
|
Tenure |
No change in CEO and CFO incumbents in the past three years |
|
Industry |
All industries have been considered for this analysis |
1 Excludes industries which had a sample of less than five companies. Total compensation equals the sum of base salary, actual bonuses, and LTI awards granted in 2019.