


DOWNLOAD A PDF OF THIS REPORT pdf(0.3MB)
Contact
Daniel LaddinFounding Partner [email protected] 212-921-9359 Matthew Vnuk
Partner [email protected] 212-921-9364 Roman Beleuta
Principal [email protected] 646-532-5932
Each year CAP analyzes non-employee director compensation programs among the 100 largest companies. These companies generally provide early insights into potential trends in terms of compensation practices. This report focuses on a summary of pay levels and pay practices trends based on 2018 proxy disclosure.
CAP Findings
Board Compensation
pay levels increased modestly
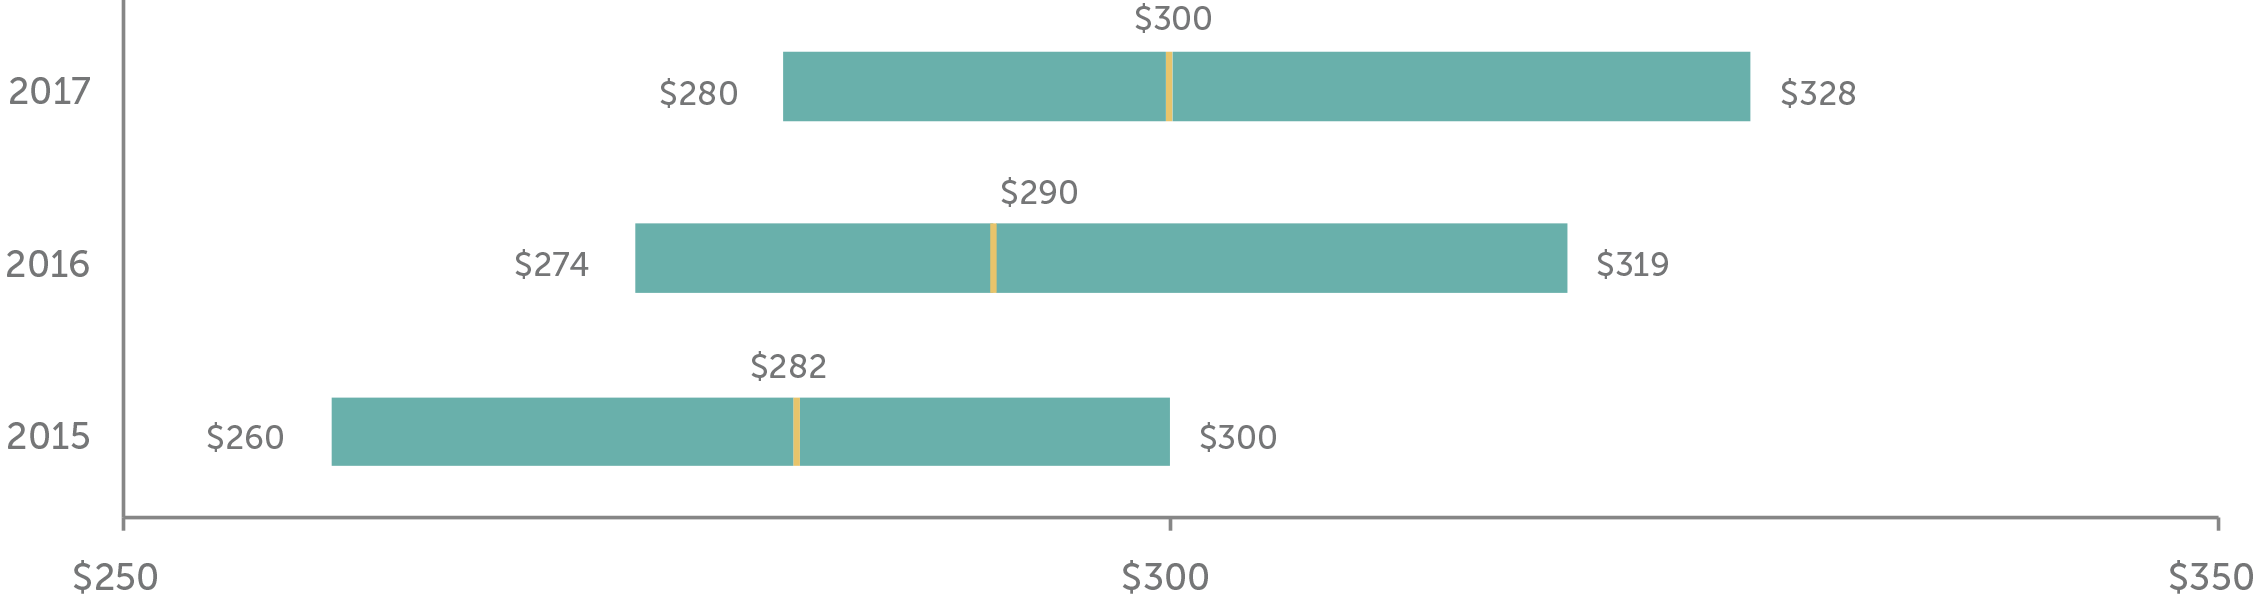
- Total Fees. Board compensation has been in a steady state with low single-digit annual increases – we expect this to continue to be the norm. Median is now $300K, up from $290K last year, a 3.4% increase.
- Retainers. Companies rely mainly on annual retainers (cash and equity) to compensate directors. Pay programs for large companies are simple and tend to rely less on meeting fees or committee member retainers.
- Meeting Fees. Paid by 12 of the 100 companies, consistent with prior years. Most companies have moved to a fixed retainer pay structure, with a component in cash and a component in equity. We support this approach as it simplifies administration and the need to define what counts as a meeting. However, companies may want to consider having a mechanism for paying meeting fees if the number of meetings in a single year far exceeds the norm (“hybrid approach”). Consistent with prior year, five companies in our dataset used this hybrid approach to meeting fees, with the threshold ranging between 6 and 10 meetings.
- Equity. 99 companies used full-value awards (shares/units) and only 6 used stock options (5 used both vehicles). Almost all companies denominated the equity awards in terms of a fixed value, versus a fixed number of shares, which is considered best practice as it manages the value awarded each year.
- Pay Mix. On average, total pay is comprised of 61% equity and 39% cash, consistent with as last year.
- Process: 24% of companies disclosed increases to board cash and/or equity retainers versus prior year.
Committee Member1 Compensation
prevalence continues to slowly decline
- Overall Prevalence. 44% of companies paid member fees for Audit Committee service, 31% paid member fees for Compensation Committee service, and 28% paid member fees for Nominating/Governance Committee service. Companies rely more on board-level compensation to recognize committee member (non-chair) service, with the general expectation that all independent directors contribute to committee service needs.
- Total Fees. Of the companies that paid committee member compensation, the median was $16K.
Committee Chair1 Compensation
no change
- Overall Prevalence. More than 90 percent of companies provided additional compensation to committee Chairs to recognize additional time requirements, responsibilities, and reputational risk.
- Fees. Median additional compensation remained $25K for Audit Committee Chairs, $20K for Compensation Committee Chairs, and $15K for Nominating/Governance Committee Chairs. Most often the extra fees were delivered through an additional cash retainer and not meeting fees.
Independent Board Leader Compensation
little/no change
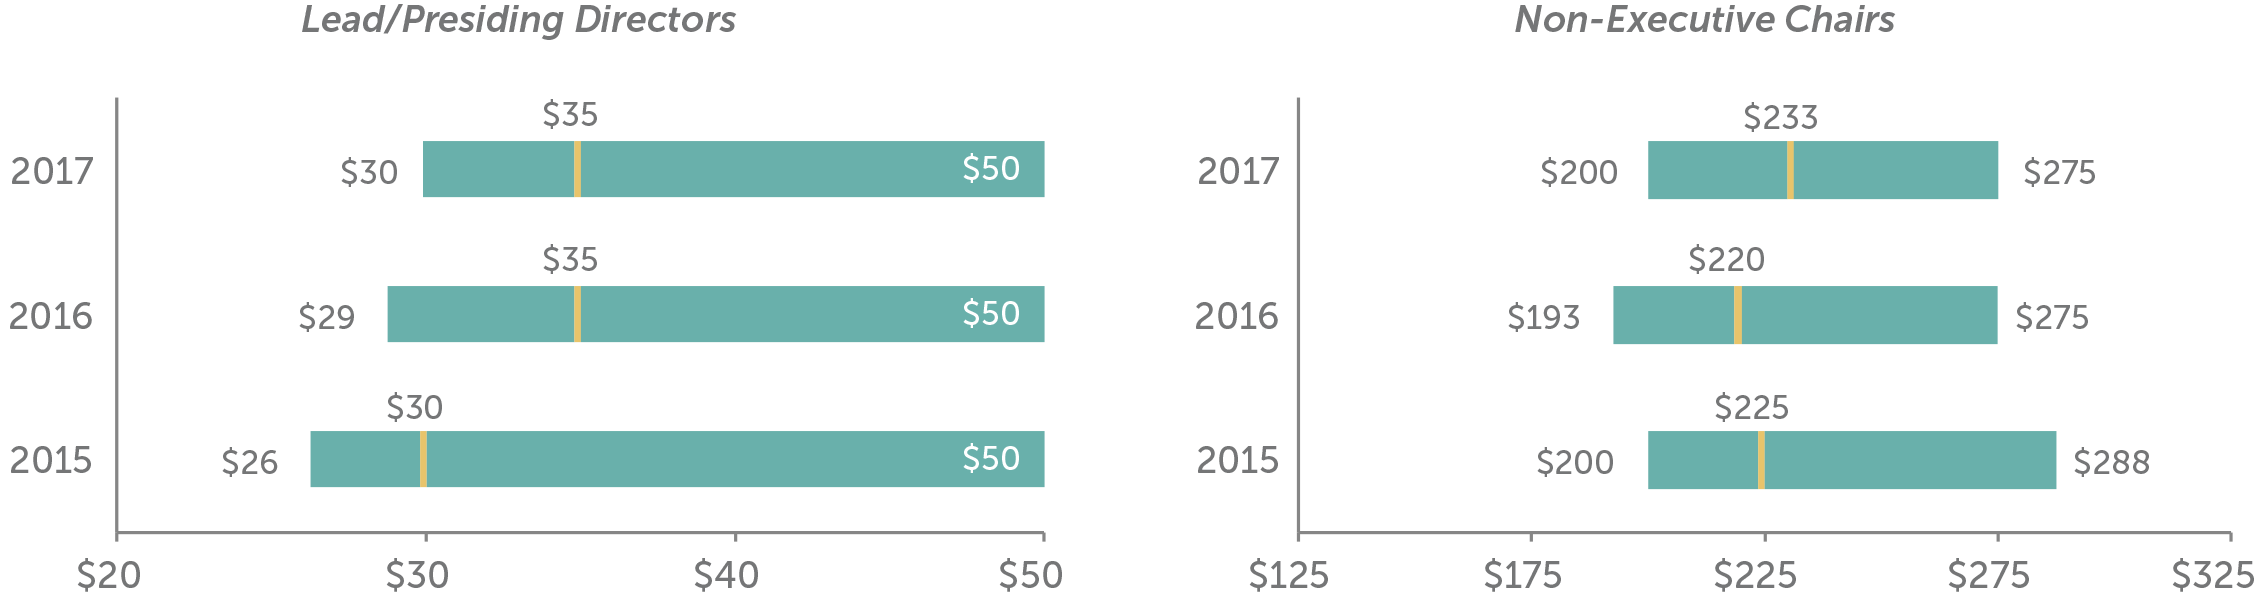
- Non-Exec Chair. Additional compensation is provided by nearly all companies with this role. Median additional compensation is $233K. As a multiple of total Board Compensation, total Board Chair pay is 1.8x a standard Board member, at median
- Lead Director. Median additional compensation is $35K, same as prior year. Additional compensation is provided by nearly all companies with this role2. The differential in pay versus non-executive Chairs is in line with typical differences in responsibilities.
Pay Limits
now majority practice
- As a result of litigation (e.g., Investors Bancorp), 54 percent of the largest 100 companies now have an award limit for director compensation, up from 47 percent in the prior year.
- The limits are largely due to advancement of litigation where the issue has been that directors approve their own annual compensation and are therefore deemed to be inherently conflicted.
- Limits range from $250K to $4.75 million, with a median limit of $750K. Companies that denominate the limit in shares tend to have a higher dollar-equivalent limit, with a median of $1.1M. The median for the companies with value-based limits is $600K.
Limit Range Prevalence <= $500,000 28% $500,001 – $1,000,000 48% $1,000,001 – $2,000,000 18% > $2,000,001 6% - The limits tend to be much higher than annual equity grants.
Limit Multiple Range Prevalence <= 3x annual equity 30% 3.01x – 5x annual equity 33% 5.01x – 7x annual equity 22% > 7x annual equity 15% - Limits typically apply to just equity-based compensation; however, some companies have applied the limits to both cash and equity-based compensation (i.e., total pay) and we anticipate the prevalence of this practice will increase. Other companies exclude initial at-election equity awards, committee Chair pay, and/or additional pay for Board leadership roles from the limit.
Appendix

Total Board Compensation ($000s)3
Additional Compensation for Independent Board Leaders ($000s)
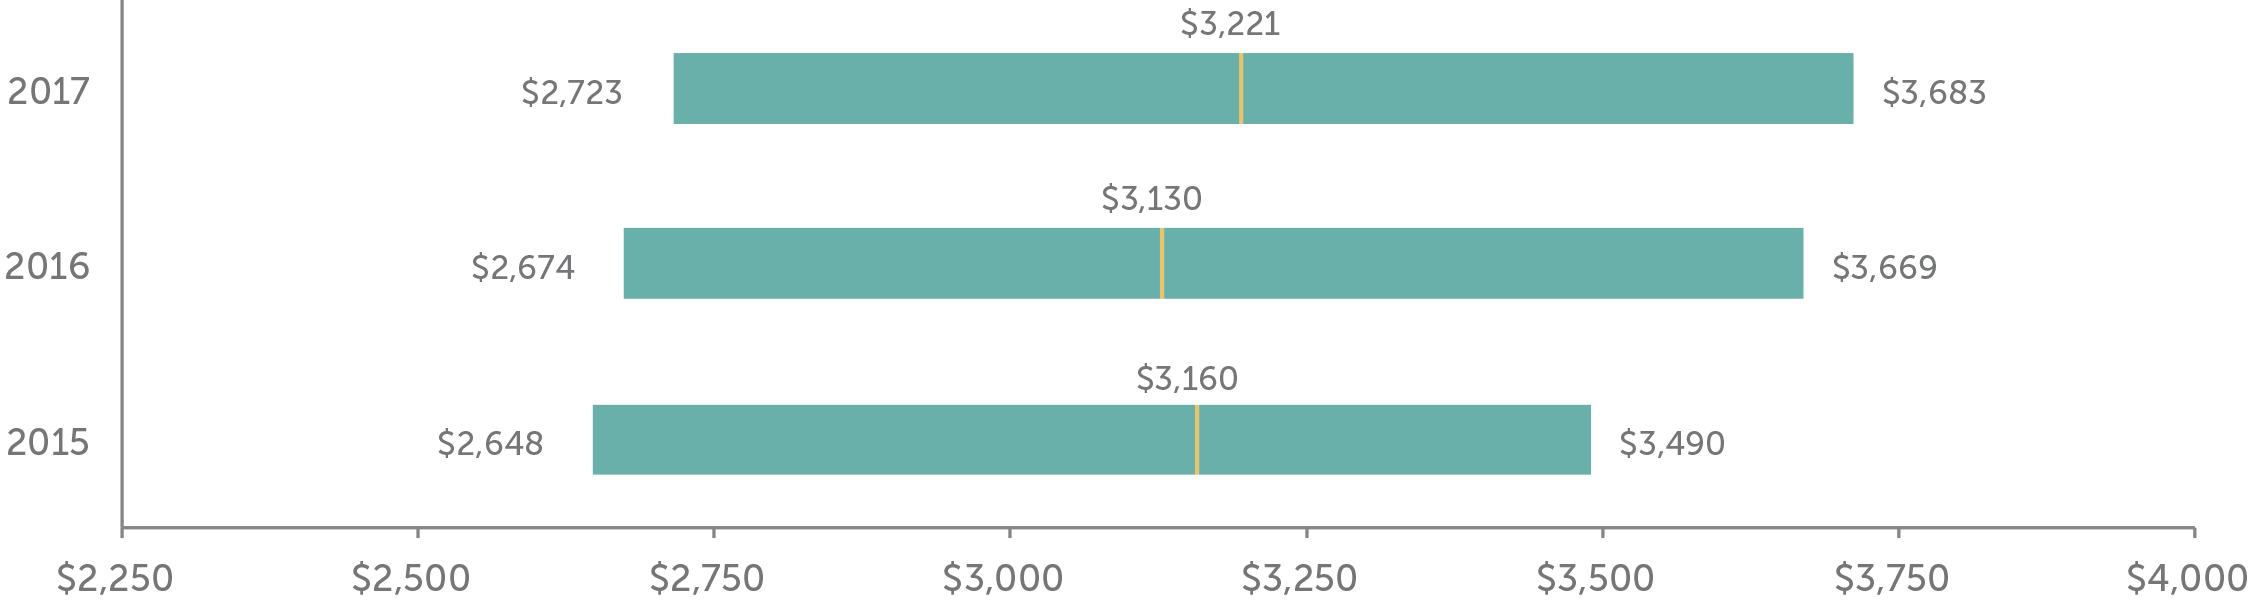
Total Company Cost for Board Service ($000s)
1 Audit, Compensation and/or Nominating and Governance committees.
2 Excludes controlled companies. Also excludes instances where Lead Director role is assumed by Chair of Nominating and Governance Committee, who receives compensation for the role.
3 Total Board Compensation reflects all cash and equity compensation for Board and committee service, excluding compensation for leadership roles such as committee Chair, Lead/Presiding Director, or non-executive Board Chair.


