

Compensation Advisory Partners (CAP) reviewed executive compensation pay levels and trends at 50 companies (Early Filers) that filed their most recent proxy statement between November 2018 and January 2019 (fiscal year ends from July 2018 to October 2018; 37 companies have September 30 fiscal year ends). Industry sectors reviewed include: Consumer Discretionary, Consumer Staples, Financials, Health Care, Industrials, Information Technology and Materials. Among these 50 companies, median Revenue was $8.3B, median Market Capitalization (based on each company’s fiscal year-end) was $13.5B and 1-year Total Shareholder Return, or TSR, based on each company’s fiscal year-end was 8.0%.
Overall Findings
Performance: 2018 performance (based on Revenue, Pre-tax Income, EPS and 1-year TSR) continued to be strong. Revenue (11% growth), Pre-tax Income (12% growth) and EPS (25% growth) were up by double digits and TSR was up 8%.
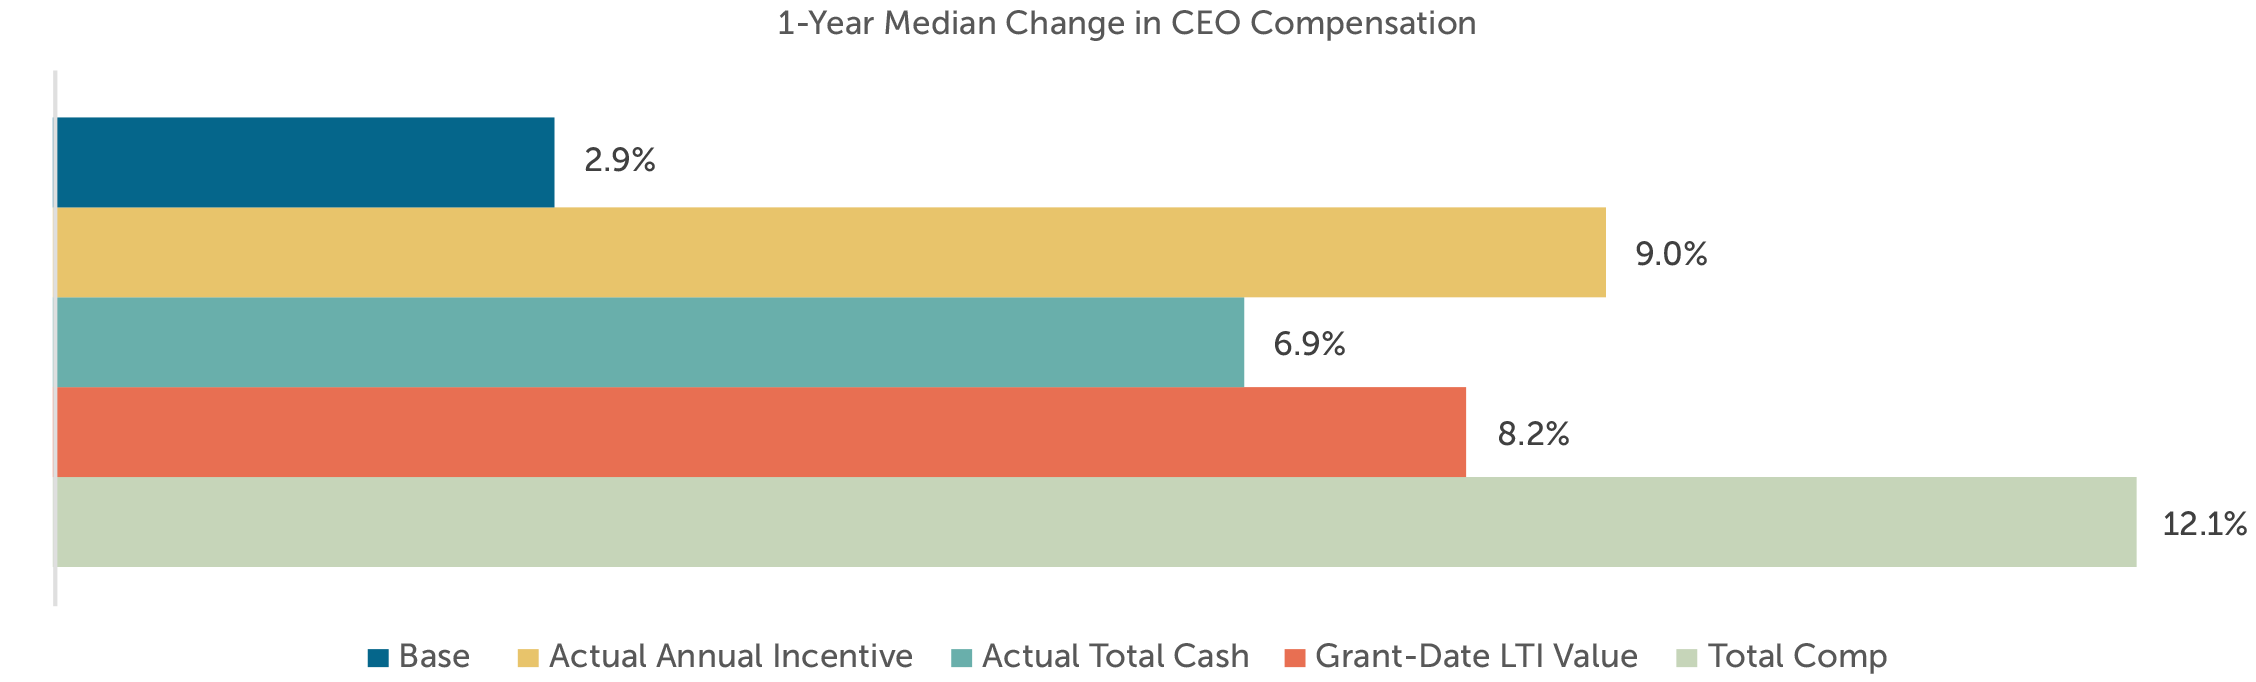
CEO Pay: Median CEO pay increased by 12% mainly driven by higher actual annual incentive payout (+9%) and grant date value of long-term incentives (+8%).
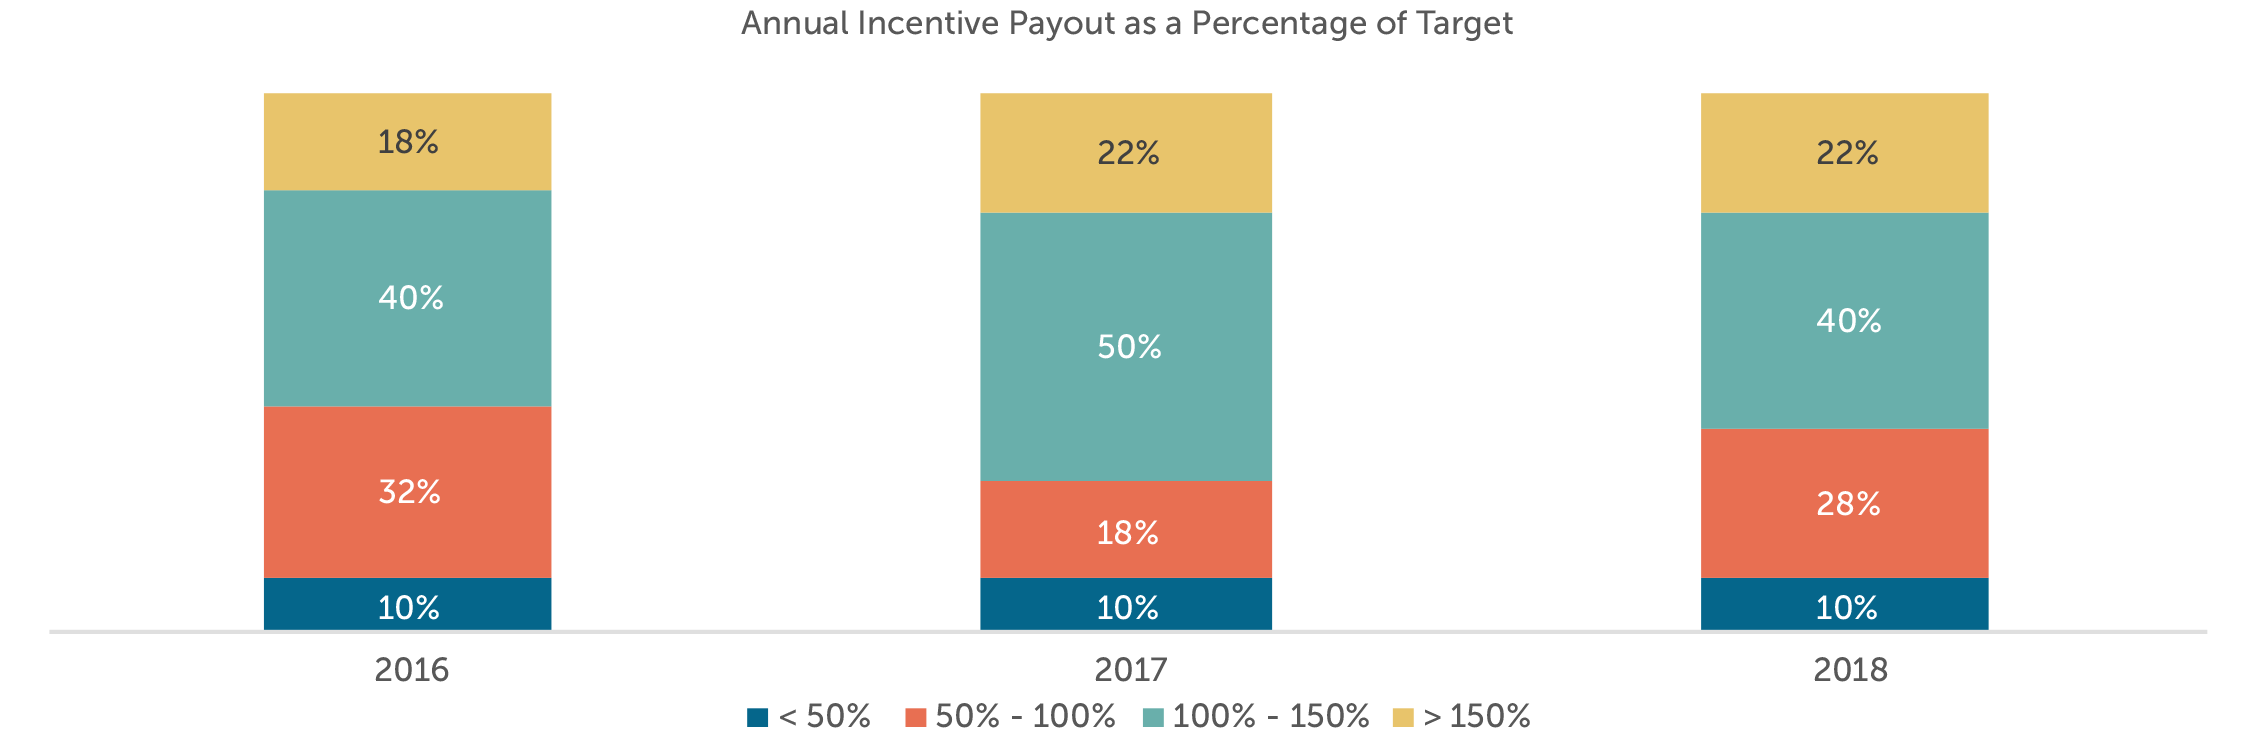
Annual Incentive Payout: Overall, median 2018 annual incentive payout was 114% of target reflecting strong financial performance.
2018 Performance
CAP reviewed Revenue, Pre-tax Income, EPS and TSR performance for the Early Filers and the S&P 500. 2018 median performance continued to be strong. Median financial performance among the Early Filers was generally similar to that of the S&P 500.
- Median Revenue and Pre-tax Income growth was 11% and 12%, respectively
- EPS growth, at median, was up nearly 25% impacted largely by the Tax Cuts and Jobs Act; tax reform was signed into law in Q1/Q2 of 2018 for Early Filers (vs. Q4 2017 for calendar year companies)
- Median TSR was up 8% from 2017
|
Financial Metric (1) |
2017 Median 1-year Performance |
2018 Median 1-year Performance |
||
|
S&P 500 |
Early Filers |
S&P 500 |
Early Filers |
|
|
Revenue Growth |
6.1% |
6.0% |
8.6% |
11.4% |
|
Pre-tax Income Growth |
7.5% |
10.8% |
11.5% |
11.9% |
|
EPS Growth |
10.4% |
9.2% |
18.3% |
24.7% |
|
TSR |
17.7% |
19.7% |
12.0% |
8.0% |
Reflects companies in the S&P 500 as of February 2019. For the S&P 500, financial performance and TSR are as of September 30, 2017 and September 30, 2018. For Early Filers, financial performance and TSR are as of each company’s fiscal year end.
CEO Total Direct Compensation
CAP reviewed the year over year change in CEO pay for Early Filers with CEOs in their role for at least two years (n=45). Among these companies, median total direct compensation increased 12% in 2018. This increase was driven by higher incentive compensation in 2018 vs. 2017. Actual annual incentive payout was up 9% reflective of both strong performance and an increase in target bonus opportunities (up 4% from 2017). The grant-date value of LTI was up 8% in 2018. Median base salaries increased by 3% unlike last year when CEO salary was flat; salary increases generally ranged from 2 – 5%, with a handful of companies providing increases above 10%.
Annual Incentive Plan Payout
Median actual annual incentive payout in 2018 was 114% of target, the same as last year. In 2018, however, 25th and 75th percentile payouts (74% and 139% of target, respectively) were lower than 2017 suggesting that 2018 performance was strong, but not as strong as 2017.
|
Summary Statistics |
Annual Incentive Payout as a % of Target |
||
|
2016 |
2017 |
2018 |
|
|
75th Percentile |
135% |
147% |
139% |
|
Median |
106% |
114% |
114% |
|
25th Percentile |
86% |
96% |
74% |
Companies with at or above target bonus payouts had double-digit growth in Revenue (14%), Pre-tax Income (21%) and TSR (14%) in 2018, which was substantially stronger than companies with below target payouts.
|
Financial Metric (1) |
2017 Median 1-year Performance |
2018 Median 1-year Performance |
||
|
Below target payout (n=14) |
At/above target payout (n=36) |
Below target payout (n=19) |
At/above target payout (n=31) |
|
|
Revenue Growth |
4.5% |
6.6% |
8.1% |
14.0% |
|
Pre-tax Income Growth |
1.4% |
13.6% |
(6.3)% |
20.5% |
|
TSR |
1.6% |
25.1% |
(7.2)% |
14.1% |
(1) Financial performance and TSR is as of each company’s fiscal year end.
In 2018, approximately 60% of Early Filers had above target annual incentive payouts which is lower than 2017 (72% of companies).
Emerging Governance Issues: Gender Diversity
Diversity, gender diversity in particular, has become an area of focus among shareholders and proxy advisory firms. A handful of investors are addressing these issues by submitting shareholder proposals requesting companies to publicly disclose the pay disparity between men and women. These proposals, to-date, have not received majority support, although some companies have disclosed or committed to disclosing gender pay disparities. Other investors have focused on representation, particularly among the board of directors. Institutional Shareholder Services (ISS) and Glass Lewis each disclosed a policy update (effective beginning 2020 for ISS and 2019 for Glass Lewis) whereby each firm will recommend a vote “Against” a Nominating and Governance Committee Chair if there is no female director on the board. Additionally, ISS will begin including gender diversity among the Named Executive Officer group as part of each company’s QualityScore beginning in 2019.
Among our Early Filers, all companies have at least one female director on the Board with most having two or three women directors. However, approximately 30% of these organizations have either one or no women among their senior most executive group.* Diversity and inclusion will continue to be a hot topic in the coming years and momentum for this change in increasing. Some state and local governments have enacted legislation to improve gender pay disparity and female board of director representation.
Conclusion
2018 was another strong financial performance year for Early Filers which translated to median bonus payout of 114% of target for the second year in a row. Total compensation for CEOs in our sample increased by 12% year over year due to increases in annual bonus payout and the grant-date value of long-term incentives. 2019 has begun with a somewhat uneven start with uncertainty around global trade, a month-long U.S. government shutdown and Brexit.
* Based on executive teams as disclosed on company websites in January 2019.