Never fall behind on the latest trends in CEO pay ratio with CAP’s CEO Pay Ratio Tracker. The CEO Pay Ratio Tracker uses each company’s most recent pay ratio disclosure.
Data effective: June 1, 2022
Revenue and Market Cap Filters
- Select the desired Revenue and Market Cap scopes using the text boxes
Sector Breakdown Chart
- Chart shows the sector breakdown for companies within the selected Revenue and Market Cap scopes
- Hover over each section to see the percentage and number of companies in each sector
- Click on each section to show pay ratio data for only that sector
- Select multiple sectors by holding down the Ctrl key
- Click the center of the Sector Breakdown chart to reset to all companies
- The number of companies in the selected scope will show in the center of the Sector Breakdown chart
Pay Ratio – Percentiles Chart
- Chart shows pay ratio data for companies in the selected sector and Revenue and Market Cap scopes
- When a sector is selected, bolded bars show data just for that sector and lighter bars show data for all companies within the selected Revenue and Market Cap scopes
For questions or more information, please contact: Ryan Colucci Principal [email protected] 646-486-9745 or Kyle White Senior Analyst [email protected] 646-568-1161.
Click here to read more about new factors impacting the CEO Pay Ratio Disclosure in 2021 and beyond: https://www.capartners.com/cap-thinking/2021-ceo-pay-ratio-disclosure-new-considerations-and-expectations/.
The COVID-19 pandemic dealt an unexpected blow that pushed a number of companies into bankruptcy. The impact of pandemic-related shutdowns was broad: Companies in a diverse range of industries – including retail, oil and gas, consumer goods, restaurants, and entertainment and recreation – filed for Chapter 11 bankruptcy protection in the first half of 2020. While the number of filings has not yet reached the level seen in the 2008 financial crisis, the number of bankruptcies is expected to rise through the remainder of the year.
The 2020 surge in bankruptcies has been accompanied by heightened scrutiny of executive pay in restructuring situations. Bankruptcy filings are often preceded by announcements of executive retention and other short-term performance-based awards. These awards can draw criticism as excessive and even inappropriate given the impact of bankruptcy on shareholders and the broader employee population. However, 2020 is unique. While situations vary by industry, most agree that this flurry of bankruptcy filings is not the result of poor management but rather the inevitable impact of unprecedented and unforeseeable broad shutdowns across the country to contain the pandemic. The companies entering bankruptcy need continuity, stability, and motivated leadership. Carefully designed and communicated retention and performance awards can play an important role in keeping leadership in place and focused on moving the company through the restructuring process.
The Evolution of Prepaid Awards
Corporate bankruptcies cause a significant amount of uncertainty for executives and employees, who can be tempted to leave for more stable work situations with predictable, secure compensation streams. Poor company performance means that annual incentives are unlikely to pay out, and equity holdings lose almost all value. In situations where shareholders need to retain executives through the bankruptcy period, cash retention awards to critical members of management can be effective by providing compensation stability. These programs are often called Key Executive Retention Programs (KERPs).
Executive retention awards in bankruptcy situations today have a unique design: they are paid before the bankruptcy filing and are subject to clawback provisions. Clawback provisions are triggered if the executive terminates employment during a specified time period or is terminated for cause. In addition, some clawbacks are tied to performance goals not being achieved. If triggered, the clawback provisions require executives to pay back the after-tax award value. The fact that the awards are prepaid differentiates them from most other cash incentives and makes them the subject of criticism and misunderstanding.
The Evolution of Prepaid Executive Retention Awards in Bankruptcies

The unique design for executive retention awards emerged from changes to the U.S. bankruptcy code made through the Bankruptcy Abuse Prevention and Consumer Protection Act of 2005 (BAPCPA). Prior to BAPCPA, a large portion of executive compensation in bankruptcy situations was delivered through retention awards. Executive retention awards were typically paid out in a lump sum or through several payments based on the executive’s continued employment. Executive retention awards also had special status in the bankruptcy proceedings that ensured payment ahead of many other company obligations. As a result of the special status and lack of performance features, executive retention awards were not viewed favorably.
BAPCPA imposed stringent restrictions on awards to “insiders” implemented during the bankruptcy process that are based solely on retention and that lack performance features (“Insiders” are defined as directors, officers, individuals in control of the corporation, and relatives of such individuals). BAPCPA’s restrictions effectively stopped the use of executive retention awards once companies file for bankruptcy. Despite BAPCPA, executive retention awards eventually re-emerged – as prepaid awards subject to clawbacks. By paying the awards before the bankruptcy filing, companies can generally avoid the BAPCPA restrictions and avoid having the award subject to Bankruptcy Court approval.
Prevalent Executive and Employee Pay Practices during Bankruptcy
CAP analyzed the 8-K filings of a number of companies that entered bankruptcy in 2020. Based on this analysis, companies today often use a mix of compensation programs to retain and motivate executives and employees leading up to, and during, the bankruptcy process:
- Pre-filing, prepaid executive retention awards
- Performance-based Key Employee Incentive Plans (KEIPs)
- Employee retention and incentive programs
Pre-Filing, Prepaid Executive Retention Awards
A number of companies that filed for bankruptcy during 2020 announced prepaid retention awards for executives anywhere from days to months before the legal filing. The 8-K filings indicate that the prepaid retention awards are designed by the board with advice from compensation consultants, as well as bankruptcy and other advisors. Typical design parameters for executive retention bonus awards include:
|
Participation: |
CEO, other key executives and officers |
|
Objectives: |
Retain key employees before and during the bankruptcy proceedings |
|
Award Value: |
|
|
Form of Payment and Timing: |
Awards are made in cash, prepaid in a lump sum prior to the bankruptcy filing |
|
Clawback Provisions: |
Executives must repay the awards, net of taxes, if they 1) Terminate employment prior to the earlier of a specified period or the conclusion of the bankruptcy period, or 2) Are terminated by the company for cause |
|
Clawback Period: |
Most often one year |
While less common, some companies, including Chesapeake Energy and Ascena Retail Group, include base-level performance criteria in the clawback provisions to add a performance element to the prepaid retention awards. This improves the overall optics of such awards and helps avoid additional scrutiny during bankruptcy.
|
Select Pre-Filing Retention and Incentive Programs |
||||||
|
Company |
Revenue FY2019 ($000s) |
Industry |
Bankruptcy Date |
Program |
Award Term |
Description |
|
J.C. Penney |
$12,019 |
Retailing |
5/15/2020 |
Retention & Incentive |
0.6Y |
Adopted a prepaid cash compensation program equal to a portion of NEO annual target variable compensation; NEO awards ranged from $1M to $4.5M; clawbacks are tied 80% to continued employment through January 31, 2021, and 20% to milestone-based performance goals |
|
Retention |
1.6Y |
Accelerated the earned 2019 portion of three-year long-term incentive awards ($2.4M for NEOs); clawbacks are tied to continued employment through January 31, 2022 |
||||
|
Hertz Global Holdings |
$9,779 |
Transportation |
5/22/2020 |
Retention |
0.8Y |
Cash retention payments to 340 key employees at the director level and above ($16.2M in aggregate); NEO awards ranged from $190K to $700K; clawbacks tied to continued employment through March 31, 2021 |
|
Chesapeake Energy |
$8,408 |
Energy |
6/28/2020 |
Retention & Incentive |
1.0Y |
Executives: Prepaid 100% of NEO and designated VP target variable compensation ($25M in aggregate for 27 executives) based 50% on continued employment and 50% on the achievement of specified incentive metrics Employees (retention only): Converted annual incentive plan into a 12-month cash retention plan paid quarterly, subject to continued employment |
|
Ascena Retail Group |
$5,493 |
Retailing |
7/23/2020 |
Retention & Incentive |
0.5Y |
Executive and Employee Retention and Performance Awards: Six-month cash award for NEOs (NEO awards ranged from $600K to $1.1M), 3 other executives, and employees who are eligible for the company’s incentive programs based 50% on continued employment through Q4 2020 and 50% on performance; award amounts are based on a percentage of annual and long-term incentive targets Earned Performance-Based LTIP Awards: Accelerated earned 2018 and 2019 performance-based cash awards for all employees ($1.1M for 2 NEOs), subject to continued employment through August 1, 2020 for the 2018 award and August 3, 2021 for the 2019 award |
|
Whiting Petroleum |
$1,572 |
Energy |
4/1/2020 |
Retention |
1.0Y or Chapter 11 Exit |
NEO awards were prepaid and ranged from $1.1M-$6.4M; clawbacks are based on termination of employment before the earlier of March 30, 2021, or Chapter 11 exit; employees receive quarterly cash awards that in aggregate may not exceed that employee’s target annual and long-term incentive compensation |
|
GNC Holdings |
$1,446 |
Food, Beverage and Tobacco |
6/23/2020 |
Retention |
1.0Y |
Cash exit incentive awards for key employees (including executives) based 75% on the Company’s exit from bankruptcy and 25% on the 60th day following an emergence event that occurs on or prior to June 23, 2021. Prepaid NEO awards ranged from $300K to $2.2M |
|
Diamond Offshore Drilling |
$935 |
Energy |
4/26/2020 |
Retention |
1.0Y |
Past Executive Long-Term Cash Incentives: Payment of a portion of past three-year cash incentive awards was accelerated for retention; awards are subject to clawbacks based on termination of employment for one year; NEO payouts ranged from $140,208 to $1.75 million. Other Plans: The Company announced a Key Employee Incentive Plan, a Non-Executive Incentive Plan and a Key Employee Retention Plan, which are all subject to approval by the Bankruptcy Court |
Performance-Based Key Employee Incentive Plans (KEIPs)
After BAPCPA, KEIPs emerged to provide incentives to executives without running afoul of the bankruptcy code. KEIPs, which are approved during the bankruptcy process, are performance-based incentives that pay out in cash based on the achievement of financial and operational goals. The goals can be very short-term in nature, such as quarterly performance periods.
Typical design parameters for KEIPs include:
|
Participation: |
CEO, other key executives and officers (ultimately those designated as “insiders” in the bankruptcy proceeding) |
|
Objectives: |
Incentivize key executives before, but primarily during, the bankruptcy proceedings |
|
Award Value: |
|
|
Form of Payment and Timing: |
|
A current trend is to design and implement the KEIP prior to filing. This is especially true in pre-packaged bankruptcies where the financial reorganization of the company is prepared in advance in cooperation with its creditors. Having these programs in place with payouts contingent on performance improves continuity throughout the entire process, incentivizes the management team to perform, and meets the court’s requirement that any variable compensation to executives be performance based.
One recent example of a company announcing a KEIP before the bankruptcy filing is Diamond Offshore Drilling. The company announced a prepaid retention program for executives, as well as a KEIP, a non-executive incentive plan and an additional retention plan. All plans except for the prepaid executive retention program are subject to Bankruptcy Court approval, according to the 8-K. The KEIP, nonexecutive incentive plan and the additional retention plan replace past incentives – including requiring the forfeiture of past restricted stock unit awards and stock appreciation rights – and current incentives that would have been granted in 2020. The KEIP includes nine participants, including the senior executive team.
Employee Retention and Incentive Programs
Retention and incentive programs for employees are also used during the bankruptcy process. The use of employee programs depends on the company’s business needs and other factors, such as size and industry. Retention and incentive programs for non-executives typically replace the value of annual incentives and sometimes long-term incentives. Employee retention programs are cash-based and pay out at specific intervals, often quarterly given the uncertainties associated with companies in restructuring situations. The duration of employee retention programs often mirrors those for executives.
Severance programs, which provide compensation to individuals at termination, are also used in bankruptcy situations. When communicated broadly during bankruptcy, severance can be considered a retention program as it helps employees have some financial security and focus on their current jobs rather than finding new positions. Severance programs tend to be used more commonly for employees than executives because BAPCPA limits the value that can be delivered to “insiders.” However, a recent example of a severance program for executives came from Hertz Global Holdings, which announced amendments to its executive severance programs prior to its bankruptcy filing in May 2020. The severance programs, which were disclosed in the same 8-K filing as a prepaid key employee retention program, cover senior executives and vice presidents, and the payment multiple was reduced to 1X salary and bonus from 1.5X.
Conclusion
Executive compensation programs implemented in conjunction with a bankruptcy should be carefully designed and reviewed with outside advisors to ensure that the company is complying with bankruptcy code. Companies should carefully review the value of executive awards to ensure that they are reasonable while also in line with competitive practices and past incentive opportunities. Executive award amounts should be considered in the context of employee awards and the company’s overall financial situation to ensure fairness and avoid the appearance of excess. Lastly, companies should carefully communicate the rationale for executive awards and what the company is doing for employees in the 8-K current report or other announcement. Clear communication up front can help head off later public relations and optics headaches.
Compensation Advisory Partners (CAP) assessed human capital actions taken by companies in the Industrials sector in response to the COVID-19 pandemic. Key findings include:
- The Industrials sector and its Capital Goods, Commercial and Professional Services, and Transportation industries were hit hard by COVID-19, as reflected by the percentage of companies taking actions in response to the pandemic.
- Half of the Industrials companies in the S&P Composite 1500 Index reported human capital actions in response to the pandemic. In contrast, 39 percent of companies in the S&P 1500 reported actions.
- Of the industries in the Industrials sector, Transportation was particularly hard hit, with 69 percent of companies reporting human capital actions. In the Commercial and Professional Services industry, 51 percent of companies took human capital actions in response to COVID-19, while 45 percent of companies in the Capital Goods sector took actions.
- Pay reductions for executives and board members are the most prevalent human capital actions in the Industrials sector.
- Median salary reductions were 38 percent for chief executive officers (CEOs), while median salary reductions for other executives were 20 percent.
- For boards of directors, pay was cut by a median of 30 percent. The range of director pay cuts is similar to the range of CEO salary cuts.
- In addition to pay reductions for executives and boards, the most prevalent human capital actions in the Industrials sector were furloughs, pay reductions for employees, and workforce reductions.
The PDF of the report provides additional data for the Industrials sector.
The human capital actions that CAP is tracking include pay cuts; changes to annual and long-term incentives; furloughs; workforce reductions; suspended 401K matches; enhanced health and welfare benefits; additional pay for frontline workers; pay continuity; and workforce expansions. CAP will continue to monitor corporate public announcements of COVID-19 actions.
In August 2019, the Business Roundtable came out with a new statement on the purpose of a corporation. For the first time, the focus expanded from serving shareholders and creating long-term value to serving all stakeholders by delivering value to customers, investing in employees, dealing fairly and ethically with suppliers and supporting the environment and people in the community.
While this statement is bold, it is a response to the increased focus by shareholders on Environmental, Social and Governance (ESG) matters. Investors are evaluating how companies are addressing ESG issues and their impact on the long-term sustainability and value creation for each organization. Some of the largest institutional investors, including BlackRock and State Street, have put boards on notice that they will be holding directors and company management accountable for how ESG issues are managed. The major proxy advisory firms (Institutional Shareholder Services and Glass Lewis) now provide their clients with ESG ratings for each company they evaluate, highlighting related risks to investors in these areas.
What should board members generally and compensation committee members specifically be doing to address ESG? Each board should define what ESG means for their organization as each company has a unique operating model or business strategy that may include ESG initiatives to varying degrees. Many boards are doing this. We have seen the creation of ESG committees of the board or modifications to committee charters to incorporate ESG oversight (for example, many compensation committees now have oversight of diversity and inclusion). Once companies and boards define what ESG means for them, it will be important to articulate the following:
- Objectives for each of these initiatives
- Criteria for assessing performance against these
objectives - Approaches for holding management accountable
The governance area of ESG has improved in the past decade, with many organizations focused on strengthening shareholder rights and demonstrating the alignment of pay and performance in response to input from shareholders and shareholder advisory
groups. A strong and independent board is a key factor in governance and across industries, and many boards have embraced independent director sessions, board refreshment and balanced tenure, skills and diversity. Showcasing of governance enhancements has become common in proxy statements, and we expect companies to continue to maintain strong governance practices.
The environmental aspects of ESG have been more common in certain industries, such as energy, utilities and manufacturing, though the focus on the environment is gaining momentum across industries.
Companies are focusing on how they manage climate change, emissions, spills, water conservation and other sustainability efforts. Organizations such as the Sustainability Accounting Standards Board have developed standards so companies and investors can assess the risks and opportunities across industries.
The social aspects of ESG have focused on human capital and the impact of a company’s products or policies on society. The topics of human-capital management, employee engagement and gender pay equity have increasingly worked their way into board meeting conversations, with gender pay equity raising the fundamental issue of representation and inclusion. These statistics are measurable, and detailed analysis over time can help hold management accountable and demonstrate progress. It is now very common for compensation committees and, in some instances, the full board to receive updates on representation across an organization.
A natural question is to what extent should ESG factors be incorporated into incentive compensation plans? CAP reviewed the proxy statements of 2020 early filers (companies that filed their most recent proxy statement between December 2019 and January 2020) and found that approximately one-third incorporate some type of ESG metric in their executive compensation plan decision-making. The types of metrics varied significantly by industry as not all aspects of ESG will be critical to every organization’s business strategy. For example, carbon emissions may be more material for an energy company than a professional services company. When incorporating ESG factors, most companies in our review applied the metric to their annual incentive plans using a qualitative assessment of the factor. The metric generally reflected a small percentage of the overall weighting (5 percent–15 percent of the total incentive). Companies and boards should discuss the best ways to hold management accountable for ESG progress, including incorporating such progress into incentive plan performance.
Every board and management team should identify which ESG matters are material to their organization and understand how they should be approached and monitored and how to communicate their approach to investors. While the Covid-19 pandemic in 2020 has turned the focus of management on business continuity and crisis management, we expect ESG matters will continue to be prominent factors considered by institutional investors, proxy advisory firms and other stakeholders. It will be important for companies to define the ESG factors that have the greatest impact on their business as transparency and disclosure on how ESG matters are addressed have become increasingly essential parts of shareholder engagement.
CAP reviews and publishes an annual update on pay levels for Chief Financial Officers (CFOs) and Chief Executive Officers (CEOs). This year’s update is based on a sample of 119 companies with median revenue of $13 billion. Additional information on criteria used to develop the sample of companies is included in the Appendix.
Highlights 2017 vs 2016
| Component | Highlight |
| Base Salary |
|
| Bonuses |
|
| LTI |
|
| Performance Results |
|
| Total Compensation |
|
| Pay Mix |
|
Study Results
Salaries
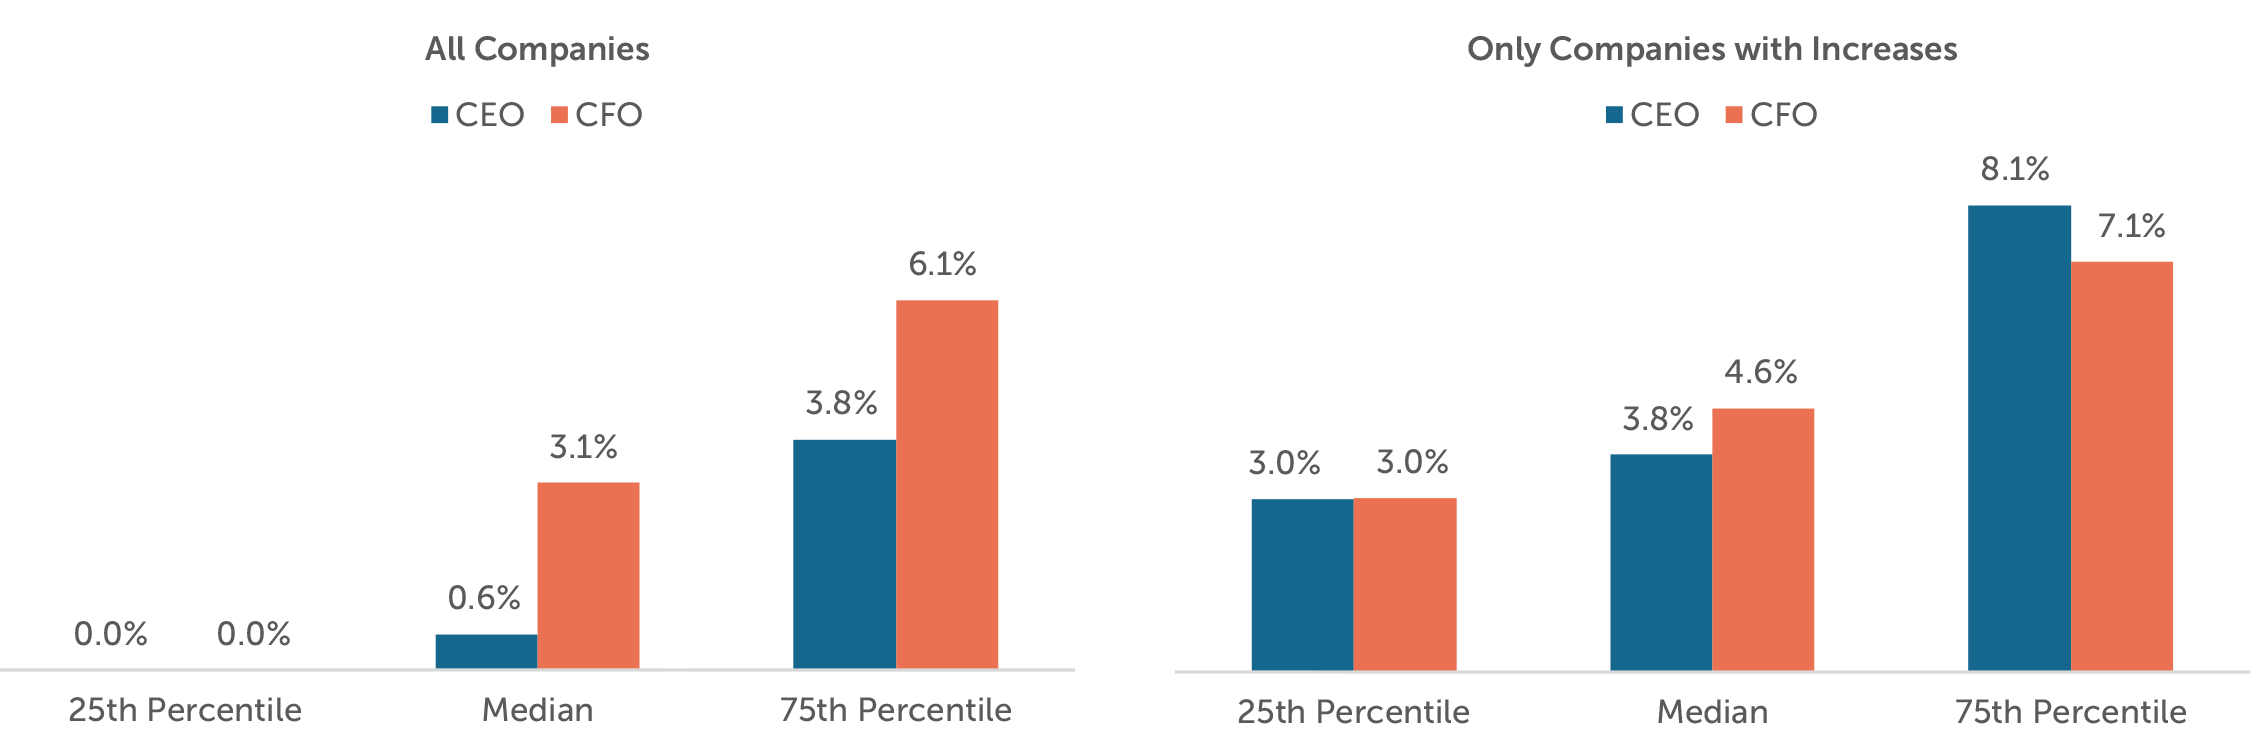
In the past, we have seen a steady growth in the number of CEOs and CFOs receiving salary increases in each year. However, for the 2016-2017 period the salary increase prevalence of 51% for CEOs and 70% for CFOs was very comparable to the increases for 2015-2016. The median 2017 salary increases were 3.1% for CFOs and 0.6% for CEOs.
2017 Salary Increases
Actual Pay Levels
Salary increases were higher for CFOs since only about one-half of CEOs received an increase. Yet, the median increases in actual bonus and long-term incentives were at similar levels for both CFOs and CEOs.
The median rate of increase in actual total direct compensation levels for CEOs and CFOs was 10.9% and 9.9% in 2017, respectively. We found that in 58% of the companies, the CEO received a higher percentage total compensation increase than the CFO.
| Median Percentage Change in Pay Components | ||||
|
Pay Components |
2015 – 2016 | 2016 – 2017 | ||
| CEO | CFO | CEO | CFO | |
| Salary | 0.0% | 3.0% | 0.6% | 3.1% |
| Actual Bonus | 1.5% | 1.1% | 12.0% | 12.7% |
| Long-Term Incentives | 3.8% | 4.1% | 8.1% | 10.3% |
| Actual Total Direct Compensation | 5.4% | 3.9% | 10.9% | 9.9% |
While target bonuses remained relatively the same, actual bonuses had significant increases indicating a strong performance year among the sampled companies. Year-over-year revenue and operating income growth was 7% for both measures which was much higher than 2016 performance of 1% and 4% growth, respectively.
Median Pay Increase by Industry1
Actual Total Direct Compensation2
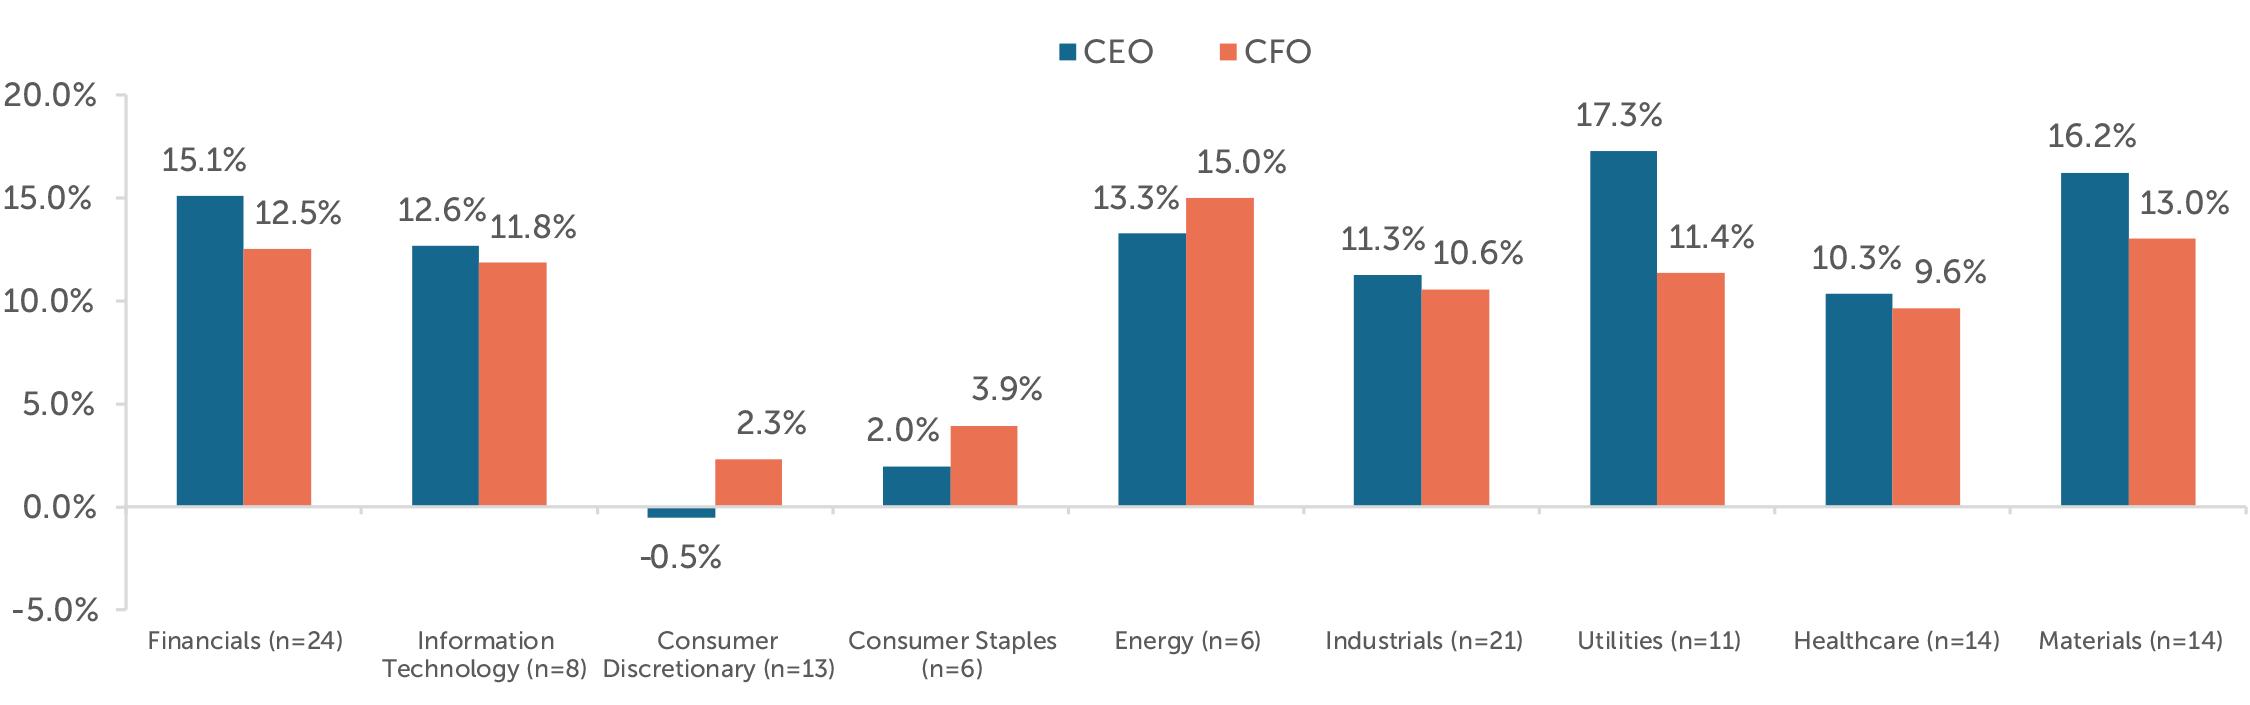
Median TDC increases by industry were generally aligned with the year-over-year revenue and operating income improvements.
Total compensation increases lagged the total sample for the Consumer Discretionary and Consumer Staples industries. While the companies in Consumer Staples improved total shareholder returns, revenue growth, and operating income growth in 2017, the overall industry performance still lagged the total sample. On the other hand, the companies in Consumer Discretionary generally saw a decrease in operating performance and an improved total shareholder return in 2017, but total compensation was generally flat.
The underperformance of the Consumer Staples companies is partially attributed to the pressure on sales volume as a result of taxes on soda, competition from store brands / smaller upstarts, battle for shelf space, and health conscious consumers.
For Consumer Discretionary companies, the trend is less clear as this industry is more diverse and covers a lot more sub-sectors (for example: media and entertainment, distributors, retail, hotels, automobiles, etc.). When we look at the companies in this industry individually, the compensation changes year-over-year were most often aligned with improved or deteriorated performance.
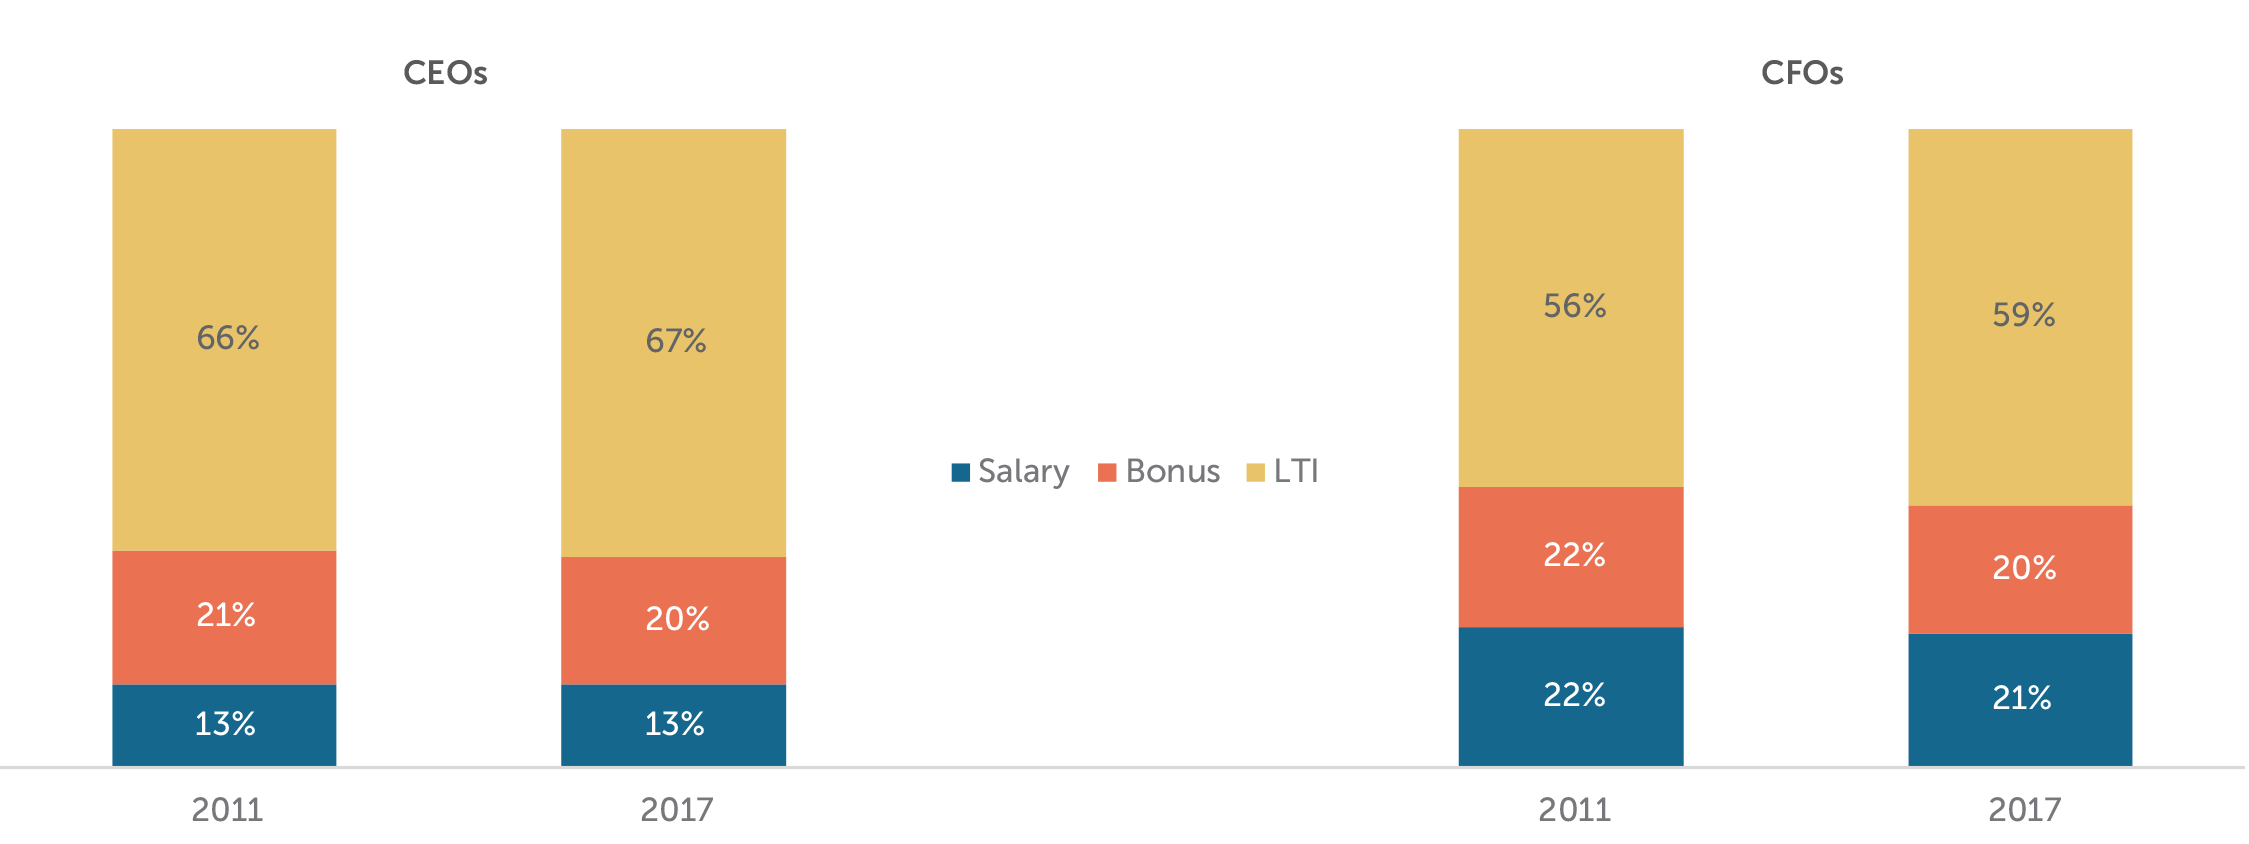
Target Pay Mix
The structure of the overall pay program (salary, bonus, LTI) has remained largely unchanged since 2011. CEOs continue to receive less in the form of salary and more in variable pay opportunities, especially LTI, than CFOs.
Target Bonuses
Target bonuses as a percentage of salary remained unchanged at median and only changed slightly at 25th and 75th percentiles. We do not foresee any major changes in target bonus percentages in the near future.
| Target Bonus as % of Salary | ||||
|
Summary Statistics |
CEO | CFO | ||
| 2016 | 2017 | 2016 | 2017 | |
| 25th Percentile | 138% | 135% | 85% | 85% |
| Median | 150% | 150% | 100% | 100% |
| 75th Percentile | 190% | 200% | 120% | 125% |
Long-Term Incentive (LTI) Vehicle Prevalence and Mix
Prevalence of performance plans continued to increase in 2017. The use of two different vehicles to deliver LTI remains the most prevalent approach and approximately 25% of companies studied use all 3 equity vehicles (stock options, time-based stock awards, and performance plan awards).
Performance plans account for around 60% of LTI awards on average among companies studied. The other portion of LTI is delivered through an almost equal mix of stock options and time-vested restricted stock awards.
| LTI Mix | ||||||
|
LTI Vehicles |
2011 | 2016 | 2017 | |||
| CEO | CFO | CEO | CFO | CEO | CFO | |
| Stock Options | 32% | 32% | 23% | 22% | 19% | 17% |
| Time Vested Restricted Stock | 17% | 22% | 20% | 24% | 18% | 24% |
| Performance Plans | 51% | 46% | 57% | 54% | 63% | 59% |
Conclusion
2017 performance overall, was higher compared to last year. Median revenue growth was 7% (vs 1% in 2016) and operating income growth was 7% (vs 4% in 2016). Total shareholder return in 2017 was comparable to 2016; the full year return was 20% (vs 16% in 2016). Total pay increases were much higher than in 2017, which we believe were directionally aligned with the performance improvements. A strong year of financial performance led to high annual incentive payouts in 2017 and after multiple years of sustained TSR growth companies are increasing LTI opportunities among their top executives.
The pay mix has been relatively consistent since 2011, but where we are seeing the most change is within LTI delivery vehicles. Since 2011 performance-based LTI plans have increased about 13% for both CEOs and CFOs with a similar drop in the prevalence of stock options, and time vested stock being relatively the same. With the focus on aligning pay outcomes with company performance by Boards and investors, we are not surprised to see large increases in total compensation after multiple years of sustained strong performance across industries.
APPENDIX
Sample Screening Methodology
Based on the screening criteria below, we arrived at a sample of 119 public companies with median 2017 revenue of $13B.
| Revenue | At least $5B in revenue for fiscal year 2017 |
| Fiscal year-end | Fiscal year-end between 9/1/2017 and 1/1/2018 |
| Proxy Statement Filing Date | Proxy statement filed before 3/31/2018 |
| Tenure | No change in CEO and CFO incumbents in the past three years |
| Industry | All industries have been considered for this analysis |
Companies use annual bonuses as a tool to reward executives for achieving short-term financial and strategic goals. Setting appropriate annual performance goals is essential to establishing a link between pay and performance. Goals should achieve a balance between rigor and attainability to motivate and reward executives for driving company performance and creating returns for shareholders.
Key Takeaways:
- Based on our analysis of actual incentive payouts over the past 6 years, the degree of difficulty, or “stretch”, embedded in annual performance goals translates to:
- A 95% chance of achieving at least Threshold performance
- A 75% chance of achieving at least Target performance
- A 15% chance of achieving Maximum performance
- This pattern indicates that target performance goals are challenging, but attainable, and maximum goals are achievable through highly superior performance
- The majority of companies use two or more metrics when assessing annual performance
- Annual incentive payouts have been directionally linked with earnings growth over the past 6 years
Summary of Findings
Plan Design
For the purposes of this study, we categorized annual incentive plans as either goal attainment or discretionary. Companies with goal attainment plans define and disclose threshold, target and maximum performance goals and corresponding payout opportunities. Alternatively, companies with discretionary plans do not define the relationship between a particular level of performance and the corresponding payout. Discretionary programs provide committees with the opportunity to determine payouts based on a retrospective review of performance results.
| Annual Incentive Plan Type | |||
| Industry | Sample Size | Goal Attainment | Discretionary |
| Auto | n= 8 | 100% | 0% |
| Consumer Discretionary | n= 10 | 90% | 10% |
| Consumer Staples | n= 12 | 67% | 33% |
| Financial Services | n= 12 | 17% | 83% |
| Healthcare | n= 9 | 89% | 11% |
| Industrials | n= 14 | 71% | 29% |
| Insurance | n= 12 | 67% | 33% |
| IT | n= 12 | 83% | 17% |
| Pharma | n= 10 | 80% | 20% |
| Total | 72% | 28% | |
Consistent with the findings from our study conducted in 2014, 72% of sample companies have goal attainment plans. Our study focuses on these companies.
Performance Metrics
Most companies (61%) use 3 or more metrics to determine bonus payouts. This reflects a shift from 2014, where 48% of companies used 3 or more metrics. Companies annually review metrics to ensure that they align with the business strategy.
Many companies use financial metrics such as revenue and profitability, which are indicators of market share growth and stock price performance. Some bonus plans also include strategic metrics, which incentivize executives to achieve goals that may contribute to long-term success, but may not be captured by short-term financial performance. Companies in the pharmaceutical industry often use strategic goals, such as pipeline development. Similarly, companies with large manufacturing operations often use quality control metrics.
| # of Metrics Used in Goal Attainment Plan | ||||
| Industry | 1 Metric | 2 Metrics | 3 Metrics | 4+ Metrics |
| Auto | 13% | 13% | 25% | 50% |
| Consumer Discretionary | 11% | 44% | 45% | 0% |
| Consumer Staples | 0% | 37% | 38% | 25% |
| Financial Services | 0% | 50% | 50% | 0% |
| Healthcare | 0% | 38% | 12% | 50% |
| Industrials | 20% | 40% | 20% | 20% |
| Insurance | 37% | 13% | 25% | 25% |
| IT | 10% | 30% | 40% | 20% |
| Pharma | 0% | 0% | 63% | 37% |
| Total | 11% | 28% | 34% | 27% |
Pay and Performance Scales
Compensation committees annually approve threshold, target, and maximum performance goals, and corresponding payout opportunities, for each metric in the incentive plan. Target performance goals are typically set in line with the company’s internal business plan. Executives most often earn 50% of their target bonus opportunity for achieving threshold performance and 200% for achieving maximum performance. Actual payouts are often interpolated between threshold and target and target and maximum.
Annual Incentive Plan Payouts Relative to Goals
All Companies
Based on CAP’s analysis, companies paid annual bonuses 95% of the time. Payouts for the total sample are distributed as indicated in the following charts:
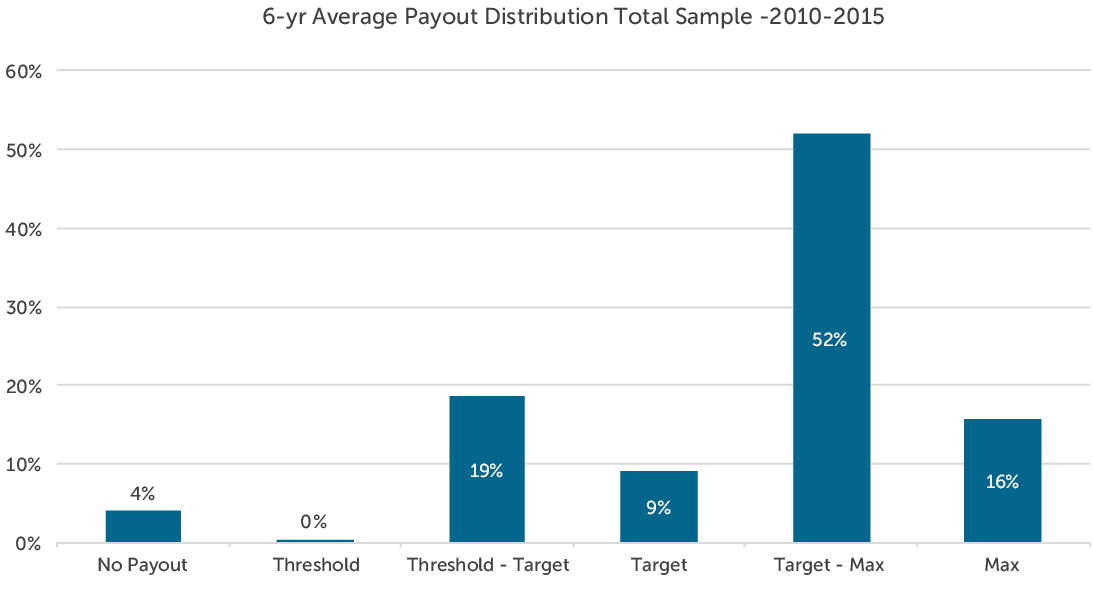
This payout distribution indicates that committees set annual performance goals with a degree of difficulty or “stretch” such that executives have:
- A 95% chance of achieving at least Threshold performance
- A 75% chance of achieving at least Target performance
- A 15% chance of achieving Maximum performance
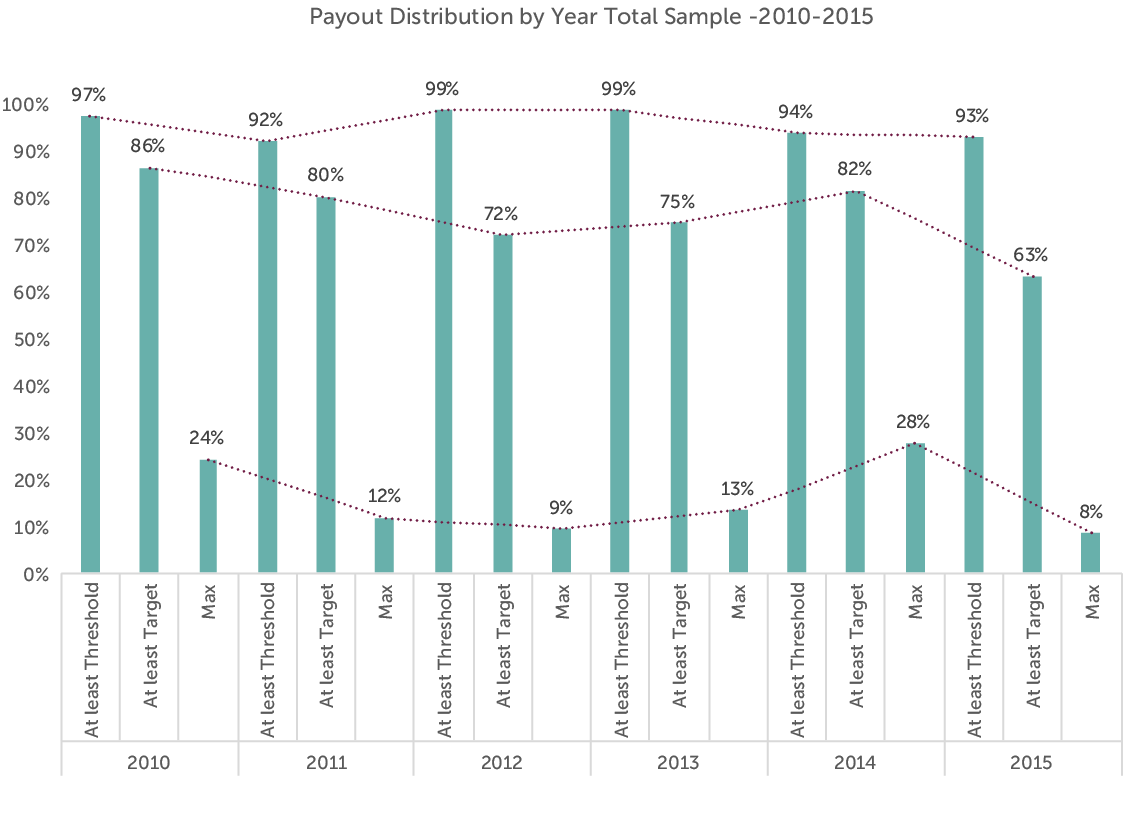
From 2010-2015, no more than 10% of companies failed to reach threshold performance in any given year. By comparison, in both 2008 and 2009, which were challenging years, approximately 15% of companies failed to reach threshold performance goals.
When looking back over 8 years (2008-2015), companies achieved at least threshold and target performance with slightly less frequency. Based on CAP’s analysis of this 8-year period, executives have:
- A 90% chance of achieving at least Threshold performance
- A 70% chance of achieving at least Target performance
- A 15% chance of achieving Maximum performance
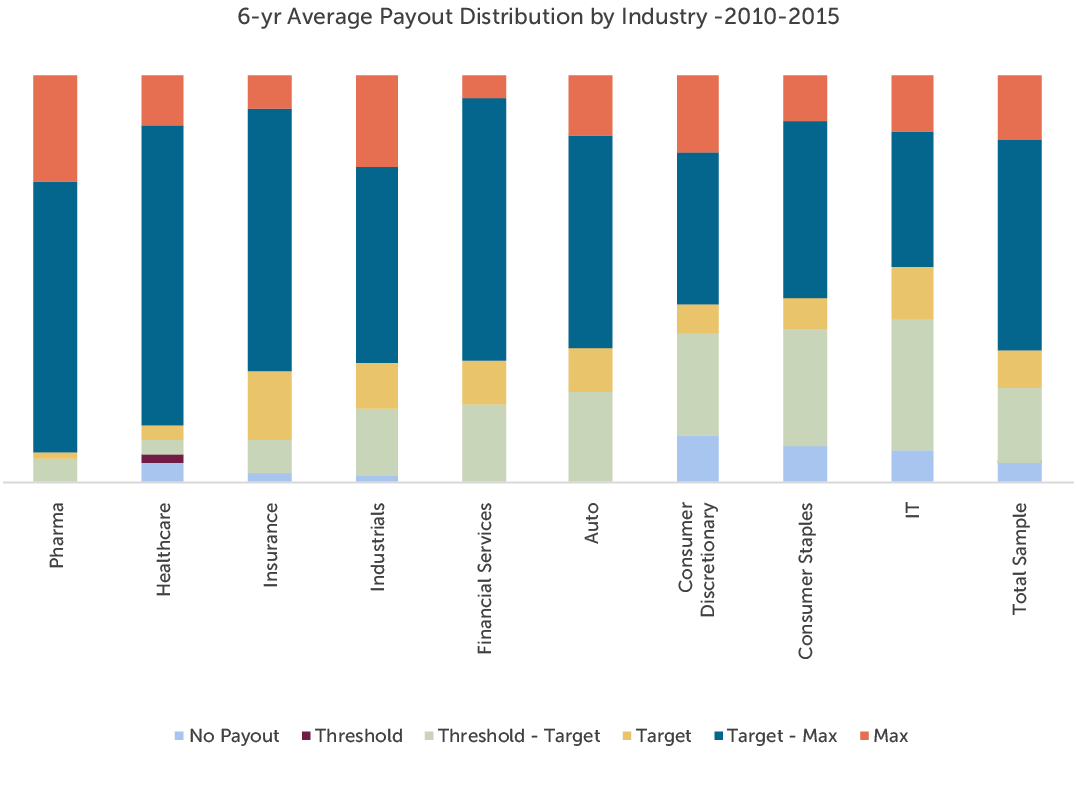
By Industry
Pharmaceutical and healthcare companies have paid at or above target more frequently than companies in any other industry over the past 6 years. Both industries have experienced significant growth over the period in part due to consolidation. The companies in the IT, Consumer Discretionary and Consumer Staples industries tend to pay below target at a higher rate. Average payouts for each industry are distributed as indicated in the following chart:
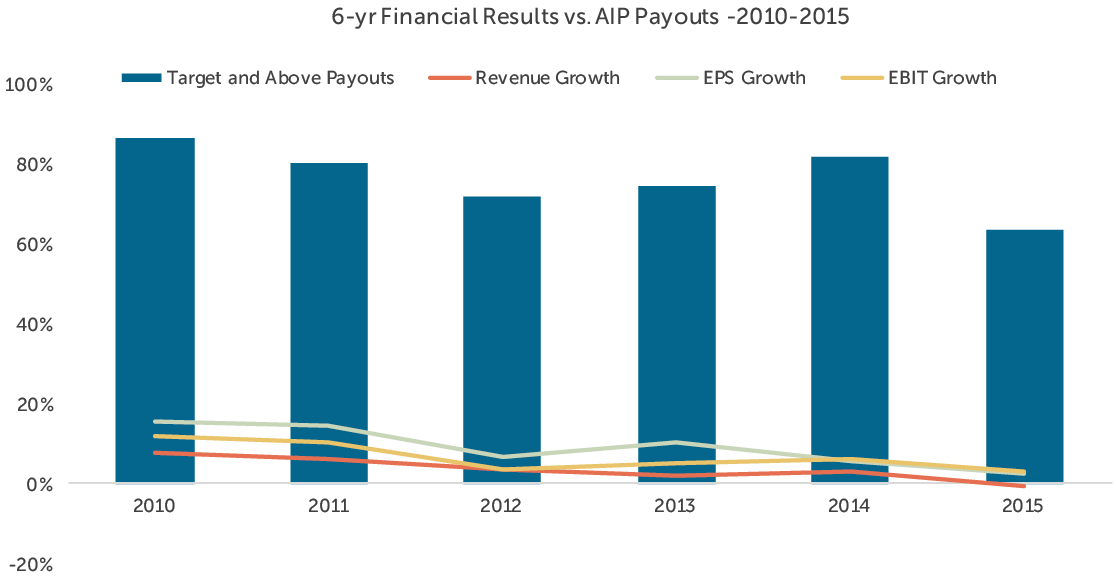
Relative to Performance
CAP reviewed the relationship between annual incentive payouts and company performance with respect to three metrics: revenue growth, earnings per share (EPS) growth and earnings before interest and taxes (EBIT) growth. While payouts were generally aligned with revenue and EPS growth, they most closely tracked with EBIT growth over the period studied (2010-2015). Companies may seek to align bonus payouts with operating measures, such as EBIT, as they capture an executive’s ability to control costs and improve operational efficiency.
The chart below depicts the relationship between median revenue, EPS, and EBIT growth and target and above annual incentive payouts among the companies studied.
Conclusion
In the first quarter of 2017, committees will certify the results and payouts for the fiscal 2016 bonus cycle and approve performance targets for fiscal 2017. Given the uncertain economic outlook following the 2016 presidential election, establishing performance targets for 2017 may be more challenging than usual. Companies may choose to use a range of performance from threshold to maximum to build flexibility into their plans given the unpredictable environment. Our study of annual bonus payouts over the past 6-8 years supports setting goals such that the degree of difficulty, or “stretch”, embedded in performance goals translates to:
- A 90-95% chance of achieving at least Threshold performance
- A 70-75% chance of achieving at least Target performance
- A 15% chance of achieving Maximum performance.
Companies should continue to set target performance goals that are challenging, but attainable and maximum goals that are achievable through outperformance of internal and external expectations – therefore, establishing a bonus plan that is attractive to executives and responsible to shareholders.
Methodology
CAP’s study consisted of 100 companies from 9 industries, selected to provide a broad representation of market practice across large U.S. public companies. The revenue size of the companies in our sample ranges from $18 billion at the 25th percentile to $70 billion at the 75th percentile.
CAP analyzed the annual incentive plan payouts of the companies in the sample over the past 6-8 years to determine the distribution of incentive payments and the frequency with which executives typically achieve target payouts. In this analysis, CAP categorized actual bonus payments (as a percent of target) into one of six categories based on the following payout ranges:
| Payout Category | Payout Range |
| No Payout | 0% |
| Threshold | Up to 5% above Threshold |
| Threshold – Target | 5% above Threshold to 5% below Target |
| Target | +/- 5% of Target |
| Target – Max | 5% above Target to 5% below Max |
| Max | 5% below Max to Max |


