Compensation Advisory Partners (CAP) conducted a study of executive compensation trends in the banking industry. The study includes 18 U.S. banks with greater than $50 billion in assets across three groups: Money Center banks (n=4), Custody banks (n=3), and Super Regional banks (n=11). This report summarizes the pay and performance relationship for these 18 banks in 2022, executive compensation trends in the industry, and outlook for the industry in 2023.
Highlights
1 |
2022 Pay and Performance Outcomes CEO compensation was mixed across the banks in our sample. Though total pay increased by 3% at median, only half the banks increased total incentives. This was in line with financial performance, which varied by bank based on business mix and balance sheet makeup. |
2 |
Use of Discretion in Incentive Plans 2022 highlighted differences in philosophies around applying discretion in determining annual bonus payouts. Some banks adjusted payouts to recognize the impact higher than expected interest rates had on performance, while others used calculated results to determine bonuses. |
3 |
SEC Required Pay versus Performance Disclosure In the first year of the new disclosure, the banks in our study generally showed strong alignment between compensation actually paid and total shareholder return and most disclosed return on equity as the most important financial performance measure for linking compensation to performance. The disclosure has received limited attention from shareholders and the media to-date. |
4 |
Potential Non-Compete Bans The Federal Trade Commission and New York State legislators have both advanced bans on non-compete agreements. Banks should keep an eye on the progress of potential non-compete bans at the federal and state level and confirm compliance implications. |
5 |
Looking Ahead 2023 has been a volatile year in banking, marked by bank failures in the spring, the rising cost of funds, and potential increases in capital requirements. The impact of these factors on full-year 2023 performance is still uncertain, though shareholder expectations have declined significantly from the beginning of the year and year-to-date total shareholder return is generally negative. As banks begin the year-end compensation decision-making process, they will need to consider how to appropriately balance the need to retain top talent in this volatile environment with their objective to align executive pay outcomes with performance. |
Recap – Pay and Performance Outcomes Mixed for 2022
Following a strong 2021, 2022 performance results were mixed among the banks in our study based on business mix and balance sheet makeup. For example, banks that generate a significant portion of revenue from investment banking faced greater headwinds in 2022 than other banks. At median, pre-provision net revenue increased vs. 2021 due to rising interest rates and stronger net interest income; however, Earnings Per Share (EPS) and Return on Equity (ROE) were both down vs. 2021 when banks’ bottom lines benefited from a reduction in provisions for loan losses. 1-year Total Shareholder Return (TSR) was down -19 percent at median over the period for the banks in our sample, commensurate with the S&P 500, which was down -18 percent at median.
The chart below summarizes median performance results for the banks in CAP’s study:
|
Metric |
Median Percent Change |
|
|
Year Ended December 31, 2021 |
Year Ended December 31, 2022 |
|
|
Earnings per Share |
+96.2% |
-14.4% |
|
Pre-Provision Net Revenue |
-3.9% |
+10.3% |
|
Return on Equity (Basis Point Change) |
+527 bps |
-141 bps |
|
1-Year Total Shareholder Return |
+37.6% |
-19.1% |
|
3-Year Total Shareholder Return (Cumulative) |
+58.7% |
+2.1% |
Source: S&P Capital IQ Financial Database.
Note: Excludes companies where there was a change in CEO.
In 2022, total direct compensation (i.e., the sum of base salary, annual cash bonus, and awarded long-term incentives) increased 3 percent at median, though changes in pay varied significantly from bank to bank based on performance and other factors. Just over half of the banks in our study increased CEO compensation levels for 2022. Banks that decreased CEO compensation for 2022 did so primarily through the annual cash bonus, which is closely linked to 1-year financial performance. This is in stark contrast to 2021 where most banks paid out bonuses above target, resulting in a 36 percent increase at median due to strong financial performance buoyed by the release of loan loss provisions. 2022 long-term incentives also increased modestly at median (i.e., +6 percent), compared to 2021 when banks increased long-term incentives more significantly (i.e., +21 percent at median).
Incentive Plan Design Trends – Spotlight on Discretion
Most banks in our study did not make changes to annual or long-term incentive plan metrics or structure in 2022. One area of focus in incentive plans revolves around how banks apply discretion to annual incentive payouts. Of the banks in our sample, 56 percent have fully discretionary annual incentive plans. A fully discretionary plan indicates that the compensation committee determines annual incentive payouts based on a holistic review of company and individual performance results. Fully discretionary plans are particularly common among the money center and custody banks. The remaining 44 percent of banks in our sample use formulaic incentive plans that payout based on performance relative to pre-defined goals; however, most of these banks maintain the ability to exercise some discretion over the final payout. These banks incorporate discretion in a variety of ways, including maintaining a weighted discretionary component or modifier, making discretionary adjustments to metrics, and applying discretion to increase or decrease the final payout.
2022 highlighted differences in philosophies around applying discretion across the banks in our sample, specifically with regard to how banks allowed higher than expected interest rates to influence incentive plan payouts. Some banks paid out based on calculated results under their formulaic plan while others made negative discretionary adjustments to recognize that the positive impact of higher than budgeted rates on performance results was outside of management’s control. These differences in philosophy led to differences in actual incentive payouts across the group.
New for 2022 – SEC Required Pay Versus Performance Disclosure
On August 25, 2022, the SEC adopted final rules implementing the pay versus performance disclosure requirement under the Dodd-Frank Act. For the first time in 2023, companies had to comply with the new rule, which requires, among other items, a table highlighting the relationship between pay and various performance metrics, including TSR, net income, and an additional company-selected measure (CSM).
Overall, we saw more similarities than differences in disclosure among the banks in our sample. The banks generally showed alignment between pay and performance and with each other. Compensation Actually Paid, a new measure that considers the change in value of equity awards after grant, was below Summary Compensation Table (SCT) pay in 2020, above SCT pay in 2021, and aligned with SCT pay in 2022. The relationship between Compensation Actually Paid and SCT pay generally aligns with TSR over the period as stock price change is a significant driver of Compensation Actually Paid.
78% of banks used a return on equity measure as the CSM, indicating that most banks view return on equity as the “most important financial measure” used to link Compensation Actually Paid to company performance. Specifically, the most common return on equity measure was Return on Tangible Common Equity (ROTCE).
The disclosure also required companies to select a TSR peer group against which to compare their own TSR performance. Companies could select either an industry index or the peer group used to assess pay. Nearly all the banks in our sample used an industry index for the TSR comparator peer group. The KBW Nasdaq Bank Index was the most common, followed by the S&P 500 Financials Index.
Though the disclosure required significant investment from companies to produce, it has received minimal attention from shareholders and the media. We expect the disclosure to remain compliance-focused in the coming years.
On the Horizon – Potential Challenges to Non-Compete Arrangements
In June 2023, legislators in New York fast-tracked a bill that, if signed, would ban non-compete agreements in the state. This move follows the Federal Trade Commission’s proposal earlier this year to ban non-compete agreements at the national level. As non-compete agreements are especially prevalent in the banking industry, it will be important for banks to keep an eye on the progress of non-compete bans as the New York bill could spark momentum for passing similar bills in other states.
Looking Ahead – Volatility in Banking in the Second Half of 2023
2023 has been a challenging year for banks, marked by the failures of SVB Financial, Signature Bank, and First Republic in the U.S. and Credit Suisse internationally. The shutdown of these major institutions stoked fears about the health of the banking sector. Year-to-date, total shareholder return for the banks in our study is down -21 percent at median while the S&P 500 is up +15 percent.
Though regulators have not finalized any new rulemaking, the bank shutdowns have inspired discussion about regulations that could potentially impact both bank performance and executive compensation practices. Two separate bipartisan groups of senators have introduced two separate clawback bills into the senate. The bills would expand the FDIC’s ability to clawback compensation from the executives of failed banks to different degrees. The most recent is the Recovering Executive Compensation from Unaccountable Practices (RECOUP) Act, which passed the Senate Banking Committee in June.
Additionally, in July, the Federal Reserve’s vice chair for supervision, Michael Barr, proposed a change to the oversight of America’s largest banks that would require banks with assets over $100 billion to increase their capital holdings. The aim of this regulation would be to address vulnerabilities exposed by the collapse of major banks earlier this year and boost resilience during crises. Critics of Barr’s comments say that such regulation will impede these banks’ ability to lend.
As we approach the end of 2023, the outlook for the full year, and in turn, projected compensation outcomes, is less certain. Performance expectations have declined significantly from the beginning of the year – for example, at median, analyst estimates for 2023 EPS have declined 11% from Q1 for the banks in our study. The decline has been more significant for the super regional banks than for the more diversified money center and custody banks. We expect lower results to drive 2023 bonus payouts to be lower than 2022 bonus payouts for many banks. As banks begin the year-end compensation decision-making process, they will need to consider how to appropriately balance the need to retain top talent in this volatile environment with their objective to align executive pay outcomes with performance.
For questions or more information, please contact CAP’s banking team:
Eric Hosken
Partner
[email protected]
212-921-9363
Kelly Malafis
Partner
[email protected]
212-921-9357
Shaun Bisman
Principal
[email protected]
212-921-9365
Mike Bonner
Principal
[email protected]
646-486-9744
Stefanie Kushner
Associate
[email protected]
646-532-5931
Banks in CAP’s Study (n=18)
Money Center Banks
- Bank of America Corporation
- Citigroup, Inc.
- JPMorgan Chase & Co.
- Wells Fargo & Company
Custody Banks
- The Bank of New York Mellon Corporation
- Northern Trust Corporation
- State Street Corporation
Super Regional Banks
- Citizens Financial Group, Inc.
- Comerica, Inc.
- Fifth Third Bancorp
- Huntington Bancshares, Inc.
- KeyCorp
- M&T Bank Corporation
- The PNC Financial Services Group, Inc.
- Regions Financial Corporation
- Truist Financial Corporation
- U.S. Bancorp
- Zions Bancorporation
Compensation Advisory Partners (CAP) conducted a study of executive compensation trends in the regional banking industry. The study examined 2022 CEO compensation levels and pay practices among 40 regional banks across three groups based on FY’22 asset size: $1B – $5B in assets (“small banks”; n=13), $5B – $10B in assets (“medium banks”; n=13) and $10B – $20B in assets (“large banks”; n=14). This report compares both compensation levels and incentive plan design across the groups. We also highlight current issues facing the banking industry in 2023.
Highlights
1 |
2022 Performance and Pay Outcomes Total CEO compensation in 2022 increased 6 percent on average across all asset groups, compared to an 11 percent increase in 2021. Medium and large banks experienced declines in earnings and profitability partly because 2021 was a very strong performance year. However, CEO pay increased since most banks achieved target or greater performance results. Total Shareholder Return (TSR) was also weaker in 2022 (-2 percent) for all banks compared to 2021, when TSR was strong (+34 percent). |
2 |
Total Pay Mix As asset size increases, a higher percentage of banks’ CEO total pay shifts from fixed compensation to at-risk or variable compensation, and a larger emphasis is placed on long-term vs. annual incentives. |
3 |
Annual and Long-term Incentive Plan Metrics The most prevalent metrics for annual and long-term incentive plans remained consistent with prior years. For annual incentives, the most prevalent metrics generally include Efficiency Ratio, Earnings Per Share (EPS), Asset Quality and Return on Assets (ROA), with the small and medium banks also considering Loan and Deposit levels more frequently. Performance against individual goals is prevalent among half the banks in our sample. For long-term plans, relative TSR, ROE, EPS and ROA are frequently used together. |
4 |
Use of Environmental, Social and Governance (ESG) Metrics in Incentive Plans Among all banks in our study, the inclusion of ESG metrics in annual incentive plans continues to be a minority practice, but it notably doubled year-over-year. In 2022, 25 percent (n=10) of the banks considered ESG as part of the bonus decision – primarily as an award component – compared to 13 percent (n=5) in 2021. No banks in the sample considered ESG in determining long-term incentives. The ESG categories banks most frequently disclose relate to Human Capital and Diversity, Equity & Inclusion (DE&I). |
5 |
Looking Ahead Given the current banking landscape and operational environment, there continues to be uncertainty surrounding the performance outlook for 2023. With the recent bank failures, increase in cost of funds, higher capital requirements and evolving regulatory environment, banks’ shareholder returns have been negatively impacted year-to-date; however, banks continue to be profitable in the first half of 2023 with financial performance generally flat compared to the first half of 2022. |
2022 Performance and Pay Outcomes
Performance Results
Bank 2022 financial performance reflects the market normalizing post-pandemic, following a strong performance year in 2021. Earnings, profitability and return metrics were all stronger in 2021 vs. 2022. For 2022, the high interest rate environment lifted net interest margin and increased net interest income growth, which in turn helped boost earnings and profitability.
When comparing across all three groups, the small banks generally had the strongest performance year in 2022, as EPS and Net Income grew at higher rates than the medium and large banks. As of 12/31/2022, TSR performance on a 1- and 3-year basis was also better for the small banks.
|
Metric |
Median Percent Change – Year Ended December 31, 2022 |
||
|
$1B – $5B |
$5B – $10B |
$10B – $20B |
|
|
EPS |
10.3% |
-3.3% |
-7.1% |
|
Net Income |
8.2% |
-2.7% |
-3.2% |
|
Pre-tax Operating Income |
1.6% |
2.4% |
-3.1% |
|
Pre-Provision Net Revenue |
9.3% |
13.1% |
10.9% |
|
Return on Equity |
109 (bps) |
-46 (bps) |
-49 (bps) |
|
1-Year TSR at 12/31/22 |
4.3% |
-7.8% |
-0.8% |
|
1-Year TSR at 12/31/21 |
40.5% |
39.3% |
25.5% |
|
3-Year TSR at 12/31/22 (compound annual growth rate, or CAGR) |
3.4% |
2.6% |
2.1% |
|
3-Year TSR at 12/31/21 (compound annual growth rate, or CAGR) |
8.5% |
14.4% |
10.0% |
Note: bps – Basis points. Source: S&P Capital IQ Financial Database.
CEO Annual Incentive Payouts
At median, CEO annual incentive payouts were above target across all groups but decreased 9 and 17 percent year-over-year for the small and medium banks, respectively; 11 banks paid bonuses below target compared to just five last year. Payouts among the larger banks increased modestly at all percentiles year-over-year despite poorer performance in 2022, which can be attributed to market-based increases in target bonus opportunities following strong 2021 results and high performance on individual and strategic components.
Total Pay Changes
Despite a moderation in financial performance and annual incentive payouts as a percent of target, CEO actual total compensation1 (base salary, annual incentive payouts, and long-term incentives) increased for all asset groups in 2022. Large banks saw the largest increase in total compensation (+12 percent), and CEO pay at small and medium banks increased +5 percent and +3 percent, respectively. The 12 percent increase among the large banks was primarily driven by annual incentive payouts (+19 percent). Increases for small and medium banks were led by long-term incentive increases of +16 percent and +4 percent, respectively. While long-term incentive grant date values are generally determined by competitive market positioning, the comparatively strong 2022 performance among small banks amidst an industry-wide downturn may have had an outsized impact on this compensation element. The increase in annual bonuses among large banks can be attributed to market-based adjustments to target opportunities year-over-year and strong performance against individual or strategic goals; about 80 percent of large banks consider such goals, which are primarily determined on a discretionary basis and subject to greater volatility in a given year. Like 2021, base salary values were consistent across the banks, with increases ranging from about 3 to 5 percent at median.
Note: Excludes companies where there was a change in CEO.
Chief Executive Officer Pay Mix
Like our findings from prior years, CEOs at the larger banks have higher overall pay levels and more of their total pay delivered in at-risk or variable compensation (i.e., annual or long-term incentives). Conversely, CEOs at smaller banks are often paid more fixed compensation (i.e., base salary). The portion of total compensation delivered in the form of long-term incentives increased year-over-year for both small banks – from 18 percent in 2021 to 23 percent in 2022 – and medium banks – from 23 percent in 2021 to 28 percent in 2022. The pay mix for large banks was similar year-over-year.
Pay Practices
Annual Incentive Plans
The most common annual incentive plan funding approach is “goal attainment,” in which actual financial achievement is compared to pre-established goals made at the beginning of the fiscal year. The banks in our sample typically utilize several corporate metrics when determining their annual incentive payouts. Approximately 75 percent of the small, medium and large banks use three or more weighted financial metrics. Efficiency Ratio, EPS, Asset Quality (i.e., non-performing assets, non-performing loan ratio) and ROA are among the most prevalent metrics used at these banks. Among the banks that use them, Earnings (EPS and Net Income) were typically weighted more (approximately 25 to 50 percent of the total plan) than Returns (ROA or ROE), Efficiency Ratio and Asset Quality metrics (approximately 15 to 25 percent of the total plan). The small and medium banks differ from the large banks in that they more frequently use Loan or Deposit measures in their plans, with these metrics accounting for no more than 30 percent of the total plan.
Individual goals are prevalent among all asset groups. The small and medium banks predominantly incorporate individual performance as a standalone weighted metric (typically 20 percent weighting), while half of the large banks that measure individual performance use a discretionary assessment. The medium and large banks are more likely to incorporate strategic goals such as audit quality, risk management, net promoter score, succession planning, customer service and technology initiatives.
Long-term Incentive (LTI) Plans
The most typical long-term incentives used across industries, including the banking industry, include stock options, time-vested stock (restricted stock [RS] or restricted stock units [RSUs]) and performance-vested stock. Like the broader market, the banks in our sample use a portfolio approach for their LTI plans, with nearly 75 percent of these banks granting two or three LTI vehicles. The small and medium banks more frequently use a single LTI vehicle (31 percent, on average), and only one bank in the entire sample does not grant equity. The LTI mix among the three groups is consistent, with stock options continuing to be the least utilized equity vehicle – on average about 1 to 7 percent of the overall LTI mix. Time-vested RS typically comprises about 30 to 45 percent of the LTI mix among these banks, with performance plans making up the bulk (about 55 to 65 percent) of LTI plans in the total sample.
Performance-based awards are typically granted annually and have overlapping 3-year performance periods. Payouts can fluctuate based on achievement of performance measures, and the upside is normally limited to 150 to 200 percent of the target level. Approximately 80 percent of companies in each asset grouping (that utilize performance plans) measure performance against two to four metrics. The most prevalent metrics used are Returns, relative TSR and EPS for all three groupings, and it is common that two of these measures are paired together to determine all, or the majority of, the payout.
TSR is almost exclusively measured on a relative basis, often measured against either the company-defined peer group or an industry index. In our sample, relative TSR is used mostly as a weighted metric, and only 5 percent of all banks use it as a modifier of the calculated payout. Other common relative metrics include ROE, ROA and EPS growth. Among the total sample, approximately 55 percent of banks use a relative measure other than TSR.
ESG in Incentive Plans
Given that ESG issues remain an area of focus for employees, institutional investors, and the public, banks are increasingly linking compensation to measurable ESG initiatives such as DE&I. Among the banks in our sample, while still a minority practice, we have seen an uptick in the use of ESG metrics in incentive plans. In 2022, 10 banks included ESG goals in their annual incentive plans, up from five in 2021. Most banks measure performance on a qualitative basis either as part of a standalone strategic or individual component (weighted 10 to 25 percent), or as part of a discretionary adjustment to plan funding. Two banks (Evans Bancorp and Berkshire Hills Bancorp) have standalone weighted components of their annual incentive plans tied to ESG (15 to 20 percent, respectively), a unique practice among the sample. The inclusion of these goals continues to evolve, and we may see banks revisit the use of ESG goals in incentive plans given the recent Supreme Court decision on affirmative action and a rise in anti-ESG shareholder proposals. While larger banks may continue to lead the push for ESG metric incorporation in incentive plans, we may see greater hesitance from small and medium banks as uncertainties abound regarding this hot-button issue.
Looking Ahead
Each week brings new and potentially conflicting signals about the health of the economy. For the banking industry, there continues to be uncertainty surrounding the rise in interest rates, consumer spending habits, inflationary environment, deposit competition, unrealized losses in bond portfolios, worsening credit conditions and the overall regulatory environment. As we approach the final months of 2023, financial performance and incentive plan results will be heavily impacted by the interest rate environment, decrease in mortgage origination, economy’s impact on loan quality and interest rate spreads, volatility with provisioning, and competition for deposits.
As of the 2nd quarter of 2023, regional banks have posted flat year-over-year returns and earnings, poorer Efficiency Ratios, slower deposit growth and double-digit decreases in TSR. However, despite the Federal Reserve raising interest rates to a 22-year high, the economy remains resilient, inflation is leveling off at lower rates than in 2022, unemployment is low, residential housing construction and consumer spending are strong, credit quality remains sound, and loan losses are at historically low levels.
Each bank’s financial performance is impacted differently based on asset size, product mix, sector mix / concentration, growth strategy, and loan portfolio. As we approach the end of 2023, all banks will need to strike a balance between aligning pay with financial results and shareholder returns, which may be challenging in the current environment of moderate to flat growth and profitability and double-digit decreases in stock price performance.
For questions or more information, please contact:
Kelly Malafis
Partner
[email protected]
212-921-9357
Shaun Bisman
Principal
[email protected]
212-921-9365
Theo Allen
Associate
[email protected]
646-568-1157
Hanna Borsack and Gray Broaddus provided research assistance for this report.
Regional Banks in CAP’s Study (n=40)
Small Banks ($1B – $5B in assets)
- Bar Harbor Bankshares
- Capital City Bank Group, Inc.
- Central Valley Community Bancorp
- Enterprise Bancorp, Inc.
- Evans Bancorp, Inc.
- Farmers National Banc Corp.
- First Business Financial Services, Inc.
- First Financial Northwest, Inc.
- Independent Bank Corporation
- LCNB Corp.
- National Bankshares, Inc.
- Oak Valley Bancorp
- Sierra Bancorp
Medium Banks ($5B – $10B in assets)
- 1st Source Corporation
- Amerant Bancorp Inc.
- Banc of California, Inc.
- Brookline Bancorp, Inc.
- Camden National Corporation
- CNB Financial Corporation
- First Commonwealth Financial Corporation
- German American Bancorp, Inc.
- Heritage Commerce Corp.
- Park National Corporation
- Stock Yards Bancorp, Inc.
- Univest Financial Corporation
- Westamerica Bancorporation
Large Banks ($10B – $20B in assets)
- Atlantic Union Bankshares Corporation
- Banner Corporation
- Berkshire Hills Bancorp, Inc.
- Community Bank System, Inc.
- Enterprise Financial Services Corp.
- First Busey Corporation
- First Foundation Inc.
- First Merchants Corporation
- Heartland Financial USA, Inc.
- Lakeland Bancorp, Inc.
- Renasant Corporation
- Seacoast Banking Corporation of Florida
- Trustmark Corporation
- WesBanco, Inc.
1 For 2022, includes 2022 base salary, annual incentive payout based on 2022 performance and 2023 long-term incentive grants. For 2021, includes 2021 base salary, annual incentive payout based on 2021 performance and 2022 long-term incentive grants.
Compensation Advisory Partners (CAP) is conducting a market pulse survey to get a sense of banks’ compensation expectations for the balance of 2023 and initial thinking for 2024. Questions will cover salary increases, 2023 projected bonus funding and retention awards. We estimate the survey will only take 5 minutes to complete and are asking for submissions no later than Friday, June 30. We will distribute results on an aggregate basis to all participants at no cost. Individual results will be kept confidential.
2022 Results
Following an exceptional 2021 for the banking industry, 2022 performance results were mixed with results varying significantly from bank to bank based on business mix. Overall, revenue increased in 2022, driven by high interest rates. At the same time, net Income declined somewhat but remained well-above 2020 levels. In line with these results, CEO compensation increased in 2022 but more modestly than it did in 2021.
|
Summary Data (n=55) |
Change in Total CEO Compensation |
|
|
2021 vs. 2020 |
2022 vs. 2021 |
|
|
75th Percentile |
+30.1% |
+15.9% |
|
Median |
+21.5% |
+7.0% |
|
25th Percentile |
+12.6% |
+0.0% |
2022 bonuses, which payout based on annual performance results, paid out above target, though to a lesser degree than 2021.
|
Summary Data (n=51) |
CEO Bonus as a % of Target |
|
|
2021 |
2022 |
|
|
75th Percentile |
162% |
155% |
|
Median |
143% |
130% |
|
25th Percentile |
128% |
112% |
2023 Results To-Date and Outlook
The first half of 2023 has been a volatile period in the banking industry, marked by the failures of Silicon Valley Bank, Silvergate, Signature, and First Republic in the U.S. and Credit Suisse internationally. In the wake of these bank failures, the macroeconomic uncertainty that lies ahead and potential regulation and the impact it could have on performance has led to depressed stock prices for many banks. The S&P 500 Banking index has decreased 14% since the end of 2022 compared to the broader S&P 500, which has increased 10% over the same period.
Many banks are beginning to consider the impact these dynamics will have on their compensation programs. CAP is conducting a market pulse survey to get a sense of banks’ compensation expectations for the balance of 2023 and initial thinking for 2024.
Please use the link below to participate in the survey. The survey should only take 5 minutes to complete and the deadline to participate is Friday, June 30. We will distribute results on an aggregate basis to all participants at no cost. Individual results will be kept confidential.
Click here to participate in the survey.
If you have any questions, please contact Kelly Malafis ([email protected]), Eric Hosken ([email protected]), Mike Bonner ([email protected]), or Shaun Bisman ([email protected])
Kelly Malafis and Michael Bonner discuss compensation practices and trends in the banking and financial services industry.
Key Takeaways
- Publicly traded, advisory-focused investment banks posted outstanding performance in 2021, surging out of the COVID-19 pandemic with demand for advisory services fueled by low interest rates and high economic activity.
- Median total pay levels for Chief Executive Officers (CEOs) increased 30% from the 2020 to 2021 performance years. Pay was up 33% for Chief Financial Officers (CFOs), and up 32% on average for other Named Executive Officers (NEOs). Pay levels at investment banking firms are highly correlated with revenue, which increased year-over-year 30% at median for the companies in our study.
- Looking toward first quarter 2023 incentive compensation decisions, investment banks are contending with lower year-over-year revenue and profit performance and high interest rates. CAP is projecting that – on average – total compensation levels will fall at least 15% to 25% for the 2022 fiscal year.
- CAP’s study is based on a sample of 12 publicly traded investment banks with revenue ranging from $300 million to $10 billion. CAP also looked at three large, diversified financial services companies that have significant investment banking operations. These three companies – with revenue ranging from $60 billion to $130 billion – are referred to as Wall Street Banks in this report.
Compensation & Benefits Expense vs. Revenue
CAP expects total pay at public investment banks to decrease at least 15% to 25% for 2022, on average, versus prior year.
Investment banks’ success depends on their human capital. As a result, the primary operating expense is compensation and benefits. Given how critical human capital is, investment banks report the portion of their revenue allocated to compensation and benefits expenses for all employees.
CAP looked at the relationship between changes in compensation and benefits expenses and changes in revenue over the last five years and – as expected – found a strong relationship between the two. The median revenue increase for the 2021 fiscal year was 30%; the median increase in compensation and benefits expenses for all employees was 23%. Changes in revenue are highly predictive of changes in pay.
The analysis found that, looking back at the last 5 years, for every 1.0% change revenue there was approximately a 0.75% change in compensation and benefits expense.
Key Financials
2021 performance was outstanding compared to the prior year, also a strong year. Like many U.S. companies, investment banks are experiencing a slowdown in 2022.
|
Publicly Traded Investment Banks: Financial Summary |
|||
|
FY 2020 |
FY 2021 |
Est. FY 2022* |
|
|
Revenue |
+13% |
+30% |
-19% |
|
Net Income |
+29% |
+68% |
-31% |
|
Operating Income |
+59% |
+65% |
-32% |
|
Operating Margin |
-0.5 pts |
+5 pts |
-3.2 pts |
|
Comp. & Benefits |
+15% |
+22% |
n/a |
|
1-Year TSR |
+ 28% |
+45% |
n/a |
*Reflects analyst consensus estimates per S&P Capital IQ
Executive Compensation in a Human Capital-Focused Industry
Given the importance of human capital to investment banks, they report a supplemental metric in their financial statements: the compensation and benefits ratio. The ratio is calculated by dividing compensation and benefits expenses by total revenue. The investment banks typically try to manage their compensation and benefits expenses within a certain range. For the past three years, the compensation and benefits expense has generally fallen in the range of 58% to 68%.
In contrast, the Wall Street Banks are diversified financial services companies with broader business lines, including wealth and investment management, brokerage and banking. The Wall Street Banks’ compensation and benefits ratios tend to fall in the 30% to 40% range.
Investment banks approach executive compensation differently than companies in general industry. While general industry practice is to target competitive pay in total and by component, investment banks calibrate total pay to annual performance using structured discretion. Structured discretion considers firm performance, as well as unit and individual performance. Revenue is the key driver of company performance.
The resulting pay mix for investment banking NEOs is heavily weighted toward incentives, as shown below.
Many public investment banks offer add-on long-term incentives based on multi-year performance. Performance-based plans for the CEO and NEOs are favored by shareholders and proxy advisors.
Key Compensation Metrics
Investment banks tend to grant more shares as a percent of common stock outstanding compared to other industries because of the human capital-focused nature of the business and the prevalence of granting equity deep in the organization. These companies often focus on “net burn rate” when reviewing annual equity use.
For the investment bank sample, median equity overhang exceeds the ISS acceptable “excessive dilution” threshold. The ISS threshold does not consider the unique industry factors that cause higher overhang in the investment banking industry.
Equity Overhang measures potential shareholder dilution, calculated as shares outstanding and shares available for grant under equity compensation plans divided by common stock outstanding.
Net Equity Burn Rate, shown below, which can also be referred to as Net Burn Rate, measures shareholder dilution from equity awards made in a particular fiscal year, calculated as the difference of shares granted and forfeited or repurchased under equity compensation plans, divided by common stock outstanding.
Looking Ahead
- On average, incentive pay based on fiscal year 2022 performance is expected to fall at least 15% to 25% given projected declines in 2022 financial results
- Further cost-cutting and headcount reductions are expected in Q1 2023 given the projected decline in results for the 2022 performance year; however, some investment banks have signaled their commitment to maintaining staff through the downturn in results
For questions or more information, please contact:
Bonnie Schindler
Principal
[email protected]
847-636-8919
Matt Vnuk
Partner
[email protected]
212-921-9364
Louisa Heywood
Senior Analyst
[email protected]
646-568-1160
About the Sample
Investment Banks
12 publicly traded, advisory-focused investment banks:
- Cowen
- Evercore
- Greenhill & Co.
- Houlihan Lokey
- Jefferies
- Lazard
- Moelis & Company
- Perella Weinberg
- Piper Sandler Companies
- PJT Partners
- Raymond James
- Stifel
Wall Street Banks
Supplementary group with significant investment banking operations
- Goldman Sachs
- JPMorgan Chase
- Morgan Stanley
Compensation Advisory Partners (CAP) conducted a study of executive compensation trends in the banking industry. The study includes 18 U.S. banks with greater than $50 billion in assets across three groups: Money Center banks (n=4), Custody banks (n=3), and Super Regional banks (n=11). This report summarizes the findings of CAP's study, including the relationship between pay and performance in 2021, executive compensation trends, and outlook for the industry in 2022.
Key Themes
- 2021 Pay and Performance Outcomes
Chief executive officer (CEO) compensation increased 21% at median, primarily through higher incentives. Increases in CEO pay were in line with strong 2021 earnings, which were buoyed by releases of loan loss provisions taken in 2020. - Incentive Plan Design Trends
All banks in this study considered Diversity, Equity and Inclusion (DE&I) progress as part of the annual incentive decision in 2021, typically evaluated on a qualitative basis. - Special Retention Awards
The use special one-time long-term incentive awards increased among large financial services companies, including the banks in our study, in 2021. These awards, in some cases, received pushback from shareholders and proxy advisory firms that resulted in lower Say-on-Pay outcomes. - Looking Ahead
The performance outlook for 2022 is less certain. Results may vary significantly based on business mix and balance sheet makeup.
2021 Pay and Performance Outcomes – Significant Pay Increases for Strong Results
The banks in CAP’s study had strong bottom line results in 2021. Earnings per share (EPS) and Return on Equity (ROE) improved significantly versus 2020 as the credit environment improved, and banks reversed pandemic-related loan loss provisions from 2020. Over the same period, Pre-Provision Net Revenue (PPNR), which does not include the impact of loan loss provisions, was down at median, though several banks in our study grew PPNR versus 2020 primarily through increases in fee income. 1-year Total Shareholder Return (TSR) was strong over this period. 2021 TSR for the banks in CAP’s study was +38 percent, at median, while the S&P 500 returned +29 percent.
The chart below summarizes median performance results for the banks in CAP’s study:
|
Metric |
Median Percent Change |
|
|
Year Ended |
Year Ended |
|
|
Earnings per Share |
-29.5% |
+96.2% |
|
Pre-Provision Net Revenue |
-0.2% |
-5.2% |
|
Return on Equity (Basis Point Change) |
-371 bps |
+527 bps |
|
1-Year Total Shareholder Return |
-11.4% |
+37.6% |
|
3-Year Total Shareholder Return (Cumulative) |
-3.9% |
+58.7% |
Source: S&P Capital IQ Financial Database.
In 2021, total direct compensation (i.e., the sum of base salary, annual cash bonus, and awarded long-term incentives), increased 21 percent, 18 percent, and 22 percent at median for the money center, custody, and super regional banks, respectively. Banks primarily delivered increases through incentive compensation. 2021 cash bonuses were up 36 percent at median as 2021 results surpassed target performance goals and improved significantly versus 2020 due primarily to the quicker than expected economic recovery and resulting releases of loan loss provisions. Several banks in CAP’s study even disclosed making negative adjustments to incentive plan payouts to recognize the benefit of the releases of loan loss provisions. This stands in stark contrast to 2020 where companies generally failed to meet targets set prior to the start of the pandemic and funded bonuses below target and below 2019 bonuses. Long-term incentives also increased significantly at median (i.e., +21 percent), compared to 2020 when banks increased long-term incentives more modestly (i.e., +5 percent at median).
Compensation and benefits expense increased on an absolute basis in both 2020 and 2021. However, as a percentage of revenue and net income, compensation and benefits expense increased in 2020 and decreased in 2021. This likely demonstrates that while 2020 was a challenging performance year, banks maintained a level of compensation necessary to retain key talent. In 2021, banks increased incentives to reward for improved earnings and recognize the intensely competitive talent market, but did so at a reasonable level relative to revenue and earnings growth.
Incentive Plan Design Trends – Focus on DE&I
Most banks in our study did not make changes to annual or long-term incentive plan metrics or structure in 2021. One area that continues to evolve is how banks tie incentives to Environmental, Social, and Governance (ESG) considerations. As companies and shareholders spend more time focusing on ESG strategies, companies are increasingly incorporating ESG metrics into incentive plans to support these strategies. To-date banks have primarily focused on DE&I in incentive plans. All of the banks in our study disclose considering DE&I achievements as part of the incentive decision-making process. Most banks include DE&I in the individual or strategic component of the annual incentive plan and evaluate results on a qualitative basis. Specific metrics include diversity in hiring, use of diverse suppliers, and employee engagement. Several banks in our study also disclose considering other ESG factors (e.g., aligning investing activities to climate commitments) as part of the annual incentive determination.
Special Equity Awards
We noted an increased use of special one-time equity awards among banks in 2021 and 2022 to-date. Such awards are typically reserved for special situations, such as supporting retention and incentivizing significant growth or business transformation. These awards, particularly those that provide executives with the opportunity to earn significant value, are often subject to longer-term vesting periods (i.e., five or more years) and payout based on the achievement of shareholder value creation goals. Shareholders and proxy advisory firms often push back on these types of awards, demonstrated by the decline in Say-on-Pay support in 2022 for many of the banks that granted special equity awards in 2021.
One notable example in our study is JPMorgan. The bank granted awards worth $53 million and $28 million to the CEO and President & COO, respectively, to support retention of these key leaders. The awards consisted of stock appreciation rights that vest after five years. Likely due to the significant value of these awards, both major proxy advisory firms, Institutional Shareholder Services (ISS) and Glass Lewis, recommended that shareholders vote against JPMorgan’s Say-on-Pay proposal and JPMorgan failed Say-on-Pay, receiving only 31% support from shareholders.
Looking Ahead to the Second Half of 2022
2021 was a strong earnings year for banks and executive compensation levels reflected that. The outlook for 2022 is less certain and performance results may vary significantly based on business mix and balance sheet makeup. Provision releases, which had a significant positive impact on bank earnings in 2021, will likely not be available to banks in 2022. Additionally, the rising interest rate environment, inflation, and macroeconomic uncertainty are expected to impact bank performance in 2022.
The Federal Reserve has increased interest rates significantly in 2022 and anticipates additional rate hikes in the second half of the year. Rising interest rates are expected to drive higher net interest income but decrease demand for loans. The degree to which the rate environment benefits 2022 earnings will vary by bank based on the sensitivity of the balance sheet to increases in interest rates and the cost of funds.
The volume and value of mergers and acquisitions (M&A) transactions are expected to decline in 2022 due to economic uncertainty, inflation, and rising interest rates. This will adversely impact fee income for investment banking businesses.
In light of these dynamics, the first half of 2022 told a different performance story than 2021. PPNR is slightly up at median, likely due to increased interest rates, and EPS is down at median without the benefit of provision releases. Total shareholder return through the second quarter for the banks in our study is down approximately 20% at median, commensurate with the S&P 500. At the same time, the current talent market is intensely competitive, particularly in key areas for banks such as digital and commercial banking. As we approach the end of 2022, banks will need to balance aligning pay with 2022 performance results and shareholder returns, which may be down versus 2021, with the need to attract and retain critical talent.
For questions or more information, please contact:
Eric Hosken
Partner
[email protected]
212-921-9363
Mike Bonner
Principal
[email protected]
646-486-9744
Stefanie Kushner
Associate
[email protected]
646-532-5931
Theo Allen and Felipe Cambeiro provided research assistance for this report.
Banks in CAP’s Study (n=18)
Money Center Banks
- Bank of America Corporation
- Citigroup, Inc.
- JPMorgan Chase & Co.
- Wells Fargo & Company
Custody Banks
- The Bank of New York Mellon Corporation
- Northern Trust Corporation
- State Street Corporation
Super Regional Banks
- Citizens Financial Group, Inc.
- Comerica, Inc.
- Fifth Third Bancorp
- Huntington Bancshares, Inc.
- KeyCorp
- M&T Bank Corporation
- The PNC Financial Services Group, Inc.
- Regions Financial Corporation
- Truist Financial Corporation
- U.S. Bancorp
- Zions Bancorporation
Compensation Advisory Partners (CAP) examined 2020 CEO compensation levels and pay practices among 40 regional banks. The banks were analyzed using three groups based on FY’20 asset size: $1B – $5B in assets (“small banks”; n=13), $5B – $10B in assets (“medium banks”; n=13) and $10B – $20B in assets (“large banks”; n=14). This report discusses both the similarities and differences in compensation levels and incentive plan design, including COVID-related compensation changes between the three groups. We also highlight current issues facing the banking industry in 2021 and as we head into 2022.
Highlights
- 2020 Performance and Pay Outcomes: 2020 was a down year for banks resulting in annual incentive payouts at or below target for all three groups; CEO compensation was generally flat compared to 2019 levels
- COVID-Related Compensation Changes: Over 60% of the banks made changes due to COVID to recognize the unforeseen impact of the pandemic and overall performance within a challenging year; most prevalent change was exercising discretion to adjust the annual incentive payout. Larger banks were more likely to make changes to incentive plans due to COVID as the larger banks place more weight on metrics impacted by loan loss provisions and less on qualitative (subjective) factors
- Total Pay Mix: As banks increase in size, a higher percentage of CEO total pay shifts from fixed compensation to at-risk or variable compensation
- Annual Incentive Plan Metrics: For all banks, the most prevalent metrics generally include Asset Quality, Efficiency Ratio, Earnings Per Share (EPS), Return on Assets (ROA), Net Income, and Return on Equity (ROE), with smaller banks also factoring in Loan and Deposit levels more frequently
- Long-Term Incentive Plan Metrics: For all banks, relative Total Shareholder Return (TSR), ROE, EPS and ROA are frequently used together
- Looking Ahead: Future monetary policy will play a key role in banks' financial performance. Specifically, inflation and the interest rate environment will have an impact on banks' profitability. Additionally, Environmental, Social, and Governance (ESG) continues to gain attention and is a topic increasingly discussed at the Compensation Committee and Board level
2020 Performance and Pay Outcomes
Performance Results
Across all banks in the sample, financial and stock performance were weaker in 2020 compared to a strong performance year in 2019. Impacting performance in 2020 was the COVID-19 pandemic, specifically, government mandated shut-downs, high unemployment leading many financial companies to provide relief on mortgages and interest rates kept at zero. Additionally, the volatility from current expected credit losses (CECL) and the new loan loss provisioning standard materially impacted earnings. Earnings somewhat benefited from the Paycheck Protection Program. Excluding the impact of loan loss provisions, pre-provision net revenue growth was strong for all the banks. When comparing financial performance across all three groups, the small banks had the strongest performance year in 2020. Medium banks had the weakest performance year among the three groups, as earnings were down the most compared to the small and large bank groups. Negative 2020 TSR for all banks in our sample was consistent with the downward TSR trend seen in the overall market and across larger banks.
|
Metric |
Median Percent Change Year Ended December 31, 2020 |
||
|
Asset Size |
|||
|
$1B – $5B |
$5B – $10B |
$10B – $20B |
|
|
EPS |
-6.4% |
-22.3% |
-18.6% |
|
Net Income |
-8.0% |
-19.8% |
-17.2% |
|
Pre-tax Operating Income |
-4.7% |
-12.3% |
-9.7% |
|
Return on Equity |
-121 bps |
-275 bps |
-254 bps |
|
Pre-Provision Net Revenue |
+9.5% |
+7.9% |
+16.8% |
|
1-Year TSR at 12/31/20 |
-20.7% |
-19.8% |
-11.1% |
|
1-Year TSR at 12/31/19 |
27.4% |
28.1% |
22.4% |
bps – Basis points
Source: S&P Capital IQ Financial Database
CEO Annual Incentive Payouts
Small bank CEO annual incentive payouts as a percentage of target were the highest among the three groups, supported by stronger performance in 2020 based on the financials reviewed. Small banks paid annual incentives at 100 percent of target at median, and only five banks in the small bank group paid annual incentives below target, compared to seven banks in the medium bank group and eight banks in the large bank sample. Annual incentive payouts across all groups declined from 2019 levels, where all three groups generally paid out at or above target.

COVID-Related Compensation Changes
Over half of the banks in our sample made changes due to COVID to recognize the unforeseen impact of the pandemic and overall performance within a challenging year. As size increased, banks were more likely to make changes to compensation plans due to COVID, likely due to the larger banks placing more weight on metrics impacted by loan loss provisions and less weight on individual and strategic (qualitative) measures.
|
COVID-Related Compensation Changes |
|
|
Asset Size |
Percent of Companies |
|
$1B – $5B |
46% |
|
$5B – $10B |
69% |
|
$10B – $20B |
77% |
|
All Companies |
63% |
The most prevalent change was exercising discretion to adjust the annual incentive payout. Nearly all the companies that exercised discretion adjusted annual incentive payouts upward. Changes to outstanding long-term incentive plans were much less common.
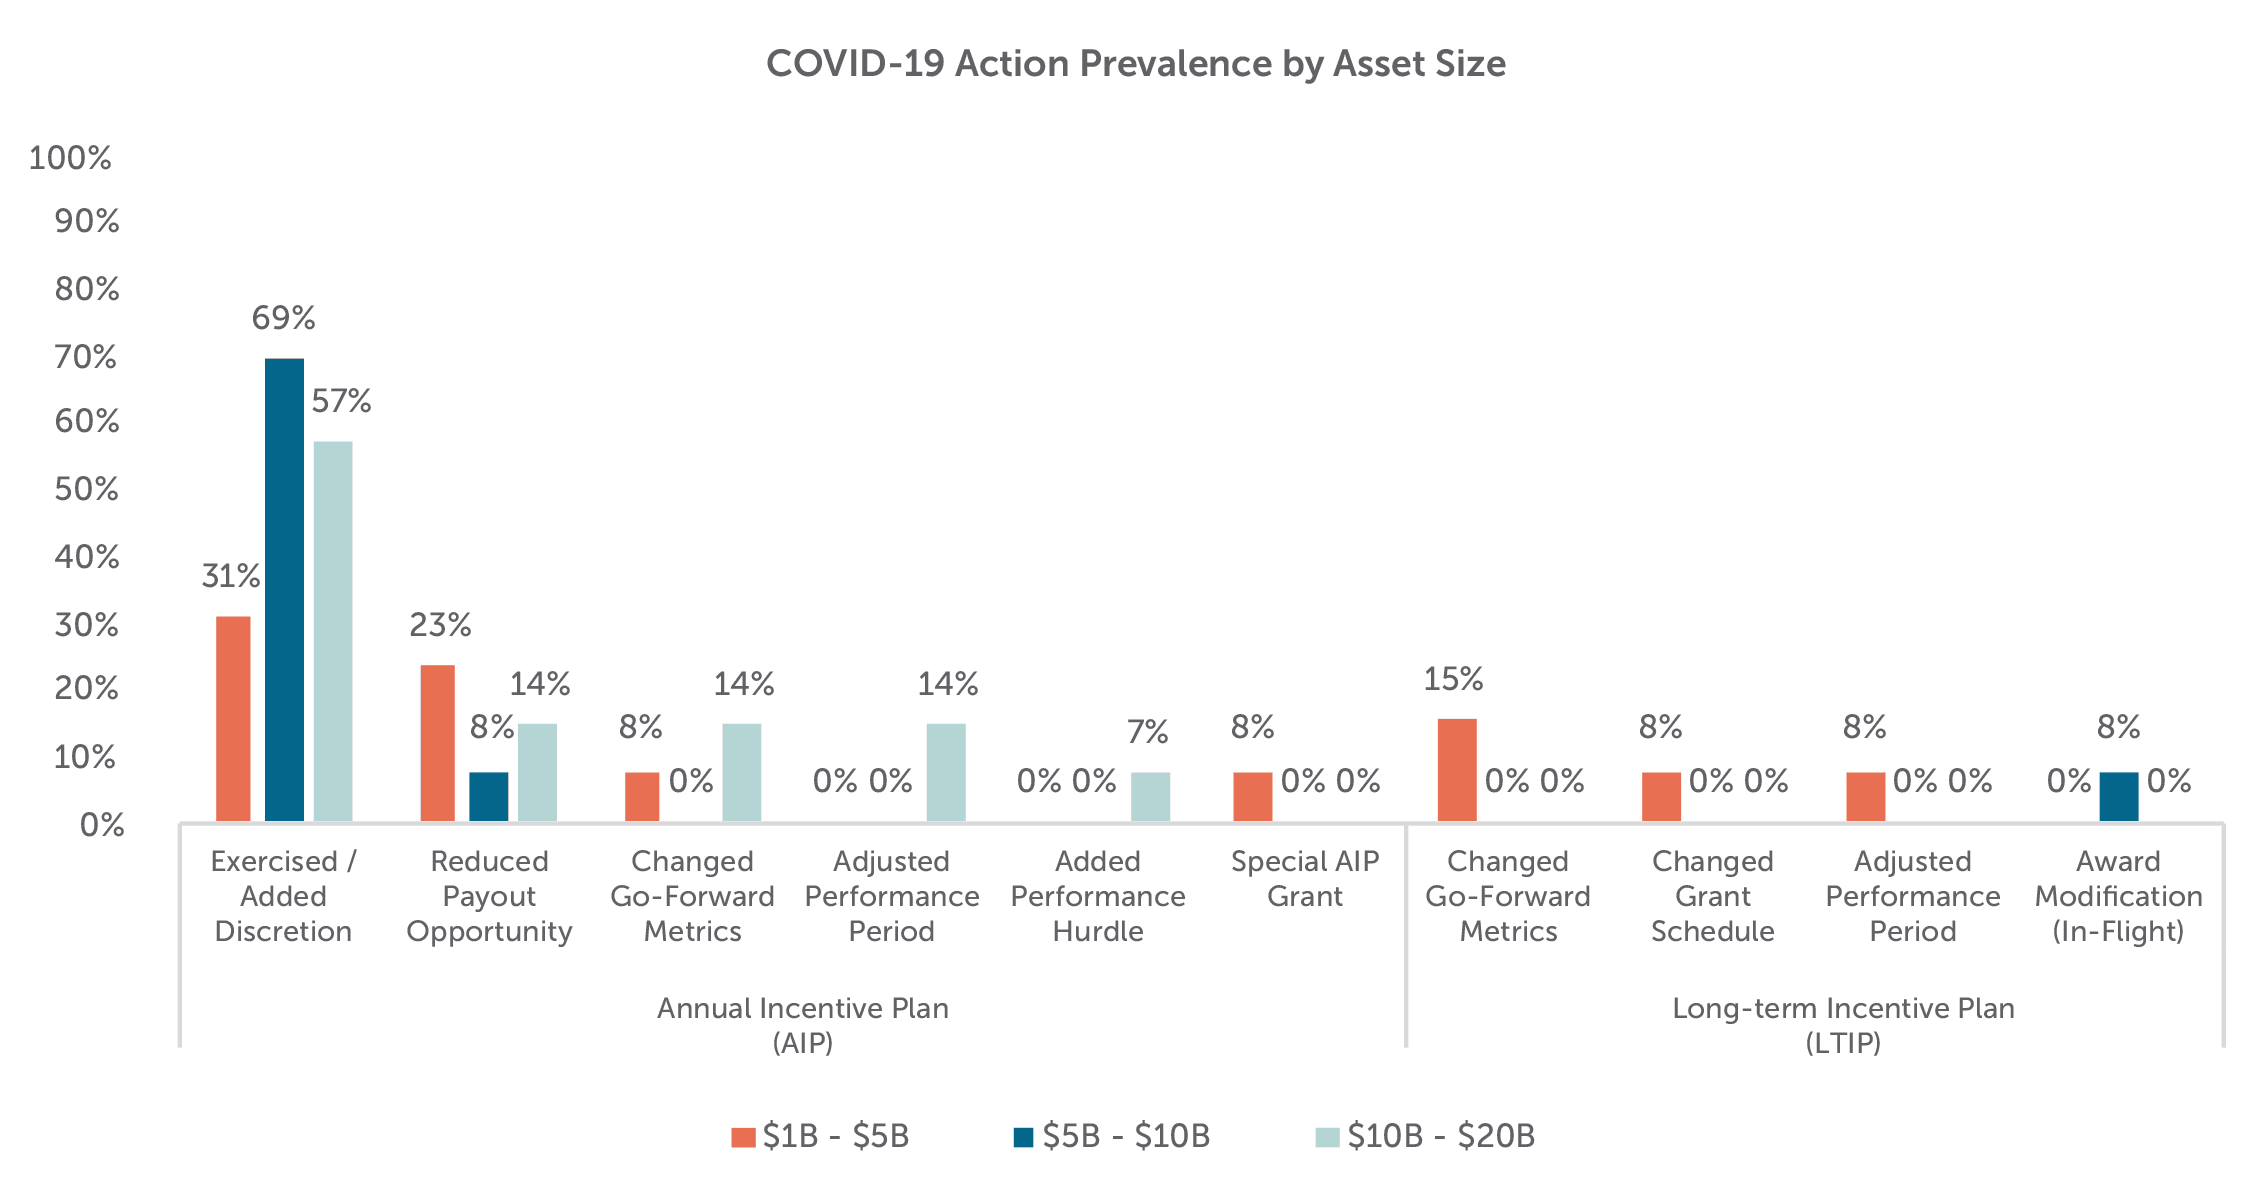
These findings are consistent with institutional shareholder and proxy advisory firm guidance around COVID-related adjustments (more openness to adjustments for annual incentives and more scrutiny on adjustments to long-term incentives) and CAP's COVID-19 research on a sample of the S&P 1500.
Total Pay Changes
Consistent with stronger relative financial performance and higher annual incentive payouts as a percent of target, small banks were the only group to see CEO actual total compensation1 (base salary, annual incentive payouts, and long-term incentives) increase in 2020. For the medium and large banks, CEO actual total compensation was flat year-over-year. The 3.8% increase among the small banks was driven by a combination of base salary increases (+3.7%) and annual incentive payouts (+6.0%). While annual incentives were paid at target for small banks (vs. 109% of target in 2019), 2020 bonus opportunity increases led to a year-over-year increase in value, as increased salaries led to increased target bonus values. Long-term incentive values were flat for the small and large banks and increased for the medium banks (+3.9%). LTI grant date values are driven less by company performance and generally determined by competitive market positioning.

Note: Excludes companies where there was a change in CEO
Chief Executive Officer (CEO) Pay Mix
Similar to our findings in prior-year studies, CEOs at the larger banks have higher pay levels and more of their total pay delivered in at-risk or variable compensation such as annual or long-term incentives. Conversely, CEOs at smaller banks are often paid more fixed compensation or base salary. For banks, asset size is a strong indicator of complexity as larger banks have more branches and a higher comprehensive list of financial accounts and services, corresponding to greater challenges and risks for management.
Pay Practices
Annual Incentive Plans
The most common annual incentive plan approach is a “goal attainment” plan where actual financial achievement is compared to pre-established goals made at the beginning of the fiscal year. The banks in our sample typically utilize several corporate metrics when determining their annual incentive payouts. Approximately 70 percent of the small, medium, and large banks use three or more weighted financial metrics. Asset Quality (i.e., non-performing assets, non-performing loan ratio), Efficiency Ratio, EPS, ROA and Net Income are the most prevalent metrics used at these banks. Returns (ROA or ROE), EPS and Net Income were typically weighted more (approximately 30-40 percent of the total plan) than Efficiency Ratio and Asset Quality metrics (approximately 15-20 percent of the total plan). The small banks differ from the medium and large banks in that they more frequently use Loan or Deposit measures in their plans, with these metrics accounting for no more than 20 percent of the total plan.

Small and medium banks also tend to use and assign higher weightings to individual performance. In all cases they represent 20-40 percent of the total plan as a standalone weighted metric. These individual measures are prevalent at 46 percent of the small and medium banks studied compared to 29 percent of the large banks; however, the large banks are more likely to incorporate strategic goals such as customer satisfaction, risk management, technology initiatives and community presence.
Long-term Incentive (LTI) Plans
The most typical long-term incentives used across industries, including the banking industry, include stock options, time-vested stock (restricted stock (RS) or restricted stock units (RSUs)) and performance-vested stock. Similar to the broader market, the banks in our sample use a portfolio approach in their long-term incentive plans, with approximately two-thirds granting two or three LTI vehicles. The small and medium banks more frequently use either a single LTI vehicle (36%) or have no long-term incentive plan (15%). The LTI mix seen between the three groupings is fairly consistent, with stock options continuing to be the least utilized LTI vehicle, averaging about 4 percent of the overall LTI mix. Time-vested RS typically makes up about 30 percent to 45 percent of the LTI mix among these banks, with performance plans comprising the bulk (about 50-65%) of LTIs in the total sample.

Performance plans are typically granted annually and have overlapping three-year performance periods. Payouts can fluctuate based on achievement of performance measures, and the upside is normally limited to 150 percent to 200 percent of the target level. Over three-quarters of companies in each asset grouping (that utilize performance plans) measure performance against two or more metrics. The most prevalent metrics used are relative TSR, Returns and EPS for all three groupings, and it is common that two of these measures are paired together to determine all, or the majority of, the payout. Asset Quality is a fairly prevalent metric among medium-sized banks (used by nearly a quarter of the companies).
TSR is almost exclusively measured on a relative basis, often against either the company-defined peer group or an industry index. In our sample of banks, relative TSR is more commonly installed as a weighted metric, and only 5 percent of all banks use it as a modifier of the calculated payout. Other common relative metrics include Returns and EPS growth. Among the total sample, 40 percent of banks use a relative measure other than TSR.

Looking Ahead
Federal Reserve Monetary Policy and Bank’s Loan Loss Provisions
As banks report third quarter 2021 financial performance, there continues to be uncertainty on the outlook of the economy and the financial performance of the banking industry. The following factors will have a lasting impact on 2021 and 2022 financial performance.
- Inflation and Impact on Interest Rates: As prices to continues to rise, the Federal Reserve may tighten monetary policy sooner than expected. Interests rates are near zero and with a rise in interest rates, banks' financials, profit margins and loan growth may be impacted depending on the monetary policy imposed by the Fed. Any increase in rates may deter borrowing and cut into demand for cars and houses, eventually slowing price increases and growth
- Government Aid Programs: Consumers and businesses were helped financially in 2020 from benefits and programs offered by the government; however, the additional income for consumers and businesses, as well as low interest rates, which were meant to bolster the economy, impacted banks' loan growth and overall profitability in 2021
- Loan Loss Provisions: Early in the pandemic, banks set aside billions of dollars to prepare for the recession, sending profits lower. Now that the economy has recovered more quickly than expected, banks have been releasing those reserves for several quarters, increasing their profits. It is not clear what “normal” financial performance is in the banking industry in the near term
- While stock price performance through September 30, 2021 has been strong for the banking sector (+23% for all banks), it is prudent for banks to be prepared for market uncertainty, and to understand how program changes can mitigate uncertainty and volatility.
ESG in Incentive Plans
ESG issues are hot-button topics among all companies, and more information is being disclosed in company filings and on their websites. Investors have increased their attention on company efforts on this topic, particularly Diversity, Equity & Inclusion (DE&I) and how progress in this area should be linked to executive pay. For banks, there is a growing focus on increasing diversity in the industry. The natural question is whether such initiatives should be including in compensation decision making. Only one bank in the sample (Trustmark Corporation) includes ESG, DE&I goals as part of a standalone weighted metric in the annual incentive plan. While not prevalent among our sample of 60 banks, Compensation Committees are discussing ESG objectives in the boardroom today. While larger banks tend to be the trendsetters, we expect smaller regional banks to follow suit, as there will be increased pressure from shareholders and the public.
Conclusion
Despite the impact COVID-19 had on bank financial performance in 2020, few companies in our sample adjusted their program designs in 2021. Compensation program practices have remained steady among our sample of banks. Adjustments for 2021 typically focus on the types of metrics used, goal setting for absolute and relative measures as well as building in some flexibility using wider performance ranges around target. For 2022, with the increased regulatory focus on ESG and continued investor attention on this topic, we expect banks to be clear on their ESG strategies and ultimately how they link to compensation. Bank directors and management teams will need to consider how to best align their pay programs with performance considering the external economic and regulatory environment.
For questions or more information, please contact:
Kelly Malafis Partner
[email protected]
212-921-9357
Shaun Bisman Principal
[email protected]
212-921-9365
Stefanie Kushner, Theo Allen and Fariha Haque provided research assistance for this report.
Regional Banks in CAP’s Study (n=40)
Small Banks ($1B – $5B in assets)
- Camden National Corporation
- Capital City Bank Group, Inc.
- Central Valley Community Bancorp
- CNB Financial Corporation
- Evans Bancorp, Inc.
- Farmers National Banc Corp.
- First Business Financial Services, Inc.
- First Financial Northwest, Inc.
- Heritage Commerce Corp
- Independent Bank Corporation
- National Bankshares, Inc.
- Sierra Bancorp
- Stock Yards Bancorp, Inc.
Medium Banks ($5B – $10B in assets)
- 1st Source Corporation
- Amerant Bancorp Inc.
- Banc of California, Inc.
- Brookline Bancorp, Inc.
- Enterprise Financial Services Corp
- First Commonwealth Financial Corporation
- First Foundation Inc.
- German American Bancorp, Inc.
- Lakeland Bancorp, Inc.
- Park National Corporation
- Seacoast Banking Corporation of Florida
- Univest Financial Corporation
- Westamerica Bancorporation
Large Banks ($10B – $20B in assets)
- Atlantic Union Bankshares Corporation
- Banner Corporation
- Berkshire Hills Bancorp, Inc.
- Cadence Bancorporation
- Community Bank System, Inc.
- First Busey Corporation
- First Merchants Corporation
- Glacier Bancorp, Inc.
- Great Western Bancorp, Inc.
- Heartland Financial USA, Inc.
- Pacific Premier Bancorp, Inc.
- Trustmark Corporation
- United Community Banks, Inc.
- WesBanco, Inc.
1 For 2020, includes 2020 base salary, 2021 annual incentive payout based on 2020 performance and 2021 long-term incentive grants. For 2019, includes 2019 base salary, 2020 annual incentive payout based on 2019 performance and 2020 long-term incentive grants.


