Blackrock, Vanguard, and State Street (the “Big Three”) are among the largest and most influential institutional investors in the world with current assets under management (AUM) of $10.0, $8.2, and $4.1 trillion respectively. Given their size, they have ownership stakes in many U.S. publicly traded companies. As a result of their holdings, the Big Three have the power to influence proxy voting outcomes, and any policy update, should be closely monitored by companies.
For the 2022 proxy season, the Big Three released their proxy voting guidelines and engagement priorities. These updates are a way for the public, and companies to understand the Big Three’s positions and priorities for 2022.
In the following chart we summarize a variety of policy updates from the Big Three that focuses on executive compensation, Compensation Committee voting, human capital management, board composition and board of director overboarding.
2022 U.S. Proxy Voting Guidelines Key Updates
|
Focus Area |
Updates |
|
Executive Compensation |
Blackrock
Vanguard
State Street
|
|
Compensation Committee Voting |
Blackrock
Vanguard
State Street
|
|
Human Capital Management (HCM) |
BlackRock
Vanguard
State Street
|
|
Board Composition |
Racial/Ethnic Diversity BlackRock
Vanguard
State Street
|
|
Board Composition |
Gender Diversity Blackrock
Vanguard
State Street
|
|
Director Overboarding |
Blackrock
Vanguard
State Street
|
As summarized above, there has been a focus over the last few years on ESG, particularly on diversity among the board of directors and workforce, human capital management and climate change (not summarized above). The Big Three believes companies that focus on these issues will enhance a company's ability to maximize long-term shareholder value.
This article highlights select changes and updates to the Big Three's voting policies. For full detail related to all the proxy voting guidelines, please visit:
Blackrock:
- BlackRock Investment Stewardship – Proxy Voting Guidelines for U.S. securities
- BlackRock Investment Stewardship – Engagement Priorities
Vanguard:
State Street:
Say on Pay arrived in 2011, born out of the SEC’s rule-making efforts to reform corporate governance under Dodd-Frank after the financial crisis. This non-binding advisory vote, which is an annual event at most companies, allows shareholders to cast votes for or against Named Executive Officer (NEO) compensation. While earning simple majority support is technically a passing result, most companies strive for and achieve significantly higher levels of support. Investor support of compensation programs is influenced by many factors, which primarily include magnitude of pay, pay practices, and stock price performance.
In 2020, COVID-19 significantly disrupted the global economy, causing many companies to re-evaluate their compensation programs. Proxy statements filed in 2021, which will discuss compensation during the COVID pandemic year, will depart from previous norms. In anticipation of these filings, CAP has reviewed Say on Pay voting results at Russell 3000 companies in 2020, and since inception, to gauge the current landscape with an eye on what may occur with 2021 Say on Pay results.
Say on Pay Overview
Russell 3000 Historic Results
2020 marked the 10th year of Say on Pay voting. To date, voting results have generally been very consistent over time. Median support among Russell 3000 companies has been approximately 95% in each of the past 10 years. Most companies receive support from over 90% of shareholders, with an average of 74% of companies receiving support in the 90-100% range. Consistent vote outcomes are seen at the top and the bottom end of the range. The percentage of companies falling in each range shown below has been consistent throughout the 10-year history of Say on Pay voting.
|
All Companies |
2020 |
2011 – 2020 |
|
|
Average |
Range |
||
|
Median Level of Support |
94.9% |
95.2% |
94.7% – 95.6% |
|
>90% Support |
74.0% |
73.8% |
70.0% – 76.8% |

Only 2.2% of companies failed to receive majority support for Say on Pay votes in 2020. The number of companies that have failed the Say on Pay vote has also been very consistent over the 10-year period, with an average of 2.0% of companies failing over the past 10 years. For companies that failed in 2020, the median level of support was approximately 38%, mirroring historical results.
|
All Companies – Failed Say on Pay Vote |
2020 |
2011 – 2020 |
|
|
Average |
Range |
||
|
% of Companies Failing |
2.2% |
2.0% |
1.4% – 2.4% |
|
Median Level of Support |
38.2% |
39.2% |
33.1% – 42.7% |
Proxy Advisor Impact
Proxy advisors have a substantial impact on the Say on Pay vote for companies. The most influential proxy advisory firm is Institutional Shareholder Services (“ISS”) which grades companies on a pay-for-performance scale to determine if, in their view, CEO pay and company performance are well-aligned. ISS will then issue a recommendation “For” or “Against” the NEO compensation program, ISS’ vote recommendation often has a substantial impact on the vote result, as outlined below.
The two main inputs that ISS looks at are CEO compensation and Total Shareholder Return compared to an ISS-defined peer group based on company size and industry. Companies will then receive a “Low”, “Medium” or “High” concern level that determines whether ISS performs a qualitative evaluation of the compensation program. The overall concern level drives ISS’ ultimate recommendation For or Against the Say on Pay resolution. Historically, approximately 95% of companies with a Low concern receive support from ISS, compared to about two-thirds of companies rated Medium concern and roughly half of the High concern companies. Often, shareholders will reference the ISS recommendation (i.e., For or Against) when casting their vote on Say on Pay; however, many institutional investors have their own proprietary tests to evaluate compensation programs at companies.
ISS has consistently recommended Against Say on Pay for approximately 12% of companies per year, over the last decade. Among companies that have failed Say on Pay, the vast majority, 96% on average, have received an Against recommendation from ISS. In 2020, roughly 20% of companies that received an ISS Against recommendation ultimately failed the vote and for all companies with an Against recommendation from ISS, the median level of support was only 67%.
|
ISS Against Recommendation Impact |
2020 |
2011 – 2020 |
|
|
Average |
Range |
||
|
% of Companies with ISS Against Recommendation |
10.4% |
11.6% |
10.0% – 13.5% |
|
% of Companies with ISS Against Recommendation Failing Say on Pay |
19.5% |
16.3% |
10.6% – 21.5% |
|
Median Level of Support |
67.0% |
67.4% |
65.1% – 70.4% |
As shown below, the percentage of companies with an ISS Against recommendation, at each support level range, has been generally consistent since the Say on Pay vote was established.

Expectations for 2021
Institutional Shareholder and Proxy Advisor Commentary
2021 proxy statement disclosures will reflect the impact of COVID-19 on company performance which influenced both executive compensation in 2020 and the development of 2021 incentive programs. While the degree of impact will vary by industry and company, many more companies than usual will disclose adjustments to their compensation programs than in past years. During 2020, shareholders and proxy advisors provided some general guidance on how they will be assessing and evaluating these unique circumstances.
Institutional shareholders and proxy advisors have both stated that they recognize that 2020 was a more challenging year than most due to the impact of COVID-19. Because of this, they will review companies on a case-by-case basis, evaluating the facts and circumstances that went into any adjustments that were made. Guidance has generally encouraged proactive, enhanced disclosure that clearly explains the situation and rationale for COVID-related changes as opposed to generic descriptions of a challenging year, which may be viewed as insufficient.
How shareholders and proxy advisors interpret and assess the COVID-related disclosures and adjustments will ultimately influence Say on Pay votes and recommendations. While ISS and Glass Lewis did not make wholesale changes to their pay-for-performance evaluations for 2021, ISS did call out key disclosure items that would help investors evaluate COVID-related changes. This indicates that there may be more discretion and flexibility applied for companies with more robust disclosure. Even with greater flexibility in the qualitative evaluations, pay-for-performance misalignment will continue to be the main driver for Against recommendations from ISS in the broader market.
CAP Expectations
Since pay-for-performance is expected to remain the primary driver for proxy advisor recommendations, Say on Pay results will continue to depend on the magnitude of pay, pay practices and stock price performance. For companies that may have a pay and performance misalignment, we expect reduced shareholder support if a company has not provided sufficient rationale for the following actions:
- Annual and long-term incentive plan adjustments
- Major employee actions (e.g., layoffs)
- Performance that is dramatically below investor expectations
- Low relative financial performance
- Above-target discretionary adjustments to payouts that previously missed threshold performance
- Awarding one-time special cash/equity grants
Shareholder outreach will be more important in 2021 as companies can use these discussions to supplement their required disclosures. Proactive outreach may help to prevent a significant impact on the Say on Pay result even if proxy advisors recommend Against a company’s compensation program. There will also likely be more disclosure on go-forward incentive programs, as the impact of COVID-19 lingers into 2021.
Say on Pay results in 2021 will likely depart from prior norms. Even if the percentages of Against recommendations and companies passing remains relatively consistent with historic levels, we expect to see a downward shift in the median level of support and in the percentage of companies receiving at least 90% support. For companies that do receive an Against recommendation from proxy advisors, the level of support may decline compared to historic norms if disclosures do not sufficiently justify the actions taken.
Conclusion
2021 Say on Pay results will likely test the “steady state” seen over the previous 10 years. While the full picture will not be clear until later this year, CAP has begun to look at companies with fiscal years ended in late 2020 to get an early read. We will continue to monitor Say on Pay results throughout the year to see how the COVID-19 pandemic shapes these results.
On February 6, 2017 the Acting Chairman of the US Securities and Exchange Commission (SEC) issued a Public Statement on Reconsideration of Pay Ratio Rule Implementation. The pay ratio rule was adopted by the SEC on August 5, 2015 under the Dodd-Frank Wall Street Reform and Consumer Protection Act. It requires companies to disclose their CEO’s annual total compensation as a multiple of the annual total compensation of the median employee for the first fiscal year beginning in 2017.
The statement indicated that “some issuers have begun to encounter unanticipated compliance difficulties that may hinder them in meeting the reporting deadline.” The SEC began a 45-day comment period for issuers to submit detailed comments on challenges they have experienced in preparing for compliance with the rule. Additionally, the staff was directed to determine whether additional guidance or relief is necessary.
Click on this link to see the full text of the Public Statement.
We believe pay ratio disclosure is an example of regulation that will be costly to implement and serves no clear purpose to benefit investors or American companies. We expect that a number of issuers will provide their comments on the challenges, cost and effort related to the preparation of compliance with the rule. This may be a first step in a major overhaul, delay or reversal of the rule.
In addition to the SEC’s Public Statement, it was reported by Bloomberg BNA that House Republicans “plan to introduce legislation to roll back the Dodd-Frank Act in mid-February”. Depending on the timing of any changes to the Dodd-Frank Act or the results of the comment review process, issuers may not have definitive direction before the summer.
We will track these issues over the coming year and keep you informed of new developments as they occur.
Christopher Y. Clark, publisher of NACD Directorship Magazine, hosts this edition of NACD BoardVision with guest Melissa Burek, partner at Compensation Advisory Partners. The discussion centers around the obvious and no so obvious results from say on pay voting, how performance fits into the results, and what surprises could be ahead in 2014.
In today’s post Dodd-Frank executive compensation market, most companies are familiar with, and many have implemented, “shareholder-friendly policies” such as clawbacks, hedging/pledging, and stock ownership guidelines. Further, companies have grown increasingly savvy on the executive compensation policies of shareholder advisory firms such as Institutional Shareholder Services (ISS) and Glass-Lewis—specifically as they relate to Say on Pay resolutions (SoP). Most executive compensation professionals—ourselves included—do not deny the influence on voting results when a company receives the dreaded Against recommendation from one or more of the proxy advisory firms. Our research shows that when ISS and Glass-Lewis recommend Against an SoP resolution, there is an approximate 20-30% and 5-15% reduction in the voting results, respectively.
Is this causation or simply correlation? Perhaps that question cannot be answered so easily, but it is possible to study how large institutional shareholders vote on SoP in order to try and understand what factors influence their voting. Companies are already aware of who their largest shareholders are, but an understanding of their voting policies and practices can provide insights on potential shareholder reaction to executive compensation program design, program modifications, and company performance.
To gain a deeper understanding of how large institutional shareholders tend to vote on SoP, CAP compiled a list of the top 25 institutional shareholders (in terms of assets under management) that were invested in at least 250 of the companies in the S&P 500 (“Institutional Shareholders”). CAP collected voting data from Proxy Insight, a leading provider of global shareholder voting analytics.
Among these Institutional Shareholders, 92% (23 out of 25) have their own “in-house” voting policies. What that means, is that even if ISS or Glass-Lewis makes a recommendation, the Institutional Shareholder will make the final determination on its voting decision. Based on 2016 voting results, Institutional Shareholders voted Against SoP 6.6% of the time, at median, for S&P 500 companies. When we expanded the scope of our review to all U.S. public companies, we found that Institutional Shareholders voted Against SoP 8.2% of the time, at median.
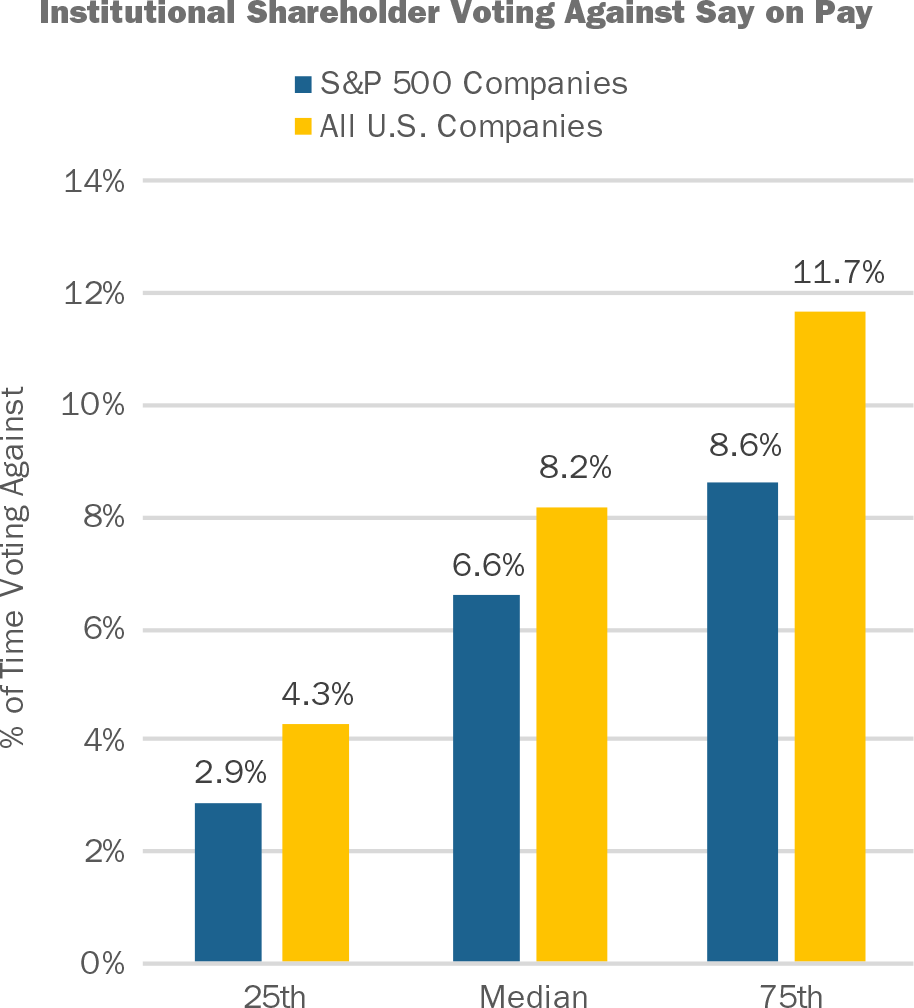
Source: Proxy Insight
Why do Against votes occur more frequently among all U.S. public companies compared to S&P 500 companies? This outcome could reflect that S&P 500 companies, in the aggregate, are larger and tend to have the resources to develop and maintain more balanced compensation programs. For example, a long-term incentive (LTI) program that is composed of a portfolio of time- and performance-based awards is viewed positively by institutional shareholders and is more common among S&P 500 companies versus all U.S. Companies. S&P 500 companies also have the capacity to lead more extensive shareholder outreach campaigns, which allows them to explain the rationale for their programs.
Although most Institutional Shareholders vote For SoP in most cases, there are some that will vote Against SoP 10% of the time or more. When voting on S&P 500 Companies, 5 out of 25 of the Institutional Shareholders vote Against 10% of the time or more. When voting on all US companies, 11 out of 25 vote Against 10% of the time or more.
|
Institutional Shareholder |
Percent of Time Voting Against SoP |
|
Institutional Shareholders Voting Against S&P 500 Companies 10% of the Time or Greater |
|
|
Robeco/RobecoSAM |
30% |
|
BNY Mellon |
27% |
|
Dimensional Fund Advisors, Inc. |
18% |
|
California Public Employees’ Retirement System (CalPERS) |
16% |
|
Schroders |
10% |
|
Institutional Shareholders Voting Against U.S. Companies 10% of the Time or Greater |
|
|
BNY Mellon |
44% |
|
Robeco/RobecoSAM |
28% |
|
Dimensional Fund Advisors, Inc. |
23% |
|
California Public Employees’ Retirement System (CalPERS) |
20% |
|
Canada Pension Plan Investment Board (CPPIB) |
13% |
|
Schroders |
13% |
|
AllianceBernstein LP |
12% |
|
T. Rowe Price Associates, Inc. |
10% |
|
AXA Investment Managers |
10% |
|
Principal Global Investors LLC |
10% |
|
RBC Global Asset Management, Inc. |
10% |
Source: Proxy Insight
CAP suggests that companies should track the voting tendencies of their major institutional shareholders, particularly if they vote Against more frequently. Companies may want to look at historical voting on SoP and should review their institutional shareholders’ proxy voting guidelines—particularly as it relates to compensation. For example, BNY Mellon voted Against SoP at 27% of S&P 500 companies and Against SoP at 44% of all U.S. companies. A review of BNY Mellon’s proxy voting guidelines states that they “consider proposals on a case-by-case basis in situations where:”
- There are tax gross-ups or make-whole provisions in CIC/severance agreements
- The company has poor relative stock performance, especially when compensation is deemed excessive compared to peers
- The company fails to address compensation issues identified in prior meetings
- There appears to be an imbalance between performance-based and time-based long-term incentive awards
Therefore, if one of your company’s major shareholders is an institutional investor that supports SoP less frequently, it is important to understand their voting guidelines, especially if your executive compensation program has practices or includes features that are viewed negatively (i.e. tax gross ups, 100% time-based LTI program, etc.).
Although most Institutional Shareholders have in-house voting policies, they do still subscribe to proxy advisory research from ISS and Glass-Lewis. Among Institutional Shareholders, 88% (22 out of 25) subscribe to ISS and 48% (12 out of 25) subscribe to Glass-Lewis. While there is only one out of these 25 Institutional Shareholders that generally automatically-votes with ISS (Principal Global Investors LLC), CAP determined that there is a correlation between an ISS or Glass-Lewis Against recommendation and voting results. When subscribing to ISS or Glass-Lewis, we found that Institutional Shareholders’ voting aligns with an Against recommendation, at median, 62% of the time for ISS subscribers and 31% of the time for Glass-Lewis subscribers. The data exhibits a greater correlation (approximately double) of vote alignment with an Against recommendation from ISS than Glass-Lewis. This may occur because Glass-Lewis recommends Against about twice as often as ISS does (16% of companies receive an Against recommendation from Glass-Lewis vs. 8% from ISS).
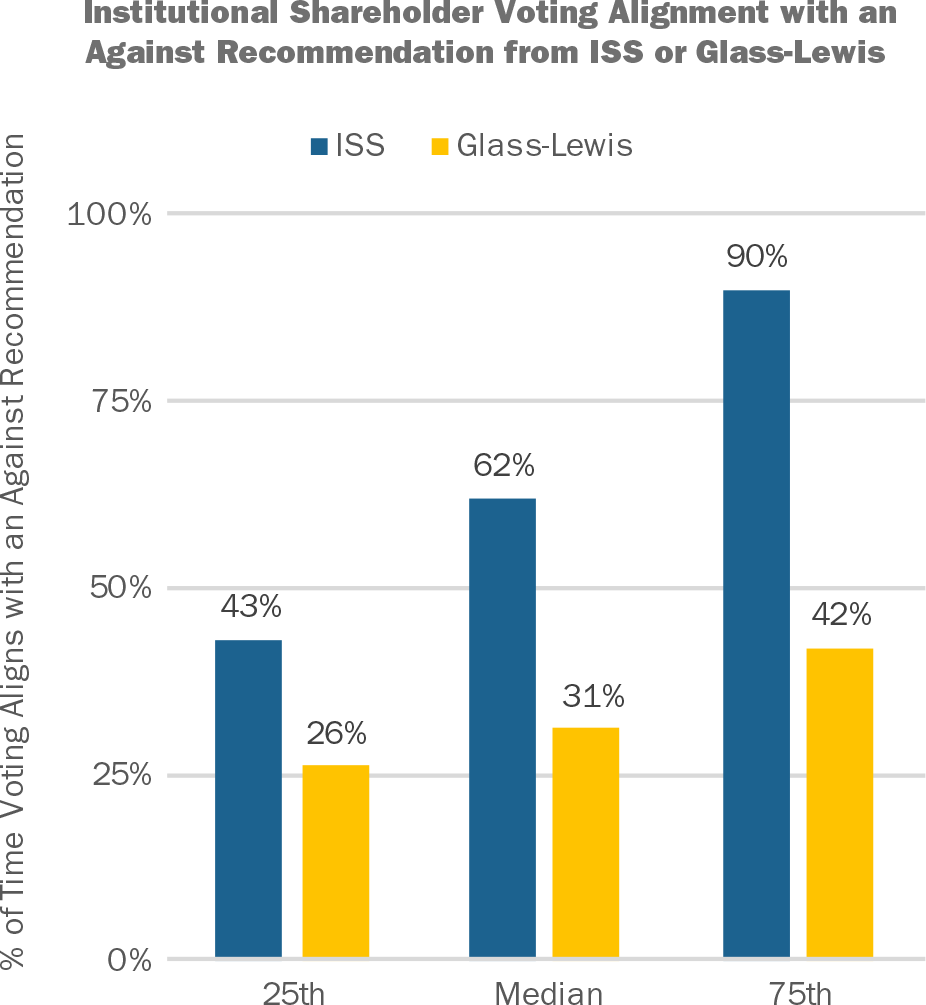
Source: Proxy Insight
As mentioned above, it is not easy to confirm whether the alignment of an Against recommendation from ISS or Glass-Lewis and voting outcomes is the result of causation or simple correlation—perhaps it is a bit of both. However, when companies are trying to understand the voting practices of their institutional shareholders, knowledge of how their institutional shareholders vote in relation to an ISS or Glass-Lewis Against recommendation is a valuable input, particularly in cases where the alignment is very consistent. Since the recommendation from ISS and Glass-Lewis precedes voting, companies can predict potential outcomes based on shareholder tendencies—particularly in cases where the institutional shareholders voting tendencies are correlated with an Against recommendation a high percentage of the time.
|
Institutional Shareholder |
Percent of Time Voting with Rec. |
|
Institutional Shareholders Voting with ISS Against Rec. Greater than 85% of the Time |
|
|
Deutsche Asset & Wealth Management |
99% |
|
Principal Global Investors LLC |
98% |
|
Canada Pension Plan Investment Board (CPPIB) |
97% |
|
RBC Global Asset Management, Inc. |
97% |
|
Dimensional Fund Advisors, Inc. |
96% |
|
AllianceBernstein LP |
91% |
|
BNY Mellon |
87% |
|
Institutional Shareholders Voting with Glass-Lewis Against Rec. Greater than 50% of the Time |
|
|
California Public Employees’ Retirement System (CalPERS) |
75% |
|
Dimensional Fund Advisors, Inc. |
60% |
|
BNY Mellon |
57% |
Source: Proxy Insight
In examples where Institutional Shareholders do not have a high correlation of voting with an ISS or Glass-Lewis Against recommendation, this can generally be attributed to those Institutional Shareholders that vote For SoP a high percentage of the time in line with their own voting policies.
In our view, it is important for companies to develop a compensation program that aligns with the business strategy, promotes shareholder growth while minimizing risk, and attracts and retains key talent. Once a framework is established, companies can then overlay an understanding of the voting practices of their institutional shareholders, including specific proxy voting guidelines, voting history, as well as the alignment of voting results with ISS or Glass-Lewis recommendations. This becomes more important in cases where the institutional shareholder votes Against SoP more frequently than the norm or follows ISS and Glass-Lewis recommendations a very high percentage of the time. While some companies may engage in comprehensive shareholder outreach programs, other companies do not have the resources for large-scale shareholder engagement. For these companies, an understanding of their institutional shareholder voting policies and practices becomes an important consideration when it comes to compensation program plan design.
Appendix
|
Institutional Shareholders Used in this Analysis |
|
|
AllianceBernstein LP |
Legg Mason Partners Fund Advisor, LLC. |
|
AXA Investment Managers |
MFS Investment Management, Inc. |
|
BlackRock |
Morgan Stanley Investment Management, Inc. |
|
BNY Mellon |
Norges Bank Investment Management |
|
California Public Employees’ Retirement System (CalPERS) |
Northern Trust Investments |
|
Canada Pension Plan Investment Board (CPPIB) |
Principal Global Investors LLC |
|
Deutsche Asset & Wealth Management |
RBC Global Asset Management, Inc. |
|
Dimensional Fund Advisors, Inc. |
Robeco/RobecoSAM |
|
Federated Investment Management Co. |
Schroders |
|
Fidelity Management & Research Co. |
SSgA Funds Management, Inc. (State Street) |
|
Fidelity SelectCo |
T. Rowe Price Associates, Inc. |
|
Franklin Templeton Investments |
Vanguard Group, Inc. |
|
Goldman Sachs Asset Management LP |
|
ISS released the results of its 2016-2017 policy survey on September 29, 2016. The survey results will play an important role in shaping ISS’ policies for the 2017 proxy season. ISS Indicated that a draft of their 2017 policy updates will be published in late October, subject to public comment. Final policy updates are scheduled for publication in mid-November, with policy updates effective February 1, 2017.
417 organizations participated in ISS’ survey, including 115 institutional investors and 270 corporate issuers. 33% of investor responses came from institutions with $100 billion in assets or more, while 25% came from institutions with $10 – $100 billion in assets.
Highlights of the survey results related to U.S. executive compensation and corporate governance topics are summarized below:
Say on Pay Frequency: Survey participants were asked whether they favored annual, biennial or triennial say on pay proposals. Fully 66% of investors favored annual say on pay votes. Corporate issuers were more likely to favor biennial or triennial votes, but fully 42% voted for annual say on pay proposals. Based on the results of the survey, we do not expect ISS to make any changes to its existing policy of supporting annual say on pay vote frequency.
Metrics for Pay-for-Performance Alignment: ISS currently uses Total Shareholder Return (“TSR”) to assess pay-for-performance alignment, measuring relative TSR performance compared to peers over 3 years and measuring the absolute trend in TSR over 5 years. Survey participants were asked if other metrics should be incorporated in the initial screen. High levels of support were recorded for metrics other than TSR, with 79% of investors and 68% of corporate issuers voting in favor.
Investors identified Return on Investment metrics, such as Return on Invested Capital (ROIC), as the best metrics to be incorporated into pay-for-performance alignment screens. Detailed results are shown below:
|
Metrics |
% of Investors Favoring |
% of Non-Investors Favoring |
|
Return on Investment metrics |
47% |
23% |
|
Other Return metrics (i.e, ROA or ROE) |
35% |
18% |
|
Earnings metrics |
26% |
38% |
|
Cash Flow metrics |
25% |
20% |
|
Economic Profit metrics |
22% |
9% |
|
Revenue metrics |
18% |
24% |
|
Other metrics |
16% |
10% |
We suspect that ISS may modify its pay-for-performance model to incorporate additional measures in the future, based on this feedback. However, it may be challenging to implement for the coming year as it is difficult to find a single financial performance measure that is useful for performance comparisons in all industries. We will closely monitor ISS’ proposed policy revisions to see what changes, if any, that they make to the pay-for-performance assessment.
Board Refreshment: Lack of board refreshment is viewed as problematic by more than 50% of investors. Refreshment measurements that caused concern include lack of newly appointed directors (i.e., within the last 5 years), average tenure greater than 10 or 15 years and/or a high proportion of directors with long tenure.
Overboarding: More than 60% of investors indicated a preference for applying the same standard for overboarding to active executive chairs as currently applies to active CEOs – no more than three total boards. A minority supported the more lenient standard applicable to non-executive directors – no more than five total boards.
Next Steps
We will monitor ISS’ draft policy proposal (expected in October) and final policy issuance (expected in November) and will provide an updated CAPflash highlighting any material changes from ISS’ current policies. Based on this year’s survey results, there is potential for significant changes from the current policy, particularly for Pay-for-Performance alignment. Movement away from TSR as the sole metric would be welcomed by many companies as well as by most investors.
Full results of ISS’ policy survey can be found at www.issgovernance.com. If you wish to discuss the results, you can reach us at 212-921-9350.


