CAP analyzed annual incentive plan payouts over the past ten years of 120 large U.S. public companies, with a median revenue of $43B. We selected these companies to span ten major industries and provide a broad representation of market practice. This study is a continuation of studies that we conducted in 2017 and 2020.
Annual incentive plans are an essential tool for companies to incent and reward executives for achieving short-term financial and strategic goals. The goal-setting process has always challenged management teams and committees to achieve a balance between rigor and attainability to motivate executives.
In recent years, economic volatility has placed even more pressure on committees to set appropriate goals. This research is intended to be a guide and a reference point to help evaluate whether goal-setting has led to the right outcomes.
Highlights
1 |
Based on our analysis of actual incentive payouts over the past ten years, the degree of difficulty, or “stretch”, embedded in annual performance goals translates to:
|
2 |
This pattern reinforces the importance of performance metric selection and performance goal setting, given that companies are spending annual incentive monies equal to at least the amount of their overall target pool 70 percent of the time. |
3 |
Annual incentive payout distributions in 2020-2021 are outliers, despite a significant portion of companies making adjustments to their bonus payouts in 2020-2021, given the impact of the pandemic on businesses. |
Summary of Findings
Plan Design
For the purposes of this study, we categorized annual incentive plans as either goal attainment or discretionary. Companies with goal attainment plans set threshold, target, and maximum performance goals and corresponding payout opportunities for the performance period. Companies with discretionary plans determine payouts at year-end based on a retrospective review of performance results with no predefined relationship between goals and payouts.
Our study focuses on the 89 percent of companies in the sample with goal attainment plans.
|
Industry |
Sample Size |
Annual Incentive Plan Type |
|
|
Goal Attainment |
Discretionary |
||
|
Automotive |
n= 11 |
100% |
0% |
|
Consumer Goods |
n= 14 |
100% |
0% |
|
Financial Services |
n= 15 |
40% |
60% |
|
Health Care |
n= 11 |
100% |
0% |
|
Insurance |
n= 12 |
83% |
17% |
|
Manufacturing |
n= 10 |
90% |
10% |
|
Oil and Gas |
n= 11 |
91% |
9% |
|
Pharmaceutical |
n= 12 |
100% |
0% |
|
Retail |
n= 11 |
100% |
0% |
|
Technology |
n= 12 |
100% |
0% |
|
Total |
89% |
11% |
|
Performance Metrics
Nearly three-quarters of the companies in our study use three or more metrics to determine bonus funding, an increase compared to the findings of our 2020 report.
The most prevalent financial metrics used in annual incentive plans were Revenue, EPS, and Operating Income (including EBIT, EBITDA, and Pre-tax Income).
57 percent of companies in our current study use strategic or nonfinancial goals, an increase from 38 percent in 2020. These metrics incentivize behaviors that contribute to long-term success but may not be captured by short-term financial performance results. Specific strategic or nonfinancial metrics vary by industry and company – for example, pharmaceutical companies often use pipeline metrics and oil and gas companies often use safety and environmental metrics.
60 percent of the companies include Environmental, Social, and Governance (ESG) goals as part of their annual incentive award determination. ESG metrics are typically evaluated on a qualitative basis, and less commonly on a quantitative basis.
Performance and Pay Scales
Compensation committees annually approve threshold, target, and maximum performance goals and corresponding payout opportunities for each metric in the incentive plan. Target performance goals are most often set in line with the company’s internal business plan. Executives most often earn 50 percent of their target bonus opportunity for achieving threshold performance and 200 percent for achieving maximum performance. Only two companies in the study provide an award opportunity over 200 percent of target for achieving maximum performance goals, a decrease compared to our 2020 report.
Annual Incentive Plan Payouts Relative to Goals
All Companies
Based on CAP’s analysis over the 10-year period, the degree of “stretch” embedded in annual performance goals translates to approximately:
- A 95 percent chance of achieving at least Threshold performance
- A 70 percent chance of achieving at least Target performance
- A 5 percent chance of achieving Maximum performance
This shows that participants are achieving threshold performance and earning some payout 95 percent of the time and receiving maximum payouts 5 percent of the time by achieving superior results. These findings reinforce the importance of performance goal settings, as companies are spending annual incentive monies equal to at least the amount of their overall target pool about 70% of the time.
In most of the years reviewed in our study, between 60 percent and 80 percent of companies paid bonuses at target or above. There were two exceptions: 2020, when only 55 percent of companies paid bonuses at target or above, and 2021, when 89 percent of companies paid bonuses at target or above. In 2020, bonuses were generally down due to the unanticipated impact of the COVID-19 pandemic on financial results, while in 2021 bonuses increased due to a faster than expected rebound for most companies. In 2022, we saw a return to more typical payout distributions with 65 percent of companies paying bonuses at target or above.
Impact of COVID-19 and Adjustments Made in 2020-2021
Given the unique economic environment, companies made more adjustments to annual incentive payouts in 2020 and 2021 than in prior years.
In 2020, 27 percent of companies made adjustments to annual incentive payouts. Approximately half of the companies adjusted bonus payouts upward to acknowledge that executives had limited control over the pandemic’s impact on financial results and to recognize efforts in navigating through the challenging environment. The other half of companies adjusted annual incentive payouts downward to realize the unplanned benefit that some companies realized as a result of the pandemic.
In 2021, 13 percent of companies made downward adjustments to annual incentive payouts to recognize that the results exceeded goals because of a quicker-than-expected financial rebound.
The trends seen in the 2020-2021 period reflect a dynamic response to the rapidly changing economic
landscape and emphasize the importance of adaptability for companies when navigating unprecedented times.
By Industry
Payout distributions differ by industry based on a variety of factors, including metric selection, goal setting, and economic influences. Average payouts for each industry are distributed as indicated in the following chart:
Pay Relative to Performance
CAP reviewed the relationship between annual incentive payouts and annual company performance over the ten-year period with respect to growth in the three most common annual incentive plan metrics: Revenue, EPS, and Operating Income. Payouts were fairly aligned with all three metrics over the 2013-2022 period, indicating that companies are rewarding for both growth and operating efficiency. Aligning bonus payouts with profitability also helps ensure that outcomes consider a company’s ability to pay bonuses.
The chart below depicts the relationship between median Revenue, EPS, and Operating Income Growth and the prevalence of above-target annual bonus payouts among the sample.
Conclusion
Our research indicates that over the last ten years companies set performance goals that translated to:
- A 95 percent chance of achieving at least Threshold performance
- A 70 percent chance of achieving at least Target performance
- A 5 percent chance of achieving Maximum performance
While payouts in select years may diverge slightly from others, given economic, industry, or company factors, this overall 10-year lookback provides a pattern and guidelines that companies can use to assess their actual payouts and established goals over the longer-term.
Looking Ahead
The macroeconomic environment remains uncertain, given factors such as the rising interest rate environment, continuing high inflation, a tight labor market, stock price volatility in certain sectors, and supply chain uncertainty.
Companies can use design strategies to help reduce volatility in their plan payouts, including setting wider ranges around target to recognize the challenges of setting performance goals in an uncertain environment, using non-financial goals to tie annual incentive payouts to other markers of company progress, and adding relative measures, which will allow for relevant comparisons even if the overall market is affected by macroeconomic challenges.
Methodology
The 120 companies in our study had a revenue size ranging from $20 billion at the 25th percentile to $88 billion at the 75th percentile. Median revenue was $43 billion.
CAP reviewed actual annual incentive payouts earned for performance over the ten-year period from 2013-2022 to determine the distribution of incentive payments and the frequency with which executives typically achieve target payouts. In this analysis, CAP categorized actual bonus payments (as a percentage of target) into one of six categories based on the following payout ranges:
|
Payout Category |
Payout Range |
|
Max |
5% below Max to Max |
|
Target – Max |
5% above Target to 5% below Max |
|
Target |
+/- 5% of Target |
|
Threshold – Target |
5% above Threshold to 5% below Target |
|
Threshold |
Up to 5% above Threshold |
|
No Payout |
0% |
Video available through American Banker, subscription required
2020 was a challenging year for banks. The impact of COVID on the economy as well as changes to accounting for loan loss provisions were evident in weaker financial and stock price performance in 2020 for many banks and yet CEO compensation increased. Learn from experienced executive compensation consultants about the challenges Compensation Committees faced in 2020, why pay levels increased relative to 2019, what were common COVID-related compensation changes, and what changes were made for the 2021 incentive plan design. Also, hear about if and how banks are linking executive compensation to diversity and inclusion metrics given the increased focus on ESG. The compensation consultants will share findings from their 2020 compensation study, lessons learned from 2020, and best practices for 2021 and beyond.
More than six months have passed since the COVID-19 pandemic began. In February, American businesses were hit hard by shutdowns, shifting demand, operational disruptions, and significant new challenges for employee health and safety. Many S&P Composite 1500 companies responded with changes to their compensation programs for executives and employees. Initial pay actions in March, April and May focused on conserving cash, mainly through salary cuts. Over the summer, companies adapted, and pay actions began to focus on annual and long-term incentive plans.
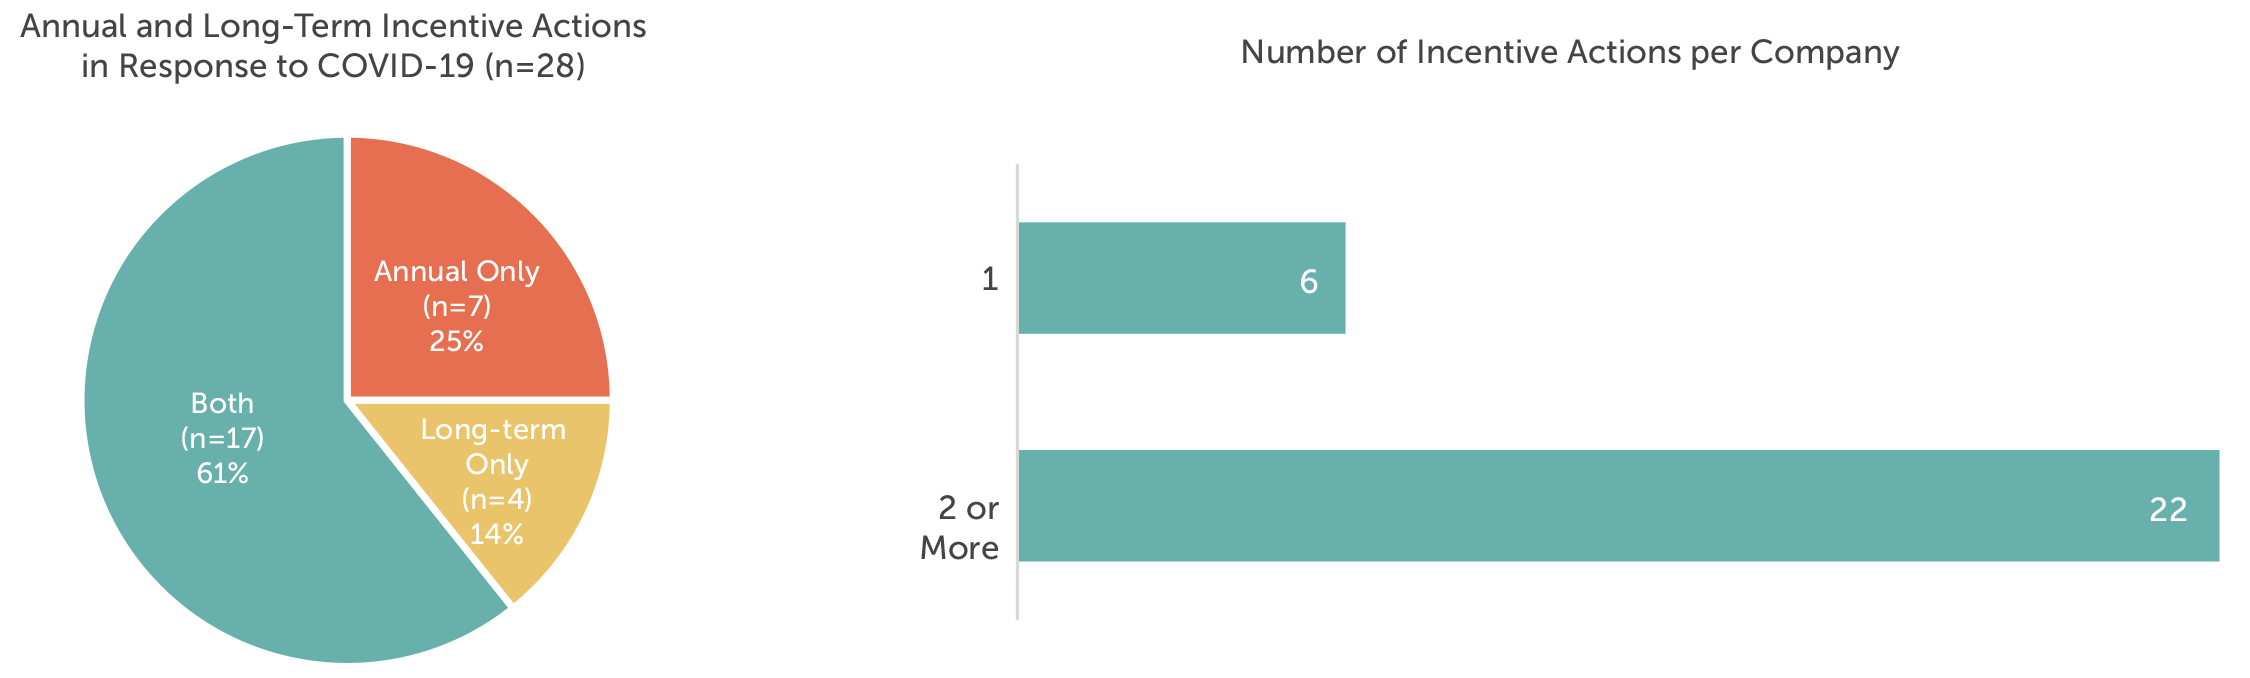
Public filings in September and October offered the first detailed look at how U.S. public companies adjusted their executive compensation plans in response to COVID-19. Public companies with fiscal year ends (FYEs) on or near June 30 recently filed their proxy statements, which included robust discussions of the impact of COVID-19 on 2020 executive compensation decisions and plans for 2021. Of the S&P Composite 1500 companies – which Compensation Advisory Partners (CAP) has been closely tracking – 65 companies with FYEs between May 30 and July 3 filed their annual proxy statements by October 7. Of the 65 companies, 28 – or 43 percent – announced changes to their outstanding and go-forward incentive plans because of COVID-19. Approximately 60 percent of the 28 companies had responded at the start of the pandemic with immediate human capital actions, including temporary reductions to executive base salaries, and adverse broad-based employee actions.
It is too early to say whether actions taken by the June FYE companies are indicative of trends we will see when most companies file their proxy statements in the spring of 2021. From an industry-sector standpoint, the June FYE companies show significant representation from Information Technology (28%), Industrials (15%), and Consumer Staples (15%). While not a completely representative sample, this group of companies still provides an interesting early look at executive compensation responses to COVID-19 beyond annual pay reductions.
The majority of the 28 companies that reported COVID-19-related pay actions adjusted both their annual and long-term incentive plans. About 85 percent of the companies made changes to their annual incentive plans, and 75 percent made changes to long-term incentives. Twenty-two of the companies took more than one incentive action.
Annual Incentives
Of the 28 companies, 24 made changes to their outstanding and/or go-forward annual incentive plans. The most common changes were modifying the performance period, exercising discretion to determine award amounts, revising the payout scale, delaying goal-setting and adding or changing performance metrics.

Prevalent annual incentive actions are discussed below.
Adjusted Performance Period
Several June FYE companies adjusted the performance period for an outstanding plan. For these companies, COVID-19 only impacted fourth-quarter results, so most of their 2020 fiscal years were business as usual. In go-forward plans, shorter performance periods are intended to focus executives and employees on immediate priorities, and to recognize that goal-setting will be difficult because of COVID-19.
|
Action |
# of Companies |
|
Outstanding Plan |
|
|
Shortened the performance period to exclude the pandemic. |
9 |
|
Go-Forward Plan |
|
|
Bifurcated annual performance periods. |
2 |
|
Set quarterly goals. |
2 |
Use of Discretion
Eight companies applied discretion to outstanding incentive awards. The disclosed rationale for the use of upward discretion was to recognize the extraordinary efforts of executives and employees who contributed to companies’ COVID-19 responses, and to recognize performance before COVID-19 hit.
|
Action |
# of Companies |
|
Outstanding Plan |
|
|
Applied discretion to increase annual incentive funding and awards. |
7 |
|
Used downward discretion to reflect the negative impact of COVID-19. |
1 |
Revised Payout Scale
Revisions to payout scales for outstanding awards were made primarily to prorate awards in conjunction with adjusted performance periods, as discussed in “Adjusted Performance Period.” Payout scales were revised in go-forward plans for a number of reasons: to widen the performance curve to reflect the difficulty with goal-setting, to reduce maximum payouts for cost containment, and to implement a payout floor and increase the award maximums to incentivize superior performance.
|
Action |
# of Companies |
|
Outstanding Plan |
|
|
Revised payout scales in conjunction with shortening performance periods to remove the impact of COVID-19. The payouts were prorated based on how much the performance periods were shortened. |
3 |
|
Go-Forward Plan |
|
|
Widened performance curves. |
1 |
|
Reduced maximum annual incentive award to be 150 percent of target, down from 200 percent of target. |
1 |
|
Added a payout floor, increased maximum payout, and adjusted corporate and business unit award multipliers. |
1 |
Delayed Goal-Setting
Six companies delayed goal-setting for go-forward plans. The rationale is to allow time for more information to predict financial performance.
|
Action |
# of Companies |
|
Go-Forward Plan |
|
|
Delayed goal-setting in conjunction with breaking performance periods into smaller units. |
3 |
|
Delayed goal-setting to have more accurate information for forecasting. |
3 |
Added/Changed Metrics
Several June FYE companies changed performance metrics for their annual incentive plans to move away from financial measures. The shift to operational measures illustrates that companies are opting to focus executives and employees on drivers of financial performance, which may provide clearer line of sight or may be easier to forecast in unpredictable times. Similarly, the shift to strategic and individual metrics may allow for more discretion in payout determination and recognizes the importance of non-financial goals at this time.
|
Action |
# of Companies |
|
Outstanding Plan |
|
|
Changed metrics for outstanding awards to focus on near-term priorities, and company health and well-being. |
1 |
|
Go-Forward Plan |
|
|
Adjusted annual performance metrics, including shifting to operational, strategic, and individual performance. |
4 |
Long-Term Incentives
Of the 28 companies, 21 made changes to their outstanding and/or go-forward long-term incentive plans. All but four of the companies that adjusted long-term incentives also adjusted annual incentive plans. The most common changes were modifying the performance period, revising the payout scale, changing the long-term incentive vehicle mix, changing metrics for performance awards, and delaying goal-setting.

Modified the Performance Period
As with annual incentive plans, modifying the performance period was the most prevalent long-term incentive plan change. CAP predicts goal-setting will remain as a key challenge for incentive plan design for 2021 and beyond. The COVID-19 pandemic hurt many companies and helped others (e.g., consumer staples), resulting in highly unusual results for 2020. To address future uncertainty during goal-setting, breaking performance periods into smaller periods may become more common until economic conditions stabilize.
|
Action |
# of Companies |
|
Outstanding Plan |
|
|
Modified the performance period for outstanding awards, including omitting the quarter negatively impacted by COVID-19. With that change, some companies also prorated the award amounts commensurately. |
7 |
|
Go-Forward Plan |
|
|
Divided the award period into shorter periods for purposes of goal-setting and award calculation. |
3 |
|
Shortened the three-year performance period to two years. |
1 |
|
Changed the goal-setting approach to include a cumulative goal. |
1 |
Revised the Payout Scale
Revisions to past payout opportunities and maximums were made to prorate awards in conjunction with shortened performance periods, or to cap the payout and conserve cash.
|
Action |
# of Companies |
|
Outstanding Plan |
|
|
Decreased the payout scale for outstanding awards in conjunction with omitting quarters negatively impacted by COVID-19. Prorated the awards commensurately (e.g., if performance were measured over 11 quarters instead of 12, the award would be prorated by 11/12). |
4 |
|
Revised award payouts to the maximum based on performance in quarters not negatively impacted by COVID-19. |
1 |
|
Capped the maximum payout at target. |
1 |
|
Go-Forward Plan |
|
|
Awarded grants at target regardless of performance. |
1 |
|
Increased maximum payout. |
1 |
Changed Long-Term Incentive Vehicles
Ten companies adjusted the long-term incentive mix for upcoming awards. The most common change was to add time-vested vehicles or to increase the percentage of time-vested vehicles overall to increase retention and recognize the difficulties of goal-setting during the pandemic.
|
Action |
# of Companies |
|
Go-Forward Plan |
|
|
Added time-vesting vehicles or increased the percentage of time-vested vehicles in the overall mix. |
6 |
|
Added stock options to the 2021 fiscal year grant. |
2 |
|
Eliminated stock options. |
2 |
|
Not granting equity. |
2 |
Note: Two companies took multiple actions.
Changed Performance Plan Metrics
Given the impact of COVID-19 on U.S. companies, changing performance measures to reflect new business realities has not been a surprising development. Five companies with June FYEs adjusted their long-term performance measures. CAP expects to see more changes in performance measures in go-forward performance plans as companies file proxy statements.
|
Action |
# of Companies |
|
Go-Forward Plan |
|
|
Adopted relative performance measures, which mitigate the risk of goals being missed because of market events beyond management’s control. |
2 |
|
Added strategic metrics to focus management on COVID-related priorities. |
2 |
|
Eliminated a more complicated return measure to focus on revenue and profitability. |
1 |
Delayed Goal-Setting
Five companies delayed goal-setting for future awards. Delaying annual grants or choosing to set targets in the second quarter could provide companies with flexibility to set more accurate and realistic performance goals.
|
Action |
# of Companies |
|
Go-Forward Plan |
|
|
Made annual grants but delaying goal-setting under the grants until there is more predictability surrounding COVID-19 and its impact. |
3 |
|
Delayed making annual grants. |
2 |
Special Awards
Four companies with June FYEs provided special awards to executives. FedEx and Nike made special awards to replace annual and long-term incentive awards that were not paid because of COVID-19. Tapestry and Herman Miller provided special grants to incentivize executive performance. CAP expects to see more special awards in the future.
|
Company |
Revenue ($M) |
Position |
Grant Date |
Award Value ($000s) |
Award Type* |
Vesting |
|
FedEx Corporation |
$71,490 |
CEO |
06/15/2020 |
$14,160 |
SOs |
Ratable 4-year |
|
COO |
$3,981 |
|||||
|
NIKE, Inc. |
$37,337 |
CEO |
06/01/2020 |
$6,750 |
Cash |
Immediate |
|
Other NEOs |
$2,533 (avg.) |
|||||
|
Tapestry, Inc. |
$4,961 |
All NEOs |
08/17/2020 |
$200 – $500 |
PSUs |
Cliff 2-year |
|
Herman Miller |
$2,487 |
Leadership, including NEOs |
07/14/2020 |
Not disclosed |
Premium SOs |
Ratable 3-year |
* SOs are stock options; PSUs are performance share units.
Looking Ahead
CAP expects companies to make increasingly more changes to their executive compensation programs to address the impact of COVID-19, market volatility and the challenges of credible long-term forecasting.
Annual Incentive Plans
- Use of informed or structured discretion to determine payouts.
- New or increased weighting on operational, strategic, and individual performance metrics. These may be incorporated as environmental, social and governance (ESG) metrics, which provide a more holistic view of business performance and consider different stakeholders.
- Use of wider performance scales around target goals, which may lead to less volatility in payouts.
- Delay of goal-setting to improve accuracy.
- Use of shorter performance periods to address goal-setting difficulties.
Long-Term Incentive Plans
- Increased use of time-based restricted stock/units for retention. CAP still expects at least 50% of long-term incentives to be performance-based, given the long-standing expectations of proxy advisors and major investors.
- Companies may exclude the chief executive officer or named executive officers from the shift to time-based equity.
- Use of relative performance measures (primarily total shareholder return), or an increase in the weight of relative measures.
- Delay of goal-setting to improve accuracy.
- Use of shorter periods for performance-based long-term incentives to lower the risk of the overall incentive program.
Bertha Masuda and Bonnie Schindler discussing the use of ESG metrics in private companies.
CAP partners Bertha Masuda and Susan Schroeder discuss essential components to building robust long term and short term incentive plans as well as what companies overlook when developing incentive plans for their employees
Stock price growth? Meeting the business plan? Beating external expectations? Long-term stability? Companies must consider success across multiple fronts, and boards of directors play a role in defining success by working with management to set the strategic plan and by overseeing how the company progresses toward the achievement of the plan.
Incentive plans are foundational to motivating the senior management team to achieve the goals of a company’s strategic plan. Determining how to best measure and reward performance against these goals is key to designing effective incentive compensation programs that ensure proper alignment of pay outcomes with various degrees of suc- cess against the plan.
To determine how board members measure performance and incorporate it in their company’s incentive compensation plans, Corporate Board Member and Compensation Advisory Partners partnered to survey more than 250 public company directors. In this report, we present our findings and share our perspective on these key issues.
Download the PDF to read the full report.
Short-term, cash incentives continue to dominate the incentive-pay landscape at nonprofit/government organizations according to salary and compensation survey research released in May 2018 by WorldatWork in partnership with Vivient Consulting.
“U.S. nonprofit organizations continue to make significant use of short-term cash incentives to motivate and reward employees. Long-term incentive (LTI) use is still a little-used compensation element, but prevalence increased modestly in 2017 and may signal an emerging trend,” said Bonnie Schindler, partner and co-founder of Vivient Consulting.
Additional Key Findings from the WorldatWork-Vivient Survey
Nonprofit/Government Compensation Survey Results:
- Nonprofit and government organizations favor simplicity by offering a limited number of STI plans. Of the respondents, more than 75% reported having three or fewer STI plans in place.
- By far, the most common type of STI plan at nonprofit and government organizations continues to be an annual incentive plan (AIP). However, prevalence of AIPs dropped to 77% in 2017 from 86% in 2015
The compensation survey Incentive Pay Practices: Nonprofit/Government was conducted in December 2017 among WorldatWork members. The salary and pay survey is the third edition for nonprofit/government entities with the last report data released in 2015.


