


DOWNLOAD A PDF OF THIS REPORT pdf(0.2MB)
Contact
Kelly MalafisFounding Partner [email protected] 212-921-9357 Shaun Bisman
Principal [email protected] 212-921-9365
Compensation Advisory Partners (CAP) examined 2020 CEO compensation levels and pay practices among 40 regional banks. The banks were analyzed using three groups based on FY’20 asset size: $1B – $5B in assets (“small banks”; n=13), $5B – $10B in assets (“medium banks”; n=13) and $10B – $20B in assets (“large banks”; n=14). This report discusses both the similarities and differences in compensation levels and incentive plan design, including COVID-related compensation changes between the three groups. We also highlight current issues facing the banking industry in 2021 and as we head into 2022.
Highlights
- 2020 Performance and Pay Outcomes: 2020 was a down year for banks resulting in annual incentive payouts at or below target for all three groups; CEO compensation was generally flat compared to 2019 levels
- COVID-Related Compensation Changes: Over 60% of the banks made changes due to COVID to recognize the unforeseen impact of the pandemic and overall performance within a challenging year; most prevalent change was exercising discretion to adjust the annual incentive payout. Larger banks were more likely to make changes to incentive plans due to COVID as the larger banks place more weight on metrics impacted by loan loss provisions and less on qualitative (subjective) factors
- Total Pay Mix: As banks increase in size, a higher percentage of CEO total pay shifts from fixed compensation to at-risk or variable compensation
- Annual Incentive Plan Metrics: For all banks, the most prevalent metrics generally include Asset Quality, Efficiency Ratio, Earnings Per Share (EPS), Return on Assets (ROA), Net Income, and Return on Equity (ROE), with smaller banks also factoring in Loan and Deposit levels more frequently
- Long-Term Incentive Plan Metrics: For all banks, relative Total Shareholder Return (TSR), ROE, EPS and ROA are frequently used together
- Looking Ahead: Future monetary policy will play a key role in banks' financial performance. Specifically, inflation and the interest rate environment will have an impact on banks' profitability. Additionally, Environmental, Social, and Governance (ESG) continues to gain attention and is a topic increasingly discussed at the Compensation Committee and Board level
2020 Performance and Pay Outcomes
Performance Results
Across all banks in the sample, financial and stock performance were weaker in 2020 compared to a strong performance year in 2019. Impacting performance in 2020 was the COVID-19 pandemic, specifically, government mandated shut-downs, high unemployment leading many financial companies to provide relief on mortgages and interest rates kept at zero. Additionally, the volatility from current expected credit losses (CECL) and the new loan loss provisioning standard materially impacted earnings. Earnings somewhat benefited from the Paycheck Protection Program. Excluding the impact of loan loss provisions, pre-provision net revenue growth was strong for all the banks. When comparing financial performance across all three groups, the small banks had the strongest performance year in 2020. Medium banks had the weakest performance year among the three groups, as earnings were down the most compared to the small and large bank groups. Negative 2020 TSR for all banks in our sample was consistent with the downward TSR trend seen in the overall market and across larger banks.
|
Metric |
Median Percent Change Year Ended December 31, 2020 |
||
|
Asset Size |
|||
|
$1B – $5B |
$5B – $10B |
$10B – $20B |
|
|
EPS |
-6.4% |
-22.3% |
-18.6% |
|
Net Income |
-8.0% |
-19.8% |
-17.2% |
|
Pre-tax Operating Income |
-4.7% |
-12.3% |
-9.7% |
|
Return on Equity |
-121 bps |
-275 bps |
-254 bps |
|
Pre-Provision Net Revenue |
+9.5% |
+7.9% |
+16.8% |
|
1-Year TSR at 12/31/20 |
-20.7% |
-19.8% |
-11.1% |
|
1-Year TSR at 12/31/19 |
27.4% |
28.1% |
22.4% |
bps – Basis points
Source: S&P Capital IQ Financial Database
CEO Annual Incentive Payouts
Small bank CEO annual incentive payouts as a percentage of target were the highest among the three groups, supported by stronger performance in 2020 based on the financials reviewed. Small banks paid annual incentives at 100 percent of target at median, and only five banks in the small bank group paid annual incentives below target, compared to seven banks in the medium bank group and eight banks in the large bank sample. Annual incentive payouts across all groups declined from 2019 levels, where all three groups generally paid out at or above target.

COVID-Related Compensation Changes
Over half of the banks in our sample made changes due to COVID to recognize the unforeseen impact of the pandemic and overall performance within a challenging year. As size increased, banks were more likely to make changes to compensation plans due to COVID, likely due to the larger banks placing more weight on metrics impacted by loan loss provisions and less weight on individual and strategic (qualitative) measures.
|
COVID-Related Compensation Changes |
|
|
Asset Size |
Percent of Companies |
|
$1B – $5B |
46% |
|
$5B – $10B |
69% |
|
$10B – $20B |
77% |
|
All Companies |
63% |
The most prevalent change was exercising discretion to adjust the annual incentive payout. Nearly all the companies that exercised discretion adjusted annual incentive payouts upward. Changes to outstanding long-term incentive plans were much less common.
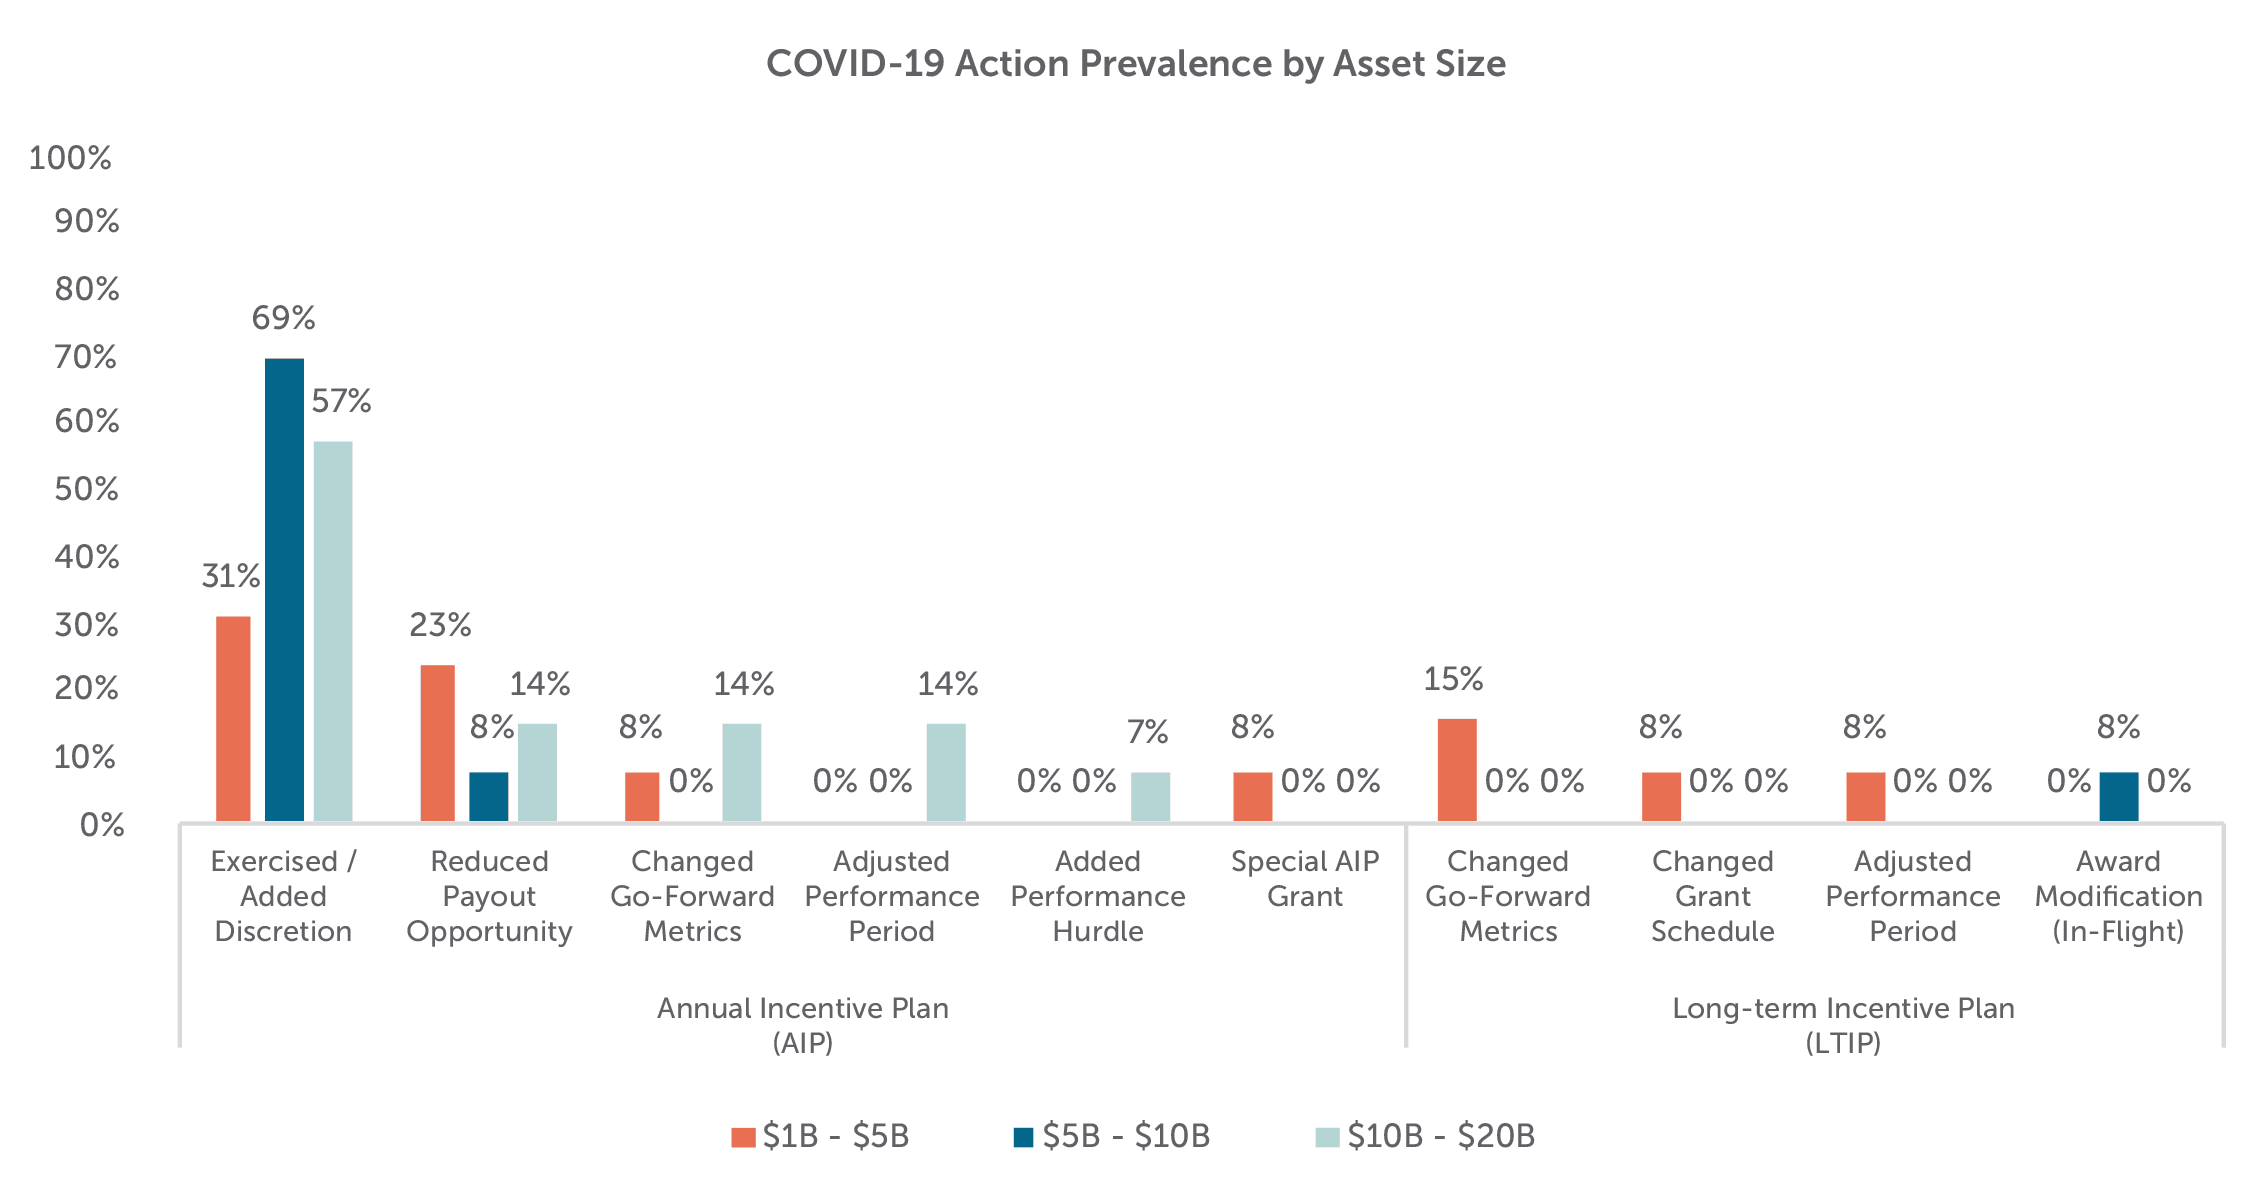
These findings are consistent with institutional shareholder and proxy advisory firm guidance around COVID-related adjustments (more openness to adjustments for annual incentives and more scrutiny on adjustments to long-term incentives) and CAP's COVID-19 research on a sample of the S&P 1500.
Total Pay Changes
Consistent with stronger relative financial performance and higher annual incentive payouts as a percent of target, small banks were the only group to see CEO actual total compensation1 (base salary, annual incentive payouts, and long-term incentives) increase in 2020. For the medium and large banks, CEO actual total compensation was flat year-over-year. The 3.8% increase among the small banks was driven by a combination of base salary increases (+3.7%) and annual incentive payouts (+6.0%). While annual incentives were paid at target for small banks (vs. 109% of target in 2019), 2020 bonus opportunity increases led to a year-over-year increase in value, as increased salaries led to increased target bonus values. Long-term incentive values were flat for the small and large banks and increased for the medium banks (+3.9%). LTI grant date values are driven less by company performance and generally determined by competitive market positioning.

Note: Excludes companies where there was a change in CEO
Chief Executive Officer (CEO) Pay Mix
Similar to our findings in prior-year studies, CEOs at the larger banks have higher pay levels and more of their total pay delivered in at-risk or variable compensation such as annual or long-term incentives. Conversely, CEOs at smaller banks are often paid more fixed compensation or base salary. For banks, asset size is a strong indicator of complexity as larger banks have more branches and a higher comprehensive list of financial accounts and services, corresponding to greater challenges and risks for management.
Pay Practices
Annual Incentive Plans
The most common annual incentive plan approach is a “goal attainment” plan where actual financial achievement is compared to pre-established goals made at the beginning of the fiscal year. The banks in our sample typically utilize several corporate metrics when determining their annual incentive payouts. Approximately 70 percent of the small, medium, and large banks use three or more weighted financial metrics. Asset Quality (i.e., non-performing assets, non-performing loan ratio), Efficiency Ratio, EPS, ROA and Net Income are the most prevalent metrics used at these banks. Returns (ROA or ROE), EPS and Net Income were typically weighted more (approximately 30-40 percent of the total plan) than Efficiency Ratio and Asset Quality metrics (approximately 15-20 percent of the total plan). The small banks differ from the medium and large banks in that they more frequently use Loan or Deposit measures in their plans, with these metrics accounting for no more than 20 percent of the total plan.

Small and medium banks also tend to use and assign higher weightings to individual performance. In all cases they represent 20-40 percent of the total plan as a standalone weighted metric. These individual measures are prevalent at 46 percent of the small and medium banks studied compared to 29 percent of the large banks; however, the large banks are more likely to incorporate strategic goals such as customer satisfaction, risk management, technology initiatives and community presence.
Long-term Incentive (LTI) Plans
The most typical long-term incentives used across industries, including the banking industry, include stock options, time-vested stock (restricted stock (RS) or restricted stock units (RSUs)) and performance-vested stock. Similar to the broader market, the banks in our sample use a portfolio approach in their long-term incentive plans, with approximately two-thirds granting two or three LTI vehicles. The small and medium banks more frequently use either a single LTI vehicle (36%) or have no long-term incentive plan (15%). The LTI mix seen between the three groupings is fairly consistent, with stock options continuing to be the least utilized LTI vehicle, averaging about 4 percent of the overall LTI mix. Time-vested RS typically makes up about 30 percent to 45 percent of the LTI mix among these banks, with performance plans comprising the bulk (about 50-65%) of LTIs in the total sample.

Performance plans are typically granted annually and have overlapping three-year performance periods. Payouts can fluctuate based on achievement of performance measures, and the upside is normally limited to 150 percent to 200 percent of the target level. Over three-quarters of companies in each asset grouping (that utilize performance plans) measure performance against two or more metrics. The most prevalent metrics used are relative TSR, Returns and EPS for all three groupings, and it is common that two of these measures are paired together to determine all, or the majority of, the payout. Asset Quality is a fairly prevalent metric among medium-sized banks (used by nearly a quarter of the companies).
TSR is almost exclusively measured on a relative basis, often against either the company-defined peer group or an industry index. In our sample of banks, relative TSR is more commonly installed as a weighted metric, and only 5 percent of all banks use it as a modifier of the calculated payout. Other common relative metrics include Returns and EPS growth. Among the total sample, 40 percent of banks use a relative measure other than TSR.

Looking Ahead
Federal Reserve Monetary Policy and Bank’s Loan Loss Provisions
As banks report third quarter 2021 financial performance, there continues to be uncertainty on the outlook of the economy and the financial performance of the banking industry. The following factors will have a lasting impact on 2021 and 2022 financial performance.
- Inflation and Impact on Interest Rates: As prices to continues to rise, the Federal Reserve may tighten monetary policy sooner than expected. Interests rates are near zero and with a rise in interest rates, banks' financials, profit margins and loan growth may be impacted depending on the monetary policy imposed by the Fed. Any increase in rates may deter borrowing and cut into demand for cars and houses, eventually slowing price increases and growth
- Government Aid Programs: Consumers and businesses were helped financially in 2020 from benefits and programs offered by the government; however, the additional income for consumers and businesses, as well as low interest rates, which were meant to bolster the economy, impacted banks' loan growth and overall profitability in 2021
- Loan Loss Provisions: Early in the pandemic, banks set aside billions of dollars to prepare for the recession, sending profits lower. Now that the economy has recovered more quickly than expected, banks have been releasing those reserves for several quarters, increasing their profits. It is not clear what “normal” financial performance is in the banking industry in the near term
- While stock price performance through September 30, 2021 has been strong for the banking sector (+23% for all banks), it is prudent for banks to be prepared for market uncertainty, and to understand how program changes can mitigate uncertainty and volatility.
ESG in Incentive Plans
ESG issues are hot-button topics among all companies, and more information is being disclosed in company filings and on their websites. Investors have increased their attention on company efforts on this topic, particularly Diversity, Equity & Inclusion (DE&I) and how progress in this area should be linked to executive pay. For banks, there is a growing focus on increasing diversity in the industry. The natural question is whether such initiatives should be including in compensation decision making. Only one bank in the sample (Trustmark Corporation) includes ESG, DE&I goals as part of a standalone weighted metric in the annual incentive plan. While not prevalent among our sample of 60 banks, Compensation Committees are discussing ESG objectives in the boardroom today. While larger banks tend to be the trendsetters, we expect smaller regional banks to follow suit, as there will be increased pressure from shareholders and the public.
Conclusion
Despite the impact COVID-19 had on bank financial performance in 2020, few companies in our sample adjusted their program designs in 2021. Compensation program practices have remained steady among our sample of banks. Adjustments for 2021 typically focus on the types of metrics used, goal setting for absolute and relative measures as well as building in some flexibility using wider performance ranges around target. For 2022, with the increased regulatory focus on ESG and continued investor attention on this topic, we expect banks to be clear on their ESG strategies and ultimately how they link to compensation. Bank directors and management teams will need to consider how to best align their pay programs with performance considering the external economic and regulatory environment.
For questions or more information, please contact:
Kelly Malafis Partner
[email protected]
212-921-9357
Shaun Bisman Principal
[email protected]
212-921-9365
Stefanie Kushner, Theo Allen and Fariha Haque provided research assistance for this report.
Regional Banks in CAP’s Study (n=40)
Small Banks ($1B – $5B in assets)
- Camden National Corporation
- Capital City Bank Group, Inc.
- Central Valley Community Bancorp
- CNB Financial Corporation
- Evans Bancorp, Inc.
- Farmers National Banc Corp.
- First Business Financial Services, Inc.
- First Financial Northwest, Inc.
- Heritage Commerce Corp
- Independent Bank Corporation
- National Bankshares, Inc.
- Sierra Bancorp
- Stock Yards Bancorp, Inc.
Medium Banks ($5B – $10B in assets)
- 1st Source Corporation
- Amerant Bancorp Inc.
- Banc of California, Inc.
- Brookline Bancorp, Inc.
- Enterprise Financial Services Corp
- First Commonwealth Financial Corporation
- First Foundation Inc.
- German American Bancorp, Inc.
- Lakeland Bancorp, Inc.
- Park National Corporation
- Seacoast Banking Corporation of Florida
- Univest Financial Corporation
- Westamerica Bancorporation
Large Banks ($10B – $20B in assets)
- Atlantic Union Bankshares Corporation
- Banner Corporation
- Berkshire Hills Bancorp, Inc.
- Cadence Bancorporation
- Community Bank System, Inc.
- First Busey Corporation
- First Merchants Corporation
- Glacier Bancorp, Inc.
- Great Western Bancorp, Inc.
- Heartland Financial USA, Inc.
- Pacific Premier Bancorp, Inc.
- Trustmark Corporation
- United Community Banks, Inc.
- WesBanco, Inc.
1 For 2020, includes 2020 base salary, 2021 annual incentive payout based on 2020 performance and 2021 long-term incentive grants. For 2019, includes 2019 base salary, 2020 annual incentive payout based on 2019 performance and 2020 long-term incentive grants.


