


DOWNLOAD A PDF OF THIS REPORT pdf(0.1MB)
Contact
Melissa BurekFounding Partner [email protected] 212-921-9354 Eric Hosken
Partner [email protected] 212-921-9363
Compensation Advisory Partners (CAP) examined 2016 pay levels and financial performance across two segments of the insurance industry including eighteen companies with median revenue of approximately $18B. The segments included Property & Casualty (P&C) and Life & Health (L/H) Insurance companies1. The study focused on performance trends and industry dynamics affecting pay practices within the industry.
2016 Performance: Strong Shareholder Returns With Mixed Financial Results
Mixed performance results marked 2016 for the insurance industry. While operating earnings for the industry declined by 5.6% at median, Total Shareholder Return (TSR) for the full year of 19% (at median) was more than 33% greater than the S&P 500 of 13%. The 2016 Presidential election positively influenced returns, as expectations for rising interest rates and the likelihood of a relaxed regulatory environment for the insurance industry under the new administration intrigued investors. In the 10 months prior to the election, our sample of insurance companies had returns on par with the S&P 500 (approximately 8% for both), however, in only 2 months after the election, the insurance industry had a median return of 9% compared to just 4% for the S&P 500.
P&C companies benefitted from expectations for a faster growing economy under the current Administration, though it remains unclear if the expected increase in product demand will actually offset industry-pricing challenges. Shareholders are optimistic at the prospect of increased interest rates and the impact they may have on the L/H business which relies heavily on spread-based products.
|
Median TSR |
|||
|
Pre-Election (1/1/16 – 11/8/16) |
Post-Election (11/9/16 – 12/31/16) |
2016 (1/1/16 – 12/31/16) |
|
| P&C (n=9) | 4% | 9% | 15% |
| Life and Health (n=9) | 12% | 9% | 30% |
| CAP Total Sample (n=18) | 8% | 9% | 19% |
| S&P 500 | 8% | 4% | 13% |
P&C Financial Performance
- Revenue growth for the P&C business rebounded this year by 2.5% vs. a decline of 1% in the prior year given an increase in demand
- Operating Income decreased by 13% at median. Overall, generally benign loss trends and an absence of significant catastrophic losses were offset by a soft pricing cycle and declining auto insurance policies in force due to higher auto frequency claims, which hampered profitability
- Correspondingly, Operating Income ROE decreased to 8% compared to 11% in 2015
L/H Financial Performance
- Revenue increased by 3%, coming off of last year’s decline of 1%, as the economy continued to strengthen (at a modest rate) and investment income results were impacted favorably as interest rates began to rise
- Operating Income increased 4% in conjunction with revenue growth, compared to a 2% decline in 2015
- Operating Income ROE was maintained at 12%
2016 CEO Pay For Performance: Bonuses Align With Performance
Property & Casualty: 2016 was an interesting year for the P&C industry as Operating Income and related operational results declined but total shareholder returns were above those of the S&P 500. Investors moved to insurance company stocks after the election, anticipating changes that would potentially lift the industry. However, CEO bonuses generally reflect 1-year operational results and decreased at all P&C companies in our study, with a 26% decline at median. CEO bonuses paid out at approximately 75% of target at median in 2016, compared to 125% of target for 2015.
Life & Health: The L/H industry fared better in 2016 compared to the P&C industry. Revenue, Operating Income and TSR all grew year-over-year, which correlated with CEO bonus increases of 8% at median.

Annual Incentive Plans
Annual incentive bonus payouts over the last 3 years have been volatile among P&C and L/H companies:
|
Median Annual Incentive Payouts as % of Target |
|||
|
2016 |
2015 |
2014 |
|
| P&C (n=9) | 74% | 126% | 128% |
| Life and Health (n=9) | 120% | 93% | 123% |
| CAP Total Sample (n=18) | 100% | 102% | 132% |
As the industry is impacted by external factors such as catastrophes, interest rates and foreign exchange rates, incentive plan goal setting can be challenging. Companies consider these industry dynamics when they are both designing annual incentive plans and determining payouts at the end of year.
28% of companies in our study maintain annual incentive plans that incorporate discretionary funding in some fashion. These companies consider a wide range of performance results — financial, strategic and/or individual — to determine incentive payouts. There is no specific formula to determine earned awards. This approach allows a company to not only consider the level of performance results each year, but to consider external or internal factors influencing such results and provide bonuses in line with controllable results, as determined to be appropriate.
Companies that utilize a “goal attainment” plan, in which the company compares actual results to pre-established performance goals to determine incentive funding, also have methods to address macroeconomic factors and industry volatility. Many companies build in adjustments to results for items such as catastrophes, foreign exchange rates or investment income results. A majority of the companies in our study make adjustments in at least one of these areas. Companies may do this by establishing a protective “collar” around a budgeted number (e.g., +/- 10% of budgeted CATs is the max included for incentive results) or excluding the results of an item completely (e.g., use of budgeted CATs vs. actual). Most companies also incorporate the ability to make individual performance considerations in determining final payouts. 75% of the companies with a goal attainment plan in our study allow for positive or negative modification to the award amount funded on financial results.
While companies will try to mitigate plan volatility, it is important to ensure alignment of executives with shareholders, and executive bonuses with performance. The alignment seen in 2016 executive bonuses and performance indicates that companies are striking a good balance between rewarding executives for results within their control and maintaining alignment with shareholders.
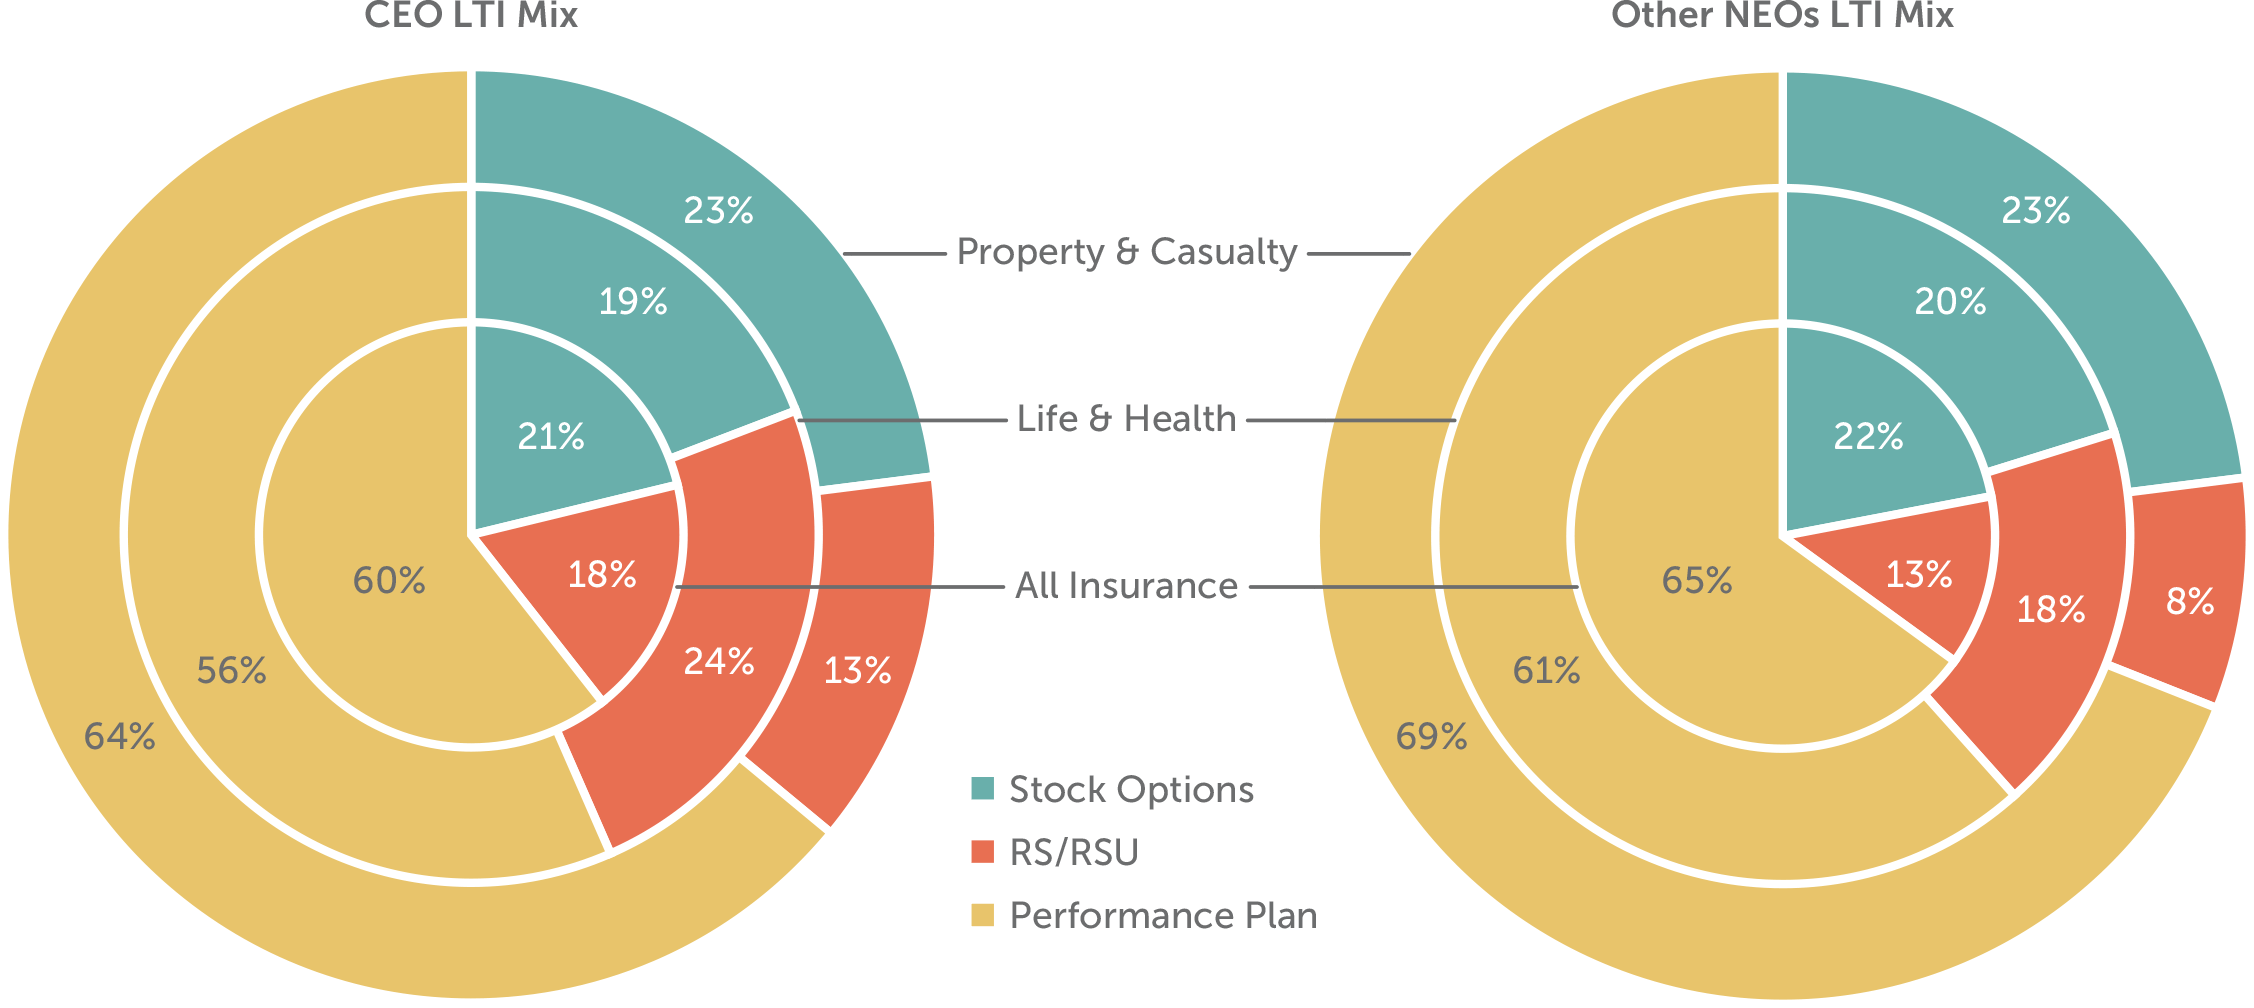
Long-term Incentive Plans
Insurance companies generally have been long-time users of performance-based LTI. All but one company weights performance plans at least 50% of the overall LTI program.
Despite strong use of performance-based LTI, setting longer-term performance goals can be challenging. All but one of the companies utilize a 3-year performance period in their long-term performance plan. In our study, the most commonly used metric is ROE (72% of companies), followed by relative TSR (50%), and the combination of ROE and TSR is used by 33% of companies. The use of a relative metric (TSR) in conjunction with a financial metric helps provide balance and can offset issues associated with setting three year goals in a volatile industry.
Incorporating a relative metric in a long-term performance plan did benefit companies in terms of 2016 payouts yet companies need to balance other considerations when designing their program. Ideally, companies will use metrics that are correlated with shareholder returns. Though as 2016 showed, outside factors can affect stock price and may or may not reflect underlying operational performance. Over a longer time, relative performance and TSR may prove to be a helpful design feature.
Conclusion
The insurance industry will continue to evolve over the next few years. Expectations of a faster-growing economy, a relaxed regulatory climate, uncertainty around healthcare, and higher interest rates will impact the industry.
The external landscape that insurance companies are competing in is evolving as well. For example, P&C companies will have to deal with the reality that driverless cars will continue to gain traction in the future and with it, companies will have to adopt relevant auto policies. L/H companies will benefit from new money investments if the Fed raises interest rates and the economy continues to improve. Uncertainty surrounding the DOL Fiduciary Rule has already influenced L/H companies as some have announced they will sell their broker-dealer networks.
The industry will certainly go through change in the upcoming years and insurance companies have to adapt to the environment accordingly. While these influences put pressure on maintaining responsible and competitive pay programs, the industry has already demonstrated they are able to provide compensation that is directionally aligned with performance and company objectives.
For questions or more information, please contact:
Melissa Burek Partner [email protected] 212-921-9354
Eric Hosken Partner [email protected] 212-921-9363
Alex Stahl Associate [email protected] 646-486-9741
Joanna Czyzewski Associate [email protected] 646-486-9746
Kyle Clemenza provided research assistance for this report.
CAP’s Insurance Industry Sample
P&C Companies
American International Group, Inc.
The Allstate Corporation
The Travelers Companies, Inc.
Chubb Limited
Progressive Corp.
Hartford Financial Services Group
Assurant, Inc.
CNA Financial Corporation
XL Group plc
Life & Health Companies
MetLife, Inc.
Prudential Financial, Inc.
Manulife Financial Corporation
Aflac Incorporated
Unum Group
Genworth Financial, Inc.
Lincoln National Corporation
Principal Financial Group Inc.
Torchmark Corporation
1 See Exhibit 1 for list of companies included.


