

Several years ago, pay levels for Chief Financial Officers (CFOs) were increasing at a faster rate than other C-suite executives, including the Chief Executive Officer (CEO). This more dramatic increase was partially explained by the evolving role of the CFO. While always an integral member of senior management, the role of the CFO has become an increasingly important position at major companies with extra demands given the volatility in the economic environment, investor expectations and scrutiny. Additionally, CFOs were intimately involved in dealing with the impact of the financial crisis, resulting in a greater oversight role and interaction with the Board of Directors.
To determine if this trend is continuing, Compensation Advisory Partners conducted a study to determine how CFO pay has changed over the last three years and how the year-over-year trends in compensation compare to trends in CEO pay. The study analyzes executive pay data disclosed by early proxy filers and includes 55 US public companies with revenues ranging from $1 billion to $150 billion, with median revenues of $10 billion. Only companies with the same incumbent CEO and CFO from 2008 to 2010 were included in order to focus on year-over-year changes for an individual. Financial services firms were excluded from the study as this industry, in particular, saw the emergence of several atypical compensation arrangements and special awards that were both temporary and unique to the financial services industry.
Our findings, summarized below, indicate that CFO pay is generally moving at the same rate as CEO pay. Salaries are increasing at a slightly faster rate for CFOs but incentive compensation, both annual and long-term, is moving at the same rate for CFOs and CEOs, illustrating that incentive levels are tied to company results. For 2010, incentives are up for both CFOs and CEOs, reflective of a slowly rebounding economy.
Study Results
Salaries
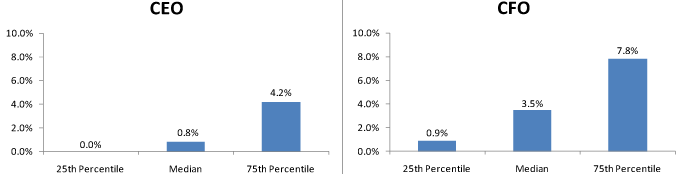
In 2010, 78% of CFOs received salary increases at a rate of 3.5% at median and 7.8% at the 75th percentile. In comparison, only 55% of CEOs received salary increases at lower levels (0.8% at median and 4.2% at the 75th percentile). The prevalence of no salary increases also rose among CEOs from 40% in the 2008-2009 period to 46% in the 2009-2010 period while for CFOs, the prevalence of no salary increases decreased to 22% in the 2009-2010 period versus 31% in the 2008-2009 period.
Salary Increase Prevalence
| 2008-2009 | 2009-2010 | |||
| No Increase | Increase | No Increase | Increase | |
| CEO | 40.0% | 60.0% | 45.5% | 54.5% |
| CFO | 30.9% | 69.1% | 21.8% | 78.2% |
2010 Salary Increases
Actual Pay Levels
Overall, actual total direct compensation (salary plus actual annual incentive plus the present value of long-term incentives) for both CFOs and CEOs slightly declined in 2009 and subsequently rebounded in 2010, as illustrated by the chart below. CFO pay fell at a slightly higher rate in 2009 and increased at a higher rate in 2010 compared to CEO pay. The rise in 2010 pay levels was primarily due to increases in incentive (performance-based) compensation. Bonuses increased by approximately 16% and LTI increased by 14% – 19%. These increases in incentive compensation are most likely reflective of the recovering economy, improvements in company financial performance and rebounding stock prices.
Median Percentage Change in Pay Components
| 2008-2009 | 2009-2010 | |||
| CEO | CFO | CEO | CFO | |
| Salary | 0.7% | 2.0% | 0.8% | 3.5% |
| Actual Bonus | -3.1% | 3.5% | 16.3% | 15.6% |
| Long-Term Incentives | -2.4% | -5.7% | 13.7% | 18.6% |
| Actual Total Direct Comp. | -4.7% | -5.2% | 18.3% | 23.3% |
Financial Performance (Median Levels)
| Year | Total Shareholder Return (as of 12/31) | 1-Year Revenue Growth | 1-Year Revenue Growth |
| 2008 | -32% | 8% | 2% |
| 2009 | 26% | -8% | -6% |
| 2010 | 21% | 9% | 19% |
While movement in pay among CFOs and CEOs was directionally similar, on average, CFO actual total direct compensation was generally 30 – 35% of CEO actual total direct compensation over the last three years.
Target Pay Mix
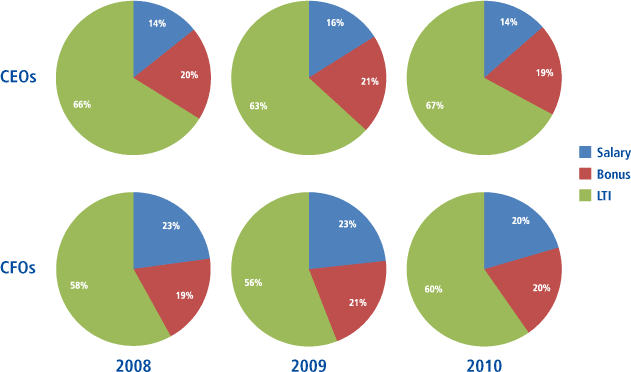
When considering compensation at target levels, the pay mix remained largely unchanged from 2008 to 2010, with a greater emphasis on at-risk pay for CEOs than for CFOs. The pay mix for CFOs slightly shifted towards incentive-based compensation (from 77% in 2008 to 80% in 2010) showing that the pay mix for CFOs is moving closer to that of CEOs.
Long-Term Incentive (LTI) Vehicle Prevalence
The majority of companies awarded LTI to both CEOs and CFOs using at least two vehicles. The prevalence of stock options in the LTI mix declined over the 3-year period while the prevalence of performance-based awards increased. Overall, 83% of CFOs and 85% of CEOs received some form of performance-based awards as part of their LTI program in 2010.
Number of LTI Vehicles Used in 2010
| % in Total | ||
| CEO | CFO | |
| 1 | 13% | 15% |
| 2 | 61% | 54% |
| 3 | 26% | 31% |
| Average | 2 | 2 |
Long-term Incentive Mix
The majority of LTI continues to be delivered in the form of stock options and performance-based LTI, with less emphasis on restricted stock.
LTI Mix
| 2008 | 2009 | 2010 | ||||
| CEO | CFO | CEO | CFO | CEO | CFO | |
| Stock Options | 44% | 41% | 39% | 39% | 34% | 31% |
| Time Vested Restricted Stock | 16% | 22% | 17% | 20% | 17% | 20% |
| Perf. Based LTI | 40% | 37% | 43% | 41% | 49% | 48% |
Conclusion
In the last two years, trends in CFO pay have been directionally aligned with trends in CEO pay. The target pay mix for CFOs has slightly increased the emphasis on incentive compensation relative to fixed compensation, moving closer to the pay mix of CEOs. Salaries are increasing at a faster rate for CFOs but incentive compensation is increasing at about the same pace for both CFOs and CEOs, indicating a link to company performance results, and emphasizing that the role of the CFO continues to be important. We expect companies to continue to ensure that they have the right skill set in the CFO role and develop compensation programs that attract and motivate key talent.
Please contact us at (212) 921-9350 if you have any questions about the issues discussed above or would like to discuss your own executive compensation issues. You can access our website at www.capartners.com for more information on executive compensation.


