

Compensation Advisory Partners (CAP) reviewed executive compensation pay levels and trends at 50 companies (Early Filers) that filed their most recent proxy statement between November 2016 and January 2017 (fiscal year ends from July 2016 to October 2016; 35 companies have September 30 fiscal year ends). Industry sectors reviewed include: Consumer Discretionary, Consumer Staples, Financials, Health Care, Industrials, Information Technology and Materials. Among these 50 companies, median Revenue was $6.1B, median Market Capitalization (based on each company’s fiscal year-end) was $9.0B and 1-year Total Shareholder Return, or TSR (based on each company’s fiscal year-end) was 18.4%.
Overall Findings
- Performance: 2016 performance (based on Revenue growth, Pre-tax Income growth, EPS growth and 1-year TSR) was generally flat year over year.
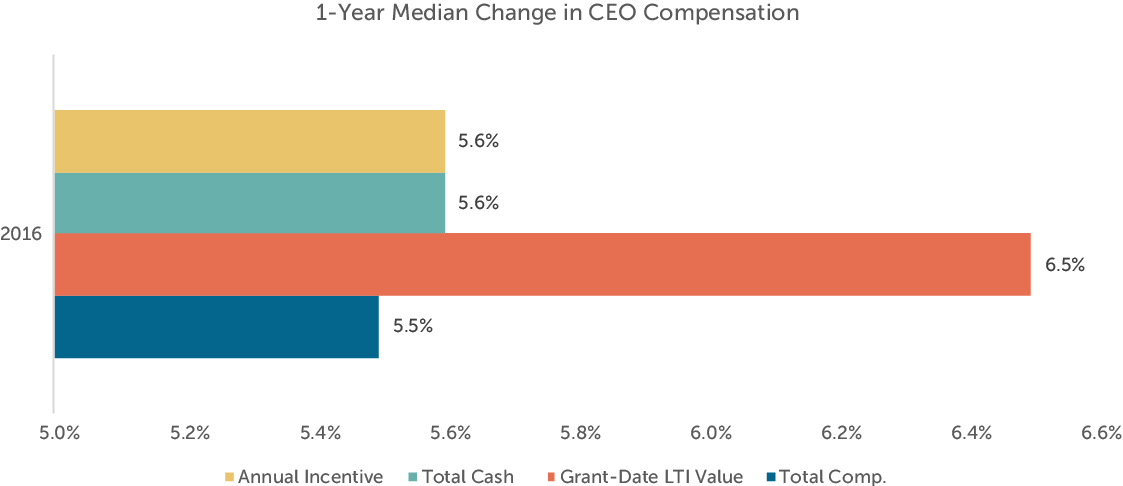
- CEO Pay: Median CEO pay was up 5.5% from 2015 due to increases in annual incentive payout and the grant date value of long-term incentives (LTI).
- Annual Incentive Payout: Overall, median 2016 annual incentive payout was 104% of target which was consistent with 2015 results.
- Annual Incentive Plan Design: Profit-based growth, Revenue growth and Cash Flow growth are the most common measures used in the annual incentive plan. Companies typically use 2 – 4 metrics to ensure executives are focused on overall company performance.
- Long-Term Incentive Design: Performance-based awards are the most prevalent LTI vehicle although stock options and time-based restricted stock are also commonly used but to a lesser extent. Most companies use relative TSR as an LTI metric although we expect its use to plateau as proxy advisory firms like ISS begin to use financial performance in their pay-for-performance assessment.
2016 Performance
2016 was a year marked with global political uncertainty partly due to the Brexit vote in June, the U.S. presidential election in November and the continued unrest in the Middle East. Despite these challenges, 2016 financial performance was generally flat (+/- 3%) for the second year in a row. However, 2016 TSR performance was much stronger than 2015 performance despite market uncertainty. CAP reviewed Revenue growth, Pre-tax Income growth, EPS growth and TSR performance for the Early Filers and the S&P 500.
| Financial Metric (1) | 2015 Median 1-year Performance | 2016 Median 1-year Performance | ||
| S&P 500 | Early Filers | S&P 500 | Early Filers | |
| Revenue Growth | 2.3% | 2.2% | 2.1% | 2.2% |
| Pre-Tax Income Growth | 1.8% | 1.5% | 2.2% | -2.8% |
| EPS Growth | 5.0% | 3.1% | 4.2% | 2.4% |
| TSR | 3.4% | 0.4% | 14.9% | 18.4% |
(1) TSR and Financial performance for the S&P 500 is as of September 30, 2015 and September 30, 2016. Financial performance and TSR for Early Filers is as of each company’s fiscal year end.
CEO Total Direct Compensation
CEO actual total direct compensation increased modestly (5.5%) among Early Filers with CEOs in their role for at least two years (n=42) driven by increases in annual incentive payouts and the grant-date value of LTI awards. Annual incentive payouts, at median, were nearly 6% higher over prior year. Although year over year financial performance was relatively flat, companies typically adjust incentive plan metrics to exclude factors that may be outside an executive’s control (e.g., currency fluctuation) which can result in higher incentive plan achievement compared to GAAP performance. Median base salaries for CEOs in our sample were unchanged from prior year.
Annual Incentive Plan Payout
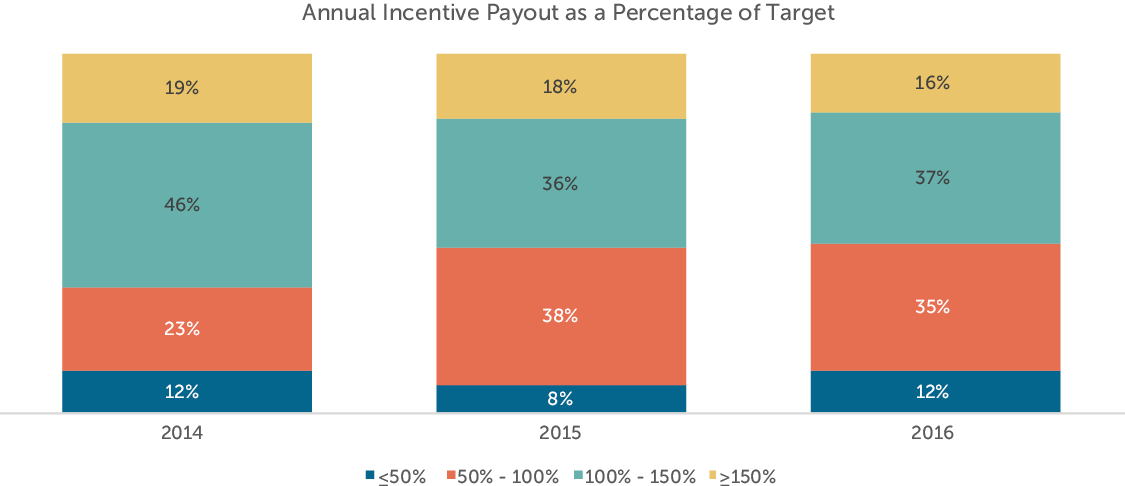
Actual annual incentive payouts in 2016 were around target, reflective of the relatively flat 2016 financial performance. Payout in 2016 was 104% of target at median which is similar to median payout in 2015 (102% of target). Median annual incentive payouts for 2016 and 2015 were lower than 2014 (110% of target); however, 2014 was a year of strong financial performance which resulted in above target annual incentive payouts.
| Summary Statistics | Annual Incentive Payout as a % of Target | ||
| 2014 | 2015 | 2016 | |
| 75th Percentile | 125% | 133% | 137% |
| Median | 110% | 102% | 104% |
| 25th Percentile | 92% | 82% | 82% |
As would be expected, performance for companies with at or above target annual incentive payouts was stronger than that of companies with below target payout. Most noticeably, however, is that median Profit growth for companies with at or above target annual incentive payouts was significantly stronger than similar growth for companies with below target payouts; median Revenue growth was only modestly stronger for companies with at or above target payout. Median 1-year TSR performance for both groups was very strong in 2016. These results are directionally similar to 2015 performance with the exception of TSR which, for both above and below target payouts, was stronger in 2016 than 2015.
| Financial Metric (1) | 2015 Median 1-year Performance | 2016 Median 1-year Performance (2) | ||
| Below target payout (n=23) | At/above target payout (n=27) | Below target payout (n=23) | At/above target payout (n=26) | |
| Revenue Growth | -3.6% | 7.5% | -0.7% | 3.5% |
| Pre-Tax Income Growth | -4.1% | 8.8% | -13.2% | 20.5% |
| EPS Growth | -2.6% | 12.2% | -8.7% | 16.3% |
| TSR | -13.4% | 14.8% | 16.9% | 20.0% |
(1) Financial performance and TSR is as of each company’s fiscal year end.
(2) Excludes 1 company that eliminated its annual incentive program beginning in 2016.
Approximately 55% of companies provided a payout at or above target in 2016 which is consistent with 2015. Additionally, the distribution of payouts in 2016 is similar to that of the prior year which is consistent with generally flat year over year performance.
Incentive Plan Design
Annual Incentive Plan Design
Across all companies reviewed, Profit growth (typically EPS or Operating Income), Revenue growth, and Cash Flow growth were the most commonly used metrics in the annual incentive plan design. Typically, companies place more emphasis on profits with most allocating at least 50% of the total award on profit-based metrics.
Most companies use 2 – 4 metrics in the annual incentive plan design which allows companies to balance an executive’s focus on the many aspects that define its success. This approach also provides some risk mitigation so that executives are not concentrating on a single metric potentially at the expense of other meaningful financial measures. A minority of companies (8) in our sample use only 1 metric in the annual incentive plan, with most of these companies using a profit-based metric.
Long-Term Incentive Plan Design
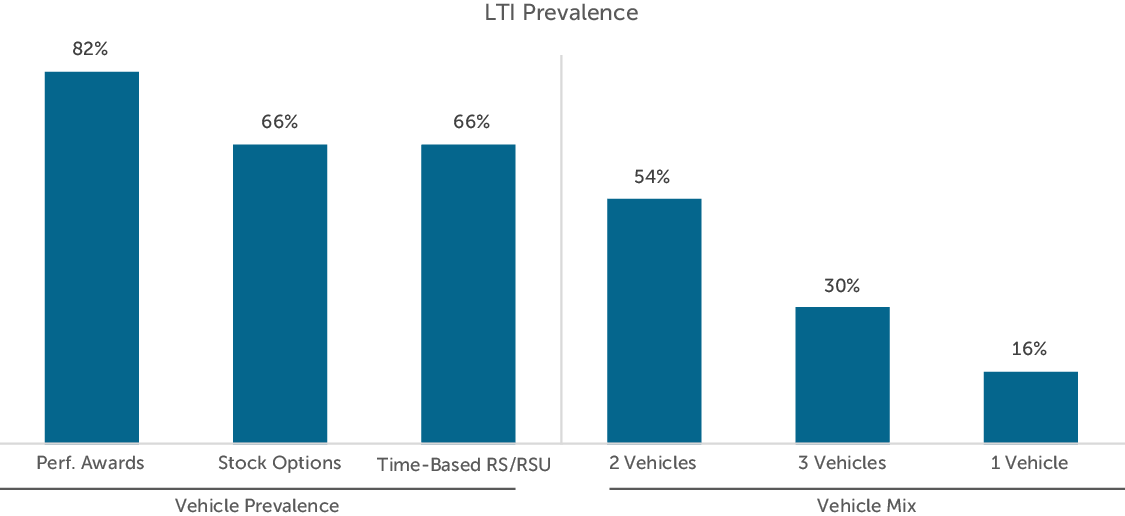
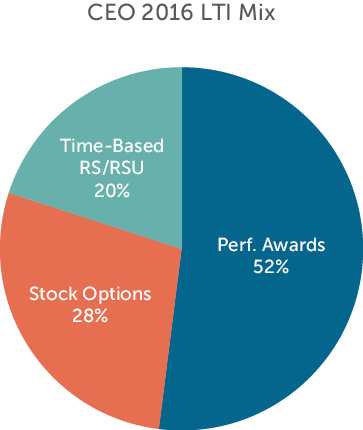
Among early filers, performance-based awards are the most prevalent long-term incentive vehicle provided to executives as companies continue to ensure executive pay is aligned with longer term company and stock price performance. However, companies in our sample do continue to provide stock options and time-based restricted stock awards, although these vehicles reflect a smaller portion of total LTI (28% for stock options and 20% for time-based restricted stock). Most companies reviewed deliver equity in the form of 2 – 3 vehicles which helps to balance the link with longer term performance.
For companies that grant performance-based awards, the most common metrics are TSR, profit-based growth and return measures (e.g., ROE, ROA and ROIC). 67% of companies use TSR, 57% use a profit-based metric (with EPS used most often) and 31% use a return measure. Similar to annual incentive metrics, companies use multiple metrics (typically 2 – 3 metrics) in performance-based awards. Among the 12 companies that use only 1 metric, 50% use company financial performance (typically a profit-based metric) while 50% rely solely on relative TSR. However, TSR is most commonly used with other metrics or as an award modifier. Over the last several years, more companies have been incorporating relative TSR as a long-term measure to address multiple issues including: setting credible long-term goals, using measures that can be understood by participants and aligning with proxy advisory firms’ pay-for-performance assessments. We would expect that the use of TSR will plateau particularly as firms, like ISS, begin to use financial performance measures in their pay-for-performance assessments.
Conclusion
2016 performance, overall, was generally flat year over year which resulted in annual incentive payouts that were around target for the second year in a row and modest pay increases, through incentives, for the CEO. 2017 will likely be a year of uncertainty as political outcomes from 2016 (e.g., Brexit and the U.S. presidential election) may impact international trade deals, U.S. federal regulations and consumer confidence which could impact economic performance. We would expect many companies to take a wait and see approach before making wholesale changes to their annual or long-term incentive plan design.
Lauren Peek is a Principal at Compensation Advisory Partners. Joanna Czyzewski is an Associate at Compensation Advisory Partners.


