

Overall Findings
- Performance: 2015 performance (based on Revenue growth, Pre-tax Income growth, EPS growth and 1-year Total Shareholder Return or TSR) was weaker than 2014 performance.
- CEO Pay: Median CEO pay was up 13% from 2014, driven by significant increases in the grant date value of long-term incentives (LTI) which are typically granted during the beginning of the fiscal year.
- Annual Incentive Payout: At median, annual incentive payouts (as a percentage of target) were lower in 2015 than the prior year. Additionally, there was more variability in payout around target compared to 2014 demonstrating a directional alignment between pay and performance.
- LTI Payout: Performance share plans paid out at target for the 2013-2015 performance period despite strong median 3-year cumulative TSR performance of 56%.
- Disclosure: Companies generally did not make wholesale changes to their proxy statements. Some enhanced their disclosure through the use of charts and graphs to make the proxy statement a communications document for shareholders.
2015 PERFORMANCE
2015 was a year that included an increase in the value of the U.S. dollar, volatility in foreign currency exchange rates and a slowdown in economic growth overseas (particularly in China). These factors contributed to 2015 performance being weaker than 2014 performance. CAP reviewed Revenue growth, Pre-tax Income growth, EPS growth and TSR performance for the Early Filers and the S&P 500. For the measures reviewed, 2015 performance was generally flat (0 – 3% growth) compared to the strong performance of 2014.
|
Financial Metric |
2014 Median 1-year Performance |
2015 Median 1-year Performance |
||
|
S&P 500 |
Early Filers |
S&P 500 |
Early Filers |
|
|
Revenue Growth |
5.6% |
5.7% |
0.8% |
2.4% |
|
Pre-Tax Income Growth |
8.6% |
6.4% |
0.2% |
1.2% |
|
EPS Growth |
10.6% |
10.4% |
2.6% |
3.2% |
|
TSR (1) |
16.3% |
14.1% |
2.3% |
0.3% |
(1) TSR for the S&P 500 is as of September 30, 2014 and September 30, 2015. TSR for Early Filers is as of each company’s fiscal year end.
CEO TOTAL DIRECT COMPENSATION
Among Early Filers with CEOs in their role for at least two years (n=42), 2015 actual total direct compensation increased 13% over 2014 pay levels. 2015 annual incentive payouts were down 3% reflecting weaker financial performance compared to the prior year. LTI grants in 2015, however, were significantly higher than 2014. This finding is likely reflective of the timing of LTI grants (typically in the first quarter of the fiscal year) and companies likely providing larger grants in 2015 because of the strong performance in 2014. Consistent with the expected salary increases, 2015 base salary was 3% higher than 2014.
|
Compensation Element (n=42) |
2014 Median ($000) |
2015 Median ($000) |
% Increase |
|
Base Salary |
$1,000 |
$1,031 |
3.1% |
|
Actual Annual Incentive |
$1,791 |
$1,731 |
-3.4% |
|
Total Cash |
$2,836 |
$2,663 |
-6.1% |
|
Long-Term Incentive (LTI) |
$5,468 |
$6,896 |
26.1% |
|
Total Direct Compensation |
$8,290 |
$9,399 |
13.4% |
INCENTIVE COMPENSATION
Annual Incentive Plan Payout
As mentioned above, actual annual incentive payouts in 2015 were lower than 2014. At median, 2015 payouts were 101% of target vs. 2014 payouts which were 111% of target. At the 25th percentile, 2015 payouts were much lower (76%) than 2014 (99%) but were more in line with 2013 and 2012 payouts which is indicative of a return to more normalized distribution of payouts in 2015.
|
Summary Statistics |
Annual Incentive Payout as a % of Target |
|||
|
2012 |
2013 |
2014 |
2015 |
|
|
75th Percentile |
130% |
127% |
135% |
133% |
|
Median |
100% |
95% |
111% |
101% |
|
25th Percentile |
72% |
75% |
99% |
76% |
As expected, performance was noticeably stronger for companies with an annual incentive payout that was at or above target. Conversely, performance for companies with a payout below target was weaker in 2015. These results are similar to 2014 performance, although TSR was stronger for companies with below target payout in 2014 (+7%) compared to 2015 (-11%).
|
Financial Metric |
2014 Median 1-year Performance |
2015 Median 1-year Performance (1) |
||
|
Below target payout (n=15) |
At or above target payout (n=35) |
Below target payout (n=24) |
At or above target payout (n=24) |
|
|
Revenue Growth |
3.6% |
6.3% |
-4.0% |
7.0% |
|
Pre-Tax Income Growth |
-2.9% |
12.7% |
-7.2% |
11.7% |
|
EPS Growth |
-3.4% |
13.5% |
-2.9% |
13.9% |
|
TSR (2) |
7.2% |
16.0% |
-10.7% |
12.6% |
(1) Excludes 2 companies that had spin-offs during 2015.
(2) TSR for Early Filers is as of each company’s fiscal year end.
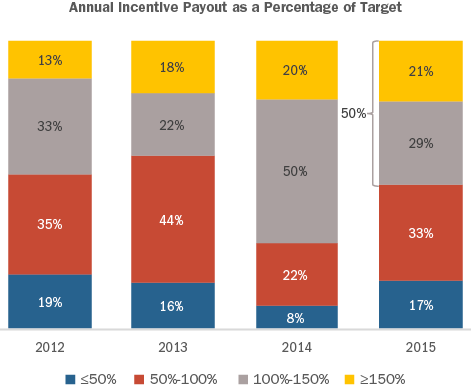
Overall, 50% of companies provided a payout at or above target in 2015 (consistent with 2013 and 2012) which is much lower than 2014 (70% of companies); as a result, there was more variability in payouts relative to target in 2015 than in 2014. Additionally, the number of companies providing a payout between 100 – 150% of target in 2015 is approximately half of what it was in 2014. Interestingly, nearly the same number of companies provided a payout of 150% and above in both 2014 and 2015. Finally, the number of companies not providing an annual incentive payout in 2015 increased (4 companies in 2015 vs. 1 company in 2014).
Long-Term Incentive Plan Payout
Three-year (2013 – 2015) performance was strong among Early Filers and the S&P 500. Cumulative Revenue growth was 11% (or 4% per year) for both Early Filers and the S&P 500. Cumulative EPS growth was very strong (21%) for the S&P 500 and more modest (11%) for the Early Filers. Overall, companies in both groups had significant stock price appreciation over the three-year period; 3-year cumulative TSR was 48% for the S&P 500 and 56% for the Early Filers.
|
Financial Metric |
Median 3-year Cumulative Performance |
|
|
S&P 500 |
All Early Filers (1) (n=42) |
|
|
Revenue Growth |
10.9% |
11.0% |
|
Pre-Tax Income Growth |
15.6% |
12.1% |
|
EPS Growth |
21.3% |
10.9% |
|
TSR (2) |
48.0% |
55.7% |
(1) Reflects only those companies with a performance share plan.
(2) TSR for the S&P 500 is as of September 30, 2015. TSR for Early Filers is as of each company’s fiscal year end.
Despite strong TSR performance over the three-year period, and even with 60% of companies using Relative TSR as a performance metric, median LTI payout was around target (98%). Median LTI payout for companies that use Relative TSR was slightly below target (95%); however, a majority of these companies (60%) use TSR in conjunction with other financial metrics.
|
Summary Statistics |
LTI Payout as a % of Target |
|
|
All Early Filers (n=42) |
Early Filers with TSR as a Metric (n=26) |
|
|
75th Percentile |
128% |
119% |
|
Median |
98% |
95% |
|
25th Percentile |
54% |
54% |
PROXY STATEMENT DISCLOSURE CHANGES
Since Say on Pay was adopted in 2011, companies have incorporated many new features to make their proxy statement a communications document for shareholders by including a proxy summary, an executive summary in the CD&A and highlighting good governance practices, just to name a few. While Early Filers generally did not make wholesale changes to their proxy statement in 2016, some companies enhanced their disclosure with additional charts and graphs. Some examples include:
- Deere & Co, which has annual incentive performance goals that can vary depending upon the company’s sales volume, added a graph to explain the performance goals, actual results and how each related to the actual sales volume achieved;
- Jabil Circuit, Jacobs Engineering Group and TE Connectivity added a list of corporate governance best practices (i.e., “what we do and what we do not do”);
- Starbucks added a picture describing their shareholder outreach process and topics discussed with shareholders.
We would expect that companies will have more significant changes to the proxy statement as more rules under Dodd-Frank (e.g., pay ratio and pay vs. performance) are finalized and implemented.
CONCLUSION
2015 was not as strong of a performance year as 2014. Given weaker 2015 performance, annual incentive payouts declined from 2014 levels resulting in a directional alignment between pay and performance. 2016 is already shaping up to be an interesting year given recent declines in stock price, currency fluctuations and overall uncertainty given the U.S. Presidential election. Many companies will be making their annual equity grants at depressed stock prices, so we may potentially see a year over year decline in LTI grant values particularly for those companies that grant awards based on a fixed number of shares. From an executive compensation perspective, we expect that the SEC will come out with final rules for the clawback, hedging and pay vs. performance in October 2016 which could have an impact on 2017 and 2018 disclosure.


