

Each year CAP analyzes non-employee director compensation programs among the 100 largest companies. We believe these companies provide insight into where the market will be going in terms of practices. This report is a summary of trends – for pay levels and pay practices – based on 2017 proxy filings.
CAP Findings
Board Compensation pay levels increased modestly
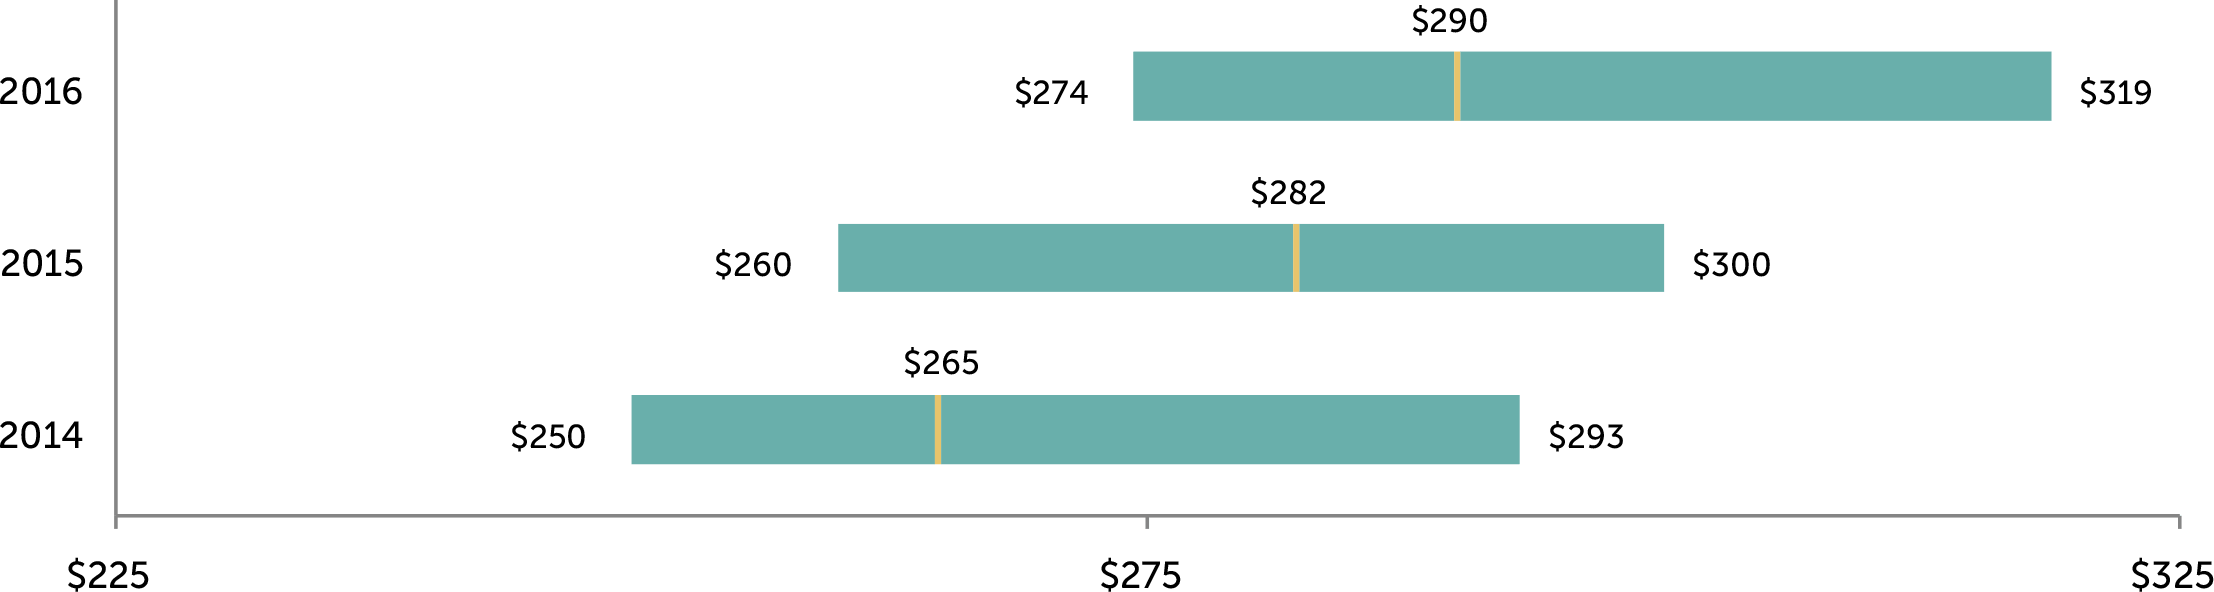
- Total Fees. Increased 3 percent (median is $290K, versus $282K in prior year); board compensation has reached a steady state, and low single digit increases have been and are expected to continue to be the norm.
- Retainers. Large companies rely on annual retainers (cash and equity) to compensate directors. Pay programs are typically simple and tend to rely less on meeting fees or committee member retainers.
- Meeting Fees. Paid by only 11 percent of companies, consistent with prior year. In general, companies have moved to a fixed retainer pay structure, with a component in cash and a component in equity. We support this approach as it simplifies administration and eliminates the need to define “what counts as a meeting.” However, companies may want to consider having a mechanism for paying meeting fees if the number of meetings in a single year far exceeds the norm (“hybrid approach”). Five companies in our dataset used this approach to meeting fees, with the threshold ranging between 6 and 10 meetings.
- Equity. Full-value awards (shares/units) are most common; only 7 percent of companies used stock options. 97 percent of companies denominated equity awards as a fixed value, versus a fixed number of shares, which is considered best practice as it manages the value awarded each year. Approximately two-thirds of equity awards vest within 1 year of grant (either immediately or cliff vest after 1 year).
- Pay Mix. On average, 61 percent equity-based and 39 percent cash-based, consistent with prior year. Alignment with long-term shareholders is reinforced by delivering a majority of board compensation in equity.
Committee Member Compensation little/no change
- Overall Prevalence. Half of companies paid committee-specific member fees for Audit Committee service and approximately one-third of companies paid member fees for Compensation or Nominating/Governance Committee service. The majority of companies rely on board-level compensation to recognize committee service, with the general expectation that all independent directors contribute to committee service needs1.
- Total Fees. Of the companies that paid committee member compensation, the median was $17.8K.
Committee Chair Compensation higher Audit Chair premium
- Overall Prevalence. More than 90 percent of companies provided additional compensation to committee Chairs, typically through an additional retainer and not meeting fees, to recognize additional time requirements, responsibilities, and reputational risk.
- Fees. Median additional compensation for Audit Committee Chairs increased to $25K from $20K last year. Median additional compensation for Compensation and Nominating/Governance Committee Chairs was $20K and $15K, respectively, consistent with prior year.
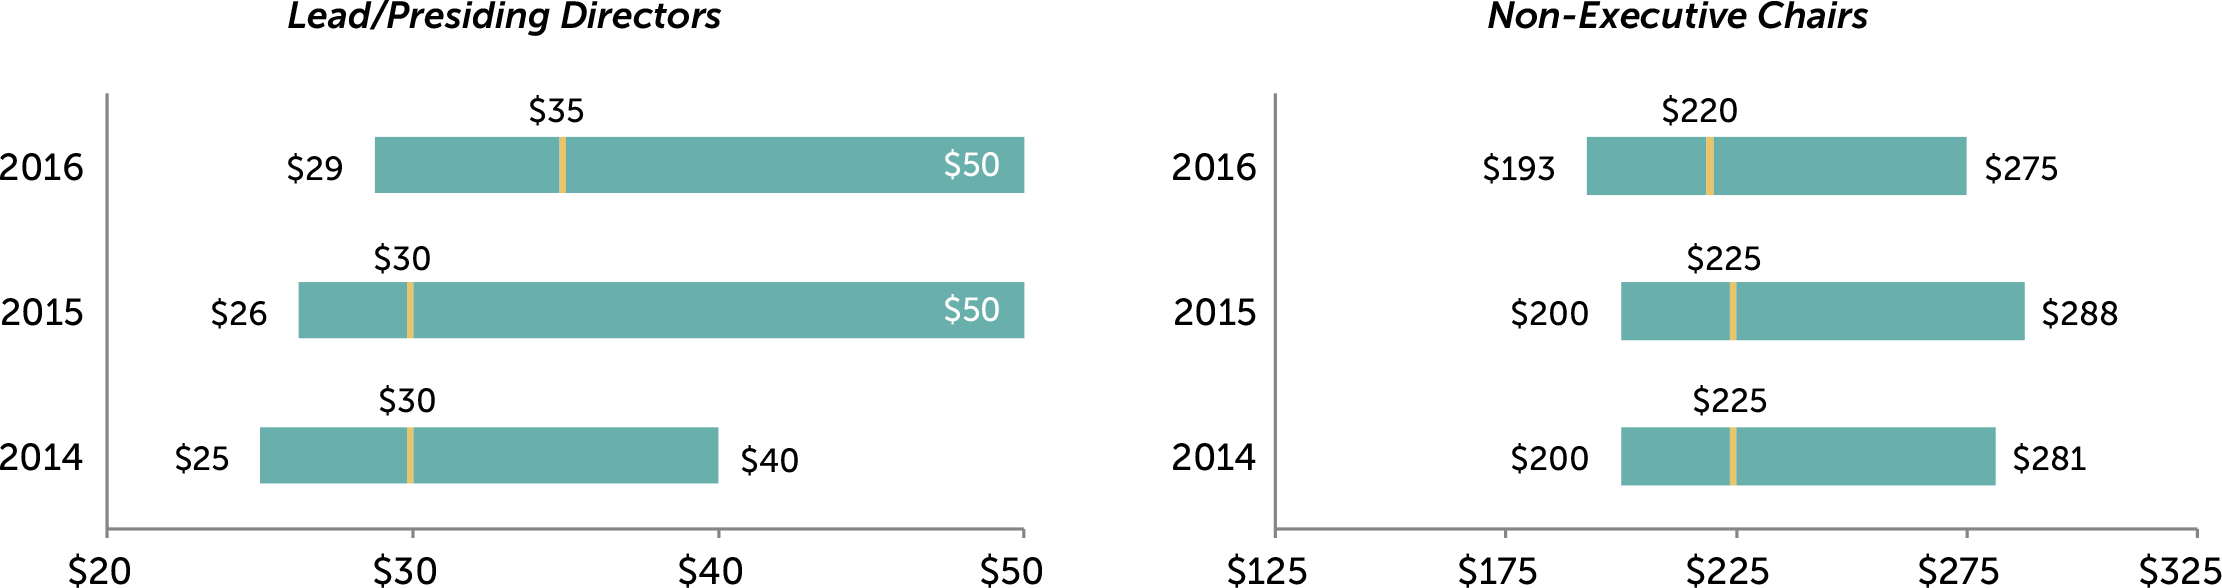
Independent Board Leader Compensation higher Lead Director premiums
- Non-Exec Chair. Additional compensation is provided by all companies with this role, $220K at median. As a multiple of total Board Compensation, total Board Chair pay is 1.83x a standard Board member, at median.
- Lead Director. Median additional compensation increased to $35K, up from $30K in the prior year. Additional compensation is provided by nearly all companies with this role2. The differential in pay versus non-executive Chairs is in line with typical differences in responsibilities.
Pay Limits prevalence of limits continues to go up
- Similar to last year, a majority of companies (55%) that amended or adopted an equity plan in 2017 – that did not already have a limit in place – implemented an award limit for director compensation.
- In total, 47 percent of the largest 100 companies now have such limits, up from 39 percent in the prior year.
- Limits range from $250K to $4.7 million, with the median limit being at $750K. Companies that denominate the limit in shares tend to have a higher dollar-equivalent limit, with a median of $1M. The median for the companies with value-based limits is $600K.
Limit Range Prevalence <= $500,000 28% $500,001 – $1,000,000 55% $1,000,001 – $2,000,000 13% > $2,000,001 4% - The limits tend to be much higher than annual equity grants. Approximately 72% of limits are greater than 3x the annual equity grants.
Limit Multiple Range Prevalence <= 3x annual equity 28% 3.01x – 5x annual equity 36% 5.01x – 7x annual equity 25% > 5x annual equity 11% - Limits typically apply to just equity-based compensation; however, some companies have applied the limits to both cash and equity-based compensation (i.e., total pay) and we anticipate the prevalence of this practice will increase further. Other companies exclude initial at-election equity awards, committee Chair pay, and/or additional pay for Board leadership roles from the limit.
- The limits are largely due to advancement of litigation where the issue has been that directors approve their own annual compensation and are therefore deemed to be inherently conflicted.
Appendix

Total Board Compensation ($000s)3
Additional Compensation for Independent Board Leaders ($000s)
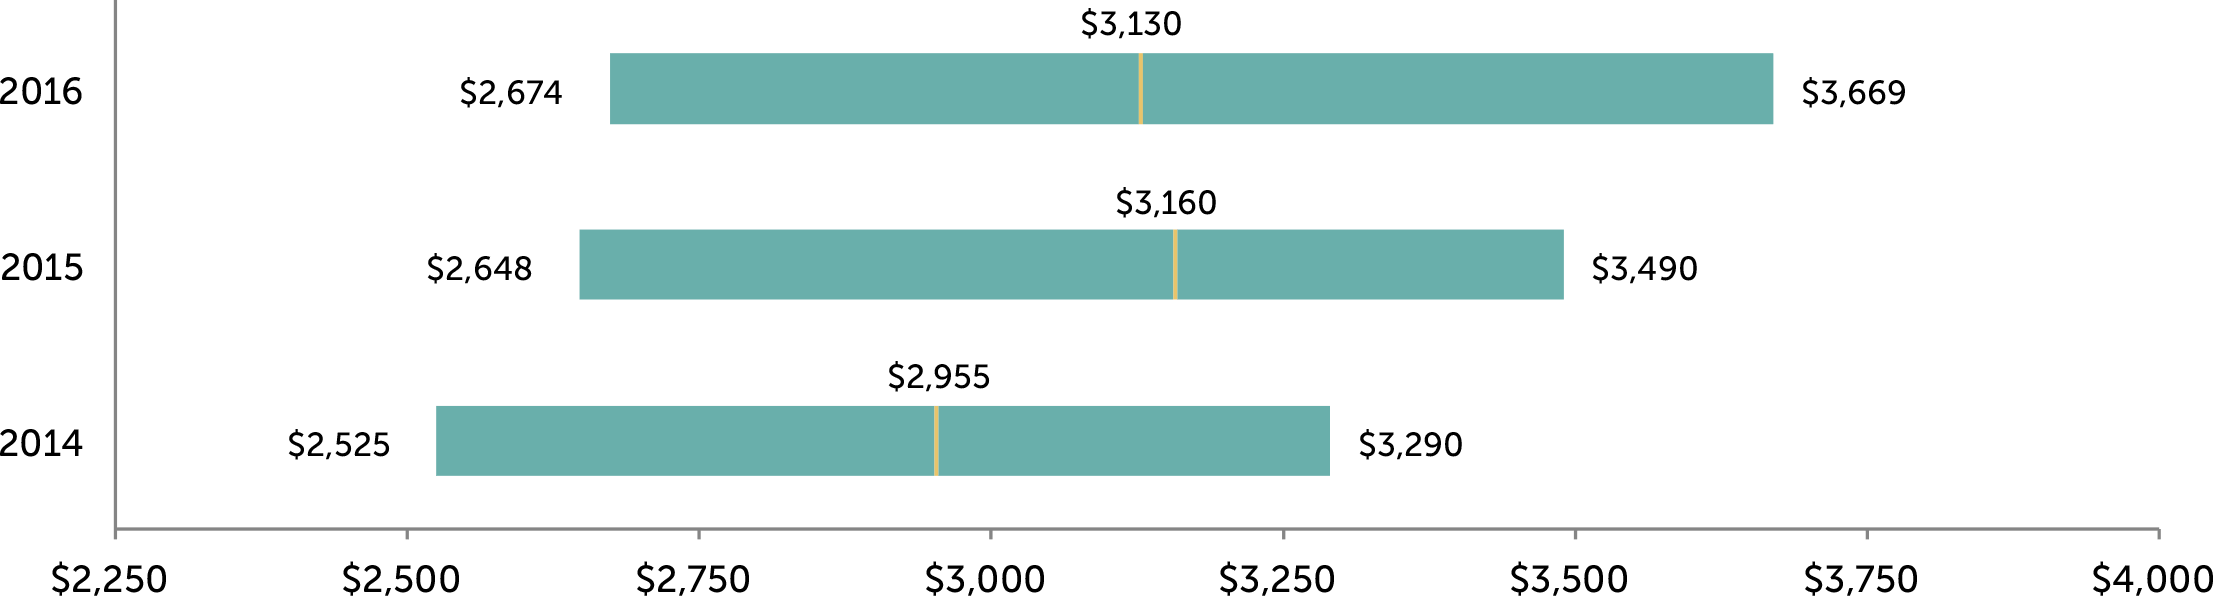
Total Company Cost for Board Service ($000s)
1 Audit, Compensation and/or Nominating and Governance committees.
2 Excludes controlled companies. Also excludes instances where Lead Director role is assumed by Chair of Nominating and Governance Committee, who receives compensation for the role.
3 Total Board Compensation reflects all cash and equity compensation for Board and committee service, excluding compensation for leadership roles such as committee Chair, Lead/Presiding Director, or non-executive Board Chair.


