

Compensation Advisory Partners (“CAP”) reviewed 2015 proxy disclosures at a sample of 100 companies among the Fortune 500 representing nine industry groups. Industry groups included: Automotive, Consumer Goods, Financial Services, Health Care, Insurance, Manufacturing, Pharmaceutical, Retail, and Technology. For the companies studied, the median revenue size and market capitalization was $34B and $56B, respectively. The median 2014 total shareholder return (TSR // change in stock price plus dividends) was 15%.
HIGHLIGHTS
- Most large public companies have maintained consistent approaches to delivering annual incentives to their executive leadership teams.
- We frequently see minor adjustments to annual incentive plan designs — most often modifying performance measures – rather than wholesale change.
- Most companies use multiple measures to ensure the annual incentive plan provides balance and aligns with overall business strategy.
- Median CEO annual target bonuses increased 10 percentage points to 170% of salary in 2014.
- In contrast, CFO annual target bonuses remained the same at 100% of salary.
- Overall, 2014 annual incentive payouts were slightly lower than in 2013.
CHANGES IN ANNUAL INCENTIVE PLAN DESIGN
32% of companies in CAP’s database changed their annual incentive plan design in 2014 or 2015. The most common changes were modifications to the performance metrics used to fund awards and increases to the target award opportunities offered to the CEO or CFO. Another common change was to adjust the weightings/mix applicable to performance metrics. These changes, as well as other modifications shown in the chart below, illustrate that companies continue to review and enhance the pay-for-performance relationship through changes to the annual incentive program.
|
Type of Change Reported in CD&A |
2014 No. of Cos. |
% of Cos. Reporting Changes |
||
|
2014 (n = 32) |
2013 (n = 34) |
2012 (n = 37) |
||
|
Change in performance metrics used to fund awards |
16 |
50% |
47% |
43% |
|
Increased/Reduced target award opportunities (CEO and/or CFO) |
12 |
38% |
32% |
11% |
|
Change in performance metric weighting/mix |
5 |
16% |
32% |
35% |
|
Change in maximum award payout |
4 |
13% |
9% |
8% |
|
Other changes |
3 |
9% |
12% |
22% |
Note: Due to multiple changes, does not add up to 100%.
Modifications to Performance Metrics
Among the companies that changed the performance metrics used for annual incentives, the most common approaches were to either maintain the same number of metrics or reduce the number of metrics. This avoids adding complexity to annual incentive while allowing for better alignment of pay with performance:
- Six (6) companies kept the total number of metrics the same, but replaced a metric;
- Six (6) companies reduced the number of metrics; and
- Four (4) companies added metrics to the current plan.
Changes made by many companies were done so to better align incentives with their business strategy:
- Bristol-Myers Squibb: Added a new pipeline metric as a measure to highlight the importance of pipeline delivery to the near-term and long-term success of the company.
- Intel: Moved from a single set of company-wide operational goals to business-unit-specific operational goals – significantly reducing the number of performance goals, in order to drive a sharper focus on key strategic initiatives, increase visibility into those initiatives, and enhance accountability.
- Verizon Communications: Consistent with Verizon’s strategic plan, adjusted the weightings of the financial measures from 2013 to place a greater emphasis on free cash flow, given the importance of cash generation and debt reduction following the acquisition of sole ownership of Verizon Wireless. In addition, a sustainability measure was introduced, reflecting Verizon’s commitment to reducing the environmental impact of its operations.
Increases in Target Bonus Opportunity
CAP’s database tracks the size of target annual bonus awards for both CEOs and CFOs. When we looked across all industries in 2014, we found that the median target bonus opportunity increased for CEOs by 10 percentage points to 170% of salary. By industry, the largest increase we saw was in Automotive, where CEO target bonus awards increased by 15 percentage points. Significantly, none of our industry groups registered a decline in CEO target annual bonuses, although Financial Services do not typically define target bonuses.
When we looked across all industries at CFO target bonus opportunities, we saw no change year-over-year. The median target bonus for CFOs remained the same at 100% of salary. By industry, Technology CFOs saw the greatest increase (25 percentage points). Across other industries, median target CEO/CFO bonus increases were generally between 0 and 10 percentage points. Similar to the CEO data, no industry group saw a decline in CFO annual bonus targets.
|
Industry |
Median Target Bonus as a % of Salary |
|||
|
CEO |
CFO |
|||
|
2014 |
2013 |
2014 |
2013 |
|
|
Automotive |
150% |
135% |
95% |
85% |
|
Consumer Goods |
165% |
160% |
100% |
93% |
|
Financial Services |
n/m |
n/m |
n/m |
n/m |
|
Health Care |
150% |
150% |
100% |
100% |
|
Insurance |
210% |
200% |
125% |
120% |
|
Manufacturing |
153% |
147% |
90% |
88% |
|
Pharmaceutical |
150% |
150% |
100% |
98% |
|
Retail |
200% |
200% |
125% |
125% |
|
Technology |
220% |
210% |
150% |
125% |
|
Total Sample |
170% |
160% |
100% |
100% |
Note: Companies among all industries that did not disclose target bonus opportunities were excluded from both the 2013 and 2014 target bonus analysis. Financial Services industry is excluded since most companies in our study do not disclose target bonus opportunities for the Named Executive Officers.
ANNUAL INCENTIVE PLAN DESIGN PRACTICES
Award Leverage
CAP reviewed proxy disclosure to understand how companies are establishing the payout range (i.e., the threshold payout and the maximum payout expressed as a percentage of the target payout) for annual incentives. Most companies that we reviewed identify the minimum payout as zero and do not separately disclose a threshold level of performance. For the 37 companies that did disclose a threshold bonus payout, a payout of 50% of target is the most common percentage. Twenty companies, however, disclose a minimum bonus payout of less than 50% of target which scales down to 25% or lower.
Approximately 75% of companies disclose the maximum bonus opportunity. A majority of companies in our sample (60%) have a maximum bonus opportunity of 200% of target bonus. Ten (10) companies have a maximum bonus of 250% of target or higher. Most of these companies are in the Consumer Goods, Pharmaceutical, and Technology industries.
|
Threshold Payout as a % of Target (n = 37) |
||
|
Range |
# of Cos. |
% of Cos. |
|
< 25% |
10 |
27% |
|
> 25% < 50% |
10 |
27% |
|
50% |
13 |
35% |
|
> 75% < 100% |
4 |
11% |
|
Maximum Payout as a % of Target (n = 73) |
||
|
Range |
# of Cos. |
% of Cos. |
|
> 125% < 150% |
2 |
3% |
|
> 150% < 200% |
14 |
19% |
|
200% |
44 |
60% |
|
> 200% < 250% |
3 |
4% |
|
> 250% |
10 |
14% |
Annual Incentive Plan Metrics
EPS, Revenue, Cash Flow and Operating Income are the most common metrics used in annual incentive plans. Similar to last year, our findings suggest that EPS is used more broadly across industries while Revenue tends to be used in consumer-driven industries.
Most companies use multiple performance metrics in the annual incentive plan. 33% of companies disclose using two (2) metrics, 31% use three (3) metrics, and 16% use four (4) or more metrics.
The use of multiple performance metrics allows for annual incentive payouts to be tied more closely to overall company performance. For example, companies using bottom-line measures in the annual incentive plan will often also include top-line measures for balance. Among CAP’s sample, 36% of “multiple-metric” companies that use a measure of profit (EPS, Operating Income, etc.) also use Revenue.
In addition to financial measures, approximately 15% of companies disclose using non-financial measures in their annual incentive plans such as talent, culture, and diversity initiatives. 55% of companies disclose that individual performance considerations impact annual incentive payouts.
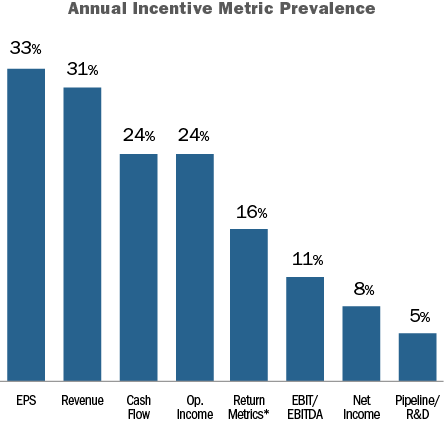
*Return metrics include: ROE, ROA, and ROI/ROIC.
The chart below shows the three (3) most common metrics by industry in 2014:
|
Industry |
Metric #1 |
Metric #2 |
Metric #3 |
|
Automotive |
Cash Flow (45%) |
EBIT (45%) |
ROA (27%) |
|
Consumer Goods |
Revenue (67%) |
EPS (58%) |
Cash Flow (33%) |
|
Financial Services |
EPS (33%) |
ROE (17%) |
Op. Income (8%) |
|
Health Care |
EPS (40%) |
Op. Income (30%) |
EBIT (30%) |
|
Insurance |
Op. Income (46%) |
Op. ROE (23%) |
Op. EPS (15%) |
|
Manufacturing |
Cash Flow (30%) |
EPS (30%) |
Revenue (20%) |
|
Pharmaceuticals |
Revenue (70%) |
EPS (70%) |
Pipeline/R&D (50%) |
|
Retail |
Revenue (40%) |
Op. Income (40%) |
EBIT (30%) |
|
Technology |
Revenue (58%) |
Cash Flow (50%) |
Op. Income (33%) |
Note: Percentages reflect the prevalence of companies disclosing the metric.
2014 Actual Bonus Payouts
Nearly all companies (94%) awarded bonuses to their CEO for 2014 performance. Three companies did not pay a bonus to the CEO as a result of company performance: Coca-Cola, McDonalds, and Target.
Overall, the median CEO bonus payout was 114% of target (or 225% of salary, at median). Across industries, bonuses for Pharmaceutical CEOs exceeded target by the greatest amount (146% of target, at median). 3 of the 9 industries CAP surveyed had a median bonus payout of less than 100%: Retail (82%), Consumer Goods (92%), and Technology (95%).
|
Industry |
Bonus Payout at a Percent of Target |
|||||
|
75th Percentile |
Median |
25th Percentile |
||||
|
2014 |
2013 |
2014 |
2013 |
2014 |
2013 |
|
|
Automotive |
146% |
183% |
122% |
165% |
103% |
120% |
|
Consumer Goods |
148% |
133% |
92% |
112% |
33% |
70% |
|
Financial Services |
124% |
142% |
112% |
126% |
97% |
102% |
|
Health Care |
149% |
149% |
124% |
127% |
108% |
116% |
|
Insurance |
139% |
170% |
132% |
150% |
110% |
123% |
|
Manufacturing |
155% |
119% |
115% |
111% |
98% |
98% |
|
Pharmaceutical |
173% |
158% |
146% |
138% |
118% |
122% |
|
Retail |
100% |
119% |
82% |
78% |
75% |
68% |
|
Technology |
127% |
121% |
95% |
88% |
86% |
69% |
|
Total Sample |
145% |
150% |
114% |
122% |
95% |
95% |
Note: Most companies in the Financial Services industry do not disclose a target bonus for the CEO. For these companies, 3-year average actual bonus was used as a proxy for target bonus.
Conclusion
In our experience, most companies strive to achieve the following with regard to annual incentive plan design:
- Alignment with the company’s business plan
- A balanced portfolio of performance metrics
- An appropriate mix of corporate versus business unit / strategic performance considerations
- The proper amount of structured discretion and/or individual performance
These objectives can be achieved by continuing to assess plan design in relation to strategy and making minor modifications, such as changes to performance metrics and their weightings, as necessary. Short of a major economic shift or regulatory change, we expect to see only modest changes to annual incentive plan designs.


