DOWNLOAD A PDF OF THIS REPORT pdf(0.1MB)
Contact
Daniel LaddinFounding Partner [email protected] 212-921-9359 Matthew Vnuk
Partner [email protected] 212-921-9364
Each year CAP analyzes non-employee director compensation programs among the 100 largest companies. We believe these companies provide insight into where the market will be going in terms of practices. Below is a summary of trends – for pay levels and pay practices – based on 2016 proxy filings.
Key CAP Findings
Board Compensation. pay levels went up
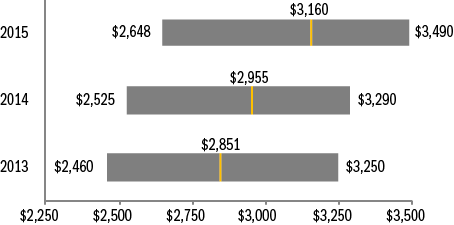
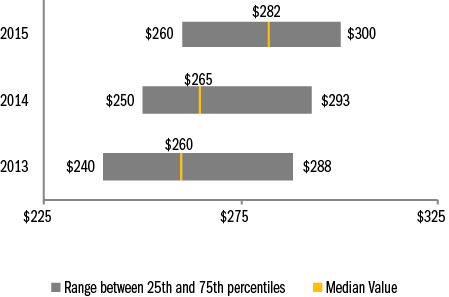
- Total Fees. Increased 6 percent (median is $282K, versus $265K in prior year), which is the biggest single year increase we have seen in more than 4 years, though still within historic norms
- Retainers. Large companies rely on annual retainers (cash and equity) to compensate directors. Pay programs are typically simple and viewed more as an “advisory fee” than an “attendance fee.”
- Meeting fees. Provided by only 11 percent of companies (versus 12 percent in prior year). In general, companies have moved to a fixed retainer pay structure, with a component in cash and a component in equity. We support this approach as it simplifies administration and the need to define “what counts as a meeting.” However, companies may want to consider having a mechanism for paying meeting fees if the number of meetings in a single year far exceeds the norm. For example, if the number of meetings is well above historic norms (e.g., 12 meetings/year), companies could consider paying meeting fees above a specified number of meetings. Three companies in our dataset use this approach to meeting fees.
- Equity. Full-value awards (shares/units) are most common. Only 8 percent of companies use stock options with, surprisingly, only one of these companies being in the traditional technology sector. 97 percent of companies denominate equity awards (stock or options) as a fixed value, versus a fixed number of shares, which is considered best practice as it manages the value each year. Approximately two-thirds of equity awards vest within 1 year of grant (either immediately or cliff vest after 1 year). Nearly 60 percent of equity awards settle at vest, with the remainder settling at or post retirement.
- Pay Mix. On average, 61 percent equity-based versus 39 percent cash-based. Alignment with long-term shareholders is reinforced by delivering a majority of compensation in equity.
Committee Member Compensation. little/no change
- Overall Prevalence. Only 48% of companies paid committee-specific member fees, relying on board-level compensation to recognize committee service, with the general expectation being that all independent directors contribute to committee service needs1.
- Total Fees. Of the companies that pay committee member compensation, the median is $16.8K.
Committee Chair Compensation. little/no change
- Overall Prevalence. Approximately 90 percent of companies provide additional compensation to committee Chairs, typically through an additional retainer and not meeting fees, to recognize additional time requirements, responsibilities, and reputational risk1.
- Fees. At median, $20K in additional compensation (vs. members) was provided to Audit and Compensation Committee Chairs, and $15K additional to Nominating/Governance Committee Chairs.
Independent Board Leader Compensation. little/no change
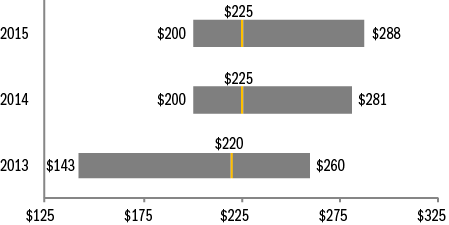
- Non-Exec Chair. Additional compensation is provided by all companies with this role, $225K at median. As a multiple of total Board Compensation, total Board Chair pay is 1.9x a standard Board member, at median.
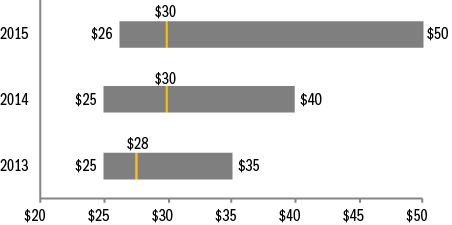
- Lead Director. Additional compensation – $30K, at median – is provided by nearly all companies with this role3. The differential in pay versus non-executive Chairs is in line with typical differences in responsibilities. 75th percentile additional compensation was $50K, up from $40K last year and up from $35K two years ago.
Pay Limits. prevalence of limits went up
- There were 17 companies in our data set that amended an equity plan this year; 2 of these companies already had a shareholder approved limit in place for director compensation. Among the remaining 15 companies, 9 of them (60 percent) implemented a new shareholder approved limit for director compensation.
- In total, 39 percent of the largest 100 companies now have such limits, up from 27 percent in prior year.
- Limits range from $250K to $3.6 million, and were $760K at median. Among companies that denominate the limit in shares, the median is $1.05M, while the median for the companies with value-based limits is $525K.
- Limits typically apply to just equity-based compensation; however, some companies have applied the limits to both cash and equity-based compensation (i.e., total pay) and we anticipate the prevalence of this practice will increase further. Other companies exclude initial at-election equity awards, committee Chair pay, and/or additional pay for Board leadership roles from the limit.
- The limits are largely due to advancement of litigation where the issue has been that directors approve their own annual compensation and are therefore inherently conflicted. Companies have a stronger legal defense – protecting them under the business judgement rule – by having “meaningful limits” approved by shareholders on the maximum award that could be granted to a director. The “business judgment rule” is judicial presumption that directors acted “on an informed basis, in good faith and in the honest belief that the action taken was in the best interests of the company.” An action protected by the business judgment rule will not be second-guessed by the courts. There is a chance that the business judgement rule can be called into question without a meaningful limit. When the business judgment rule does not protect directors’ awards of compensation to themselves, the awards are subject to heightened scrutiny under the “entire fairness test” under which both the process and the amount of the compensation must be found to be entirely fair to the company.
Appendix
Total Board Compensation ($000s)
Equity Compensation
|
Equity Vehicle |
2013 |
2014 |
2015 |
|
Full-Value Equity (Shares/Units) |
95% |
96% |
92% |
|
Stock Options |
2% |
1% |
1% |
|
Both |
3% |
3% |
7% |
|
Award Denomination |
2013 |
2014 |
2015 |
|
Fixed Valued |
88% |
90% |
92% |
|
Fixed Shares |
8% |
6% |
3% |
|
Both |
4% |
4% |
5% |
Additional Compensation for Independent Board Leaders ($000s)
Lead/Presiding Directors
Non-Executive Chairs
Total Company Cost for Board Service ($000s)