


DOWNLOAD A PDF OF THIS REPORT pdf(0.1MB)
Contact
Melissa BurekFounding Partner [email protected] 212-921-9354 Margaret Engel
Founding Partner [email protected] 212-921-9353 Lauren Peek
Partner [email protected] 212-921-9374
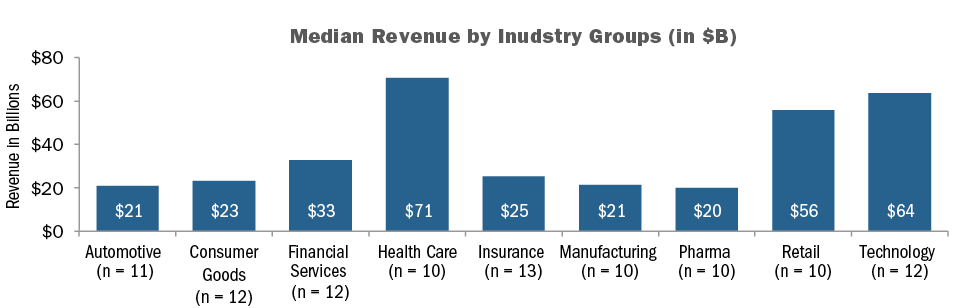
Compensation Advisory Partners (“CAP”) reviewed 2013 proxy disclosure at a sample of 100 companies representing nine industry groups for the 2012 performance year. The industry groups reviewed include Automotive, Consumer Products, Financial Services, Health Care, Insurance, Manufacturing, Pharmaceuticals, Retail, and Technology. Our research examines changes in executive compensation practices in 2012, including observations on current trends and pay program design. This CAPflash focuses on compensation philosophy, pay mix and year over year changes in executive pay levels.
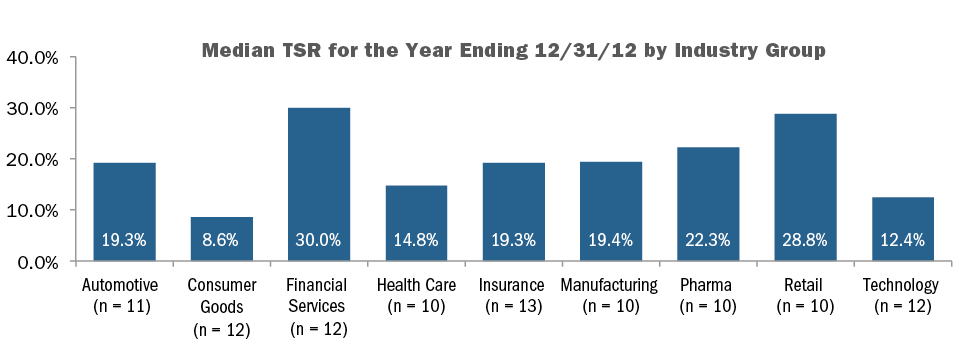
Among the 100 company sample, median revenue was $33B, median market capitalization was $37B and median Total Shareholder Return (TSR) was 19% in 2012. As indicated in the charts below, there is significant variation in company size and performance by industry.
COMPENSATION PHILOSOPHY
Nearly 60% of companies in our study disclose a target total pay position for the Named Executive Officers (“NEOs”). Of these companies, approximately 75% target total pay at median, up from 60% a year ago; indicating that companies are shifting their compensation pay philosophy to a market median standard in reaction to increased scrutiny from shareholders and proxy advisory firms.
|
Target Total Compensation Pay Positioning (n=57) |
CEO |
CFO |
|
Below Median |
1% |
0% |
|
At Median |
74% |
75% |
|
Above Median |
25% |
25% |
CAP Perspective: Change in targeted pay position to median reflects movement to adopt more conservative target pay practices that demonstrate a strong link to performance.
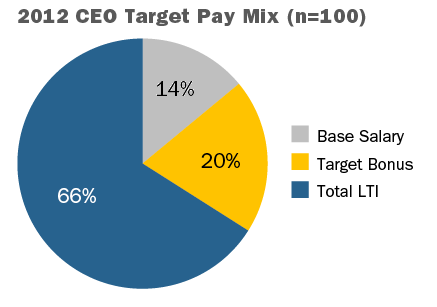
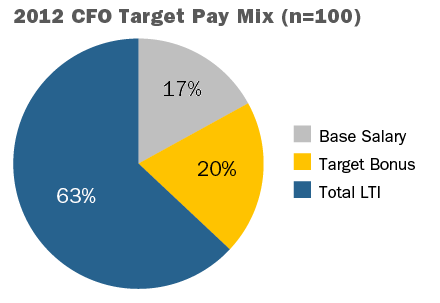
PAY MIX
Overall, companies did not make significant shifts in the total pay mix in 2012 vs. 2011. CEO and CFO total pay continues to place significant emphasis on long-term incentives (“LTI”); on average, LTI reflects 66% of pay for CEOs and 63% for CFOs.
CHANGES IN TARGET PAY LEVELS
The chart below shows average year over year change in target pay levels for CEOs and CFOs in our study. 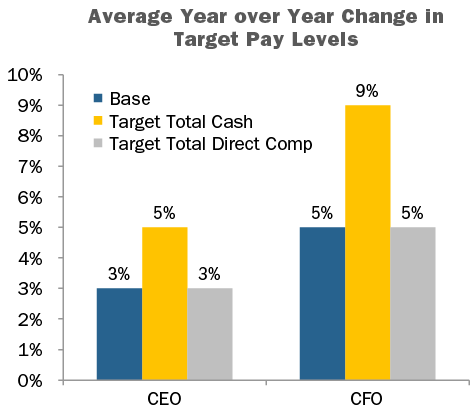
Note: Excludes newly hired/promoted executives and one-time sign-on/retention equity awards. Percentages include zeroes.
CAP Perspective: We see increases in target pay levels in the low single digits, though the most significant increase is in target annual incentive opportunities suggesting that companies are increasing performance-based pay to reinforce the pay-for-performance link.
Base Salary
CEO base salaries in 2012 increased 3%, on average, though only 46% of companies provided salary increases. Base salaries for CFOs increased by 5% though fewer companies provided an increase in 2012 (68%) vs. 2011 (78%) suggesting salary increases were made less frequently for senior executives than other employees.
Executives in the Health Care and Pharmaceutical industries were more likely to receive a salary increase (70% of CEOs in the Health Care industry and 90% of CFOs in the Pharmaceutical industry) than those in other industries. Financial Services, Insurance and Technology industries were less likely to provide a salary increase for the CEO in 2012.
|
Base Salary Action |
CEO |
CFO |
||
|
2012 |
2011 |
2012 |
2011 |
|
|
Increase |
46% |
47% |
68% |
78% |
|
No Change |
52% |
50% |
26% |
20% |
Note: Does not include newly hired CEOs or CFOs. Therefore, percentages do not add up to 100%.
Target Bonus
Target bonus for both the CEO and CFO increased modestly at median levels. At the 75th percentile, the bonus opportunity for CFOs increased by almost 20 percentage points. Target bonuses for CEOs in the Automotive, Consumer Goods and Technology industries increased the most in 2012. CFOs in the Automotive, Retail and Technology industries saw significant increases as well.
|
Summary Statistics |
Target Bonus as a % of Salary |
|||||
|
CEO |
CFO |
|||||
|
2012 |
2011 |
Change in %age Pts. |
2012 |
2011 |
Change in %age Pts. |
|
|
75th Percentile |
200% |
200% |
0% |
143% |
125% |
+18% |
|
Median |
157% |
153% |
+3% |
103% |
100% |
+3% |
|
25th Percentile |
133% |
135% |
-2% |
90% |
85% |
+5% |
Target Total Cash Compensation
Target total cash compensation increased for both the CEO (5%) and CFO (9%) in 2012, mainly due to increases in annual incentive opportunities.
Total Long-term Incentives (LTI)
Increases in total LTI in 2012, on average, were fairly modest; total LTI increased by 3% for CEOs and 5% for CFOs. However, some industries saw significant increases in LTI year over year: CEOs in the Health Care and Consumer Goods industries, on average, received increases in LTI of 30% and 20%, respectively. CFOs in the Technology and Retail industries received the highest increases of 24% and 9%, respectively.
Target Total Compensation
Target total compensation increased over 2011 levels primarily through increases in target annual incentives and, in some industries, through increases in LTI. These findings varied by industry. Financial Services, Pharmaceutical and Retail companies, on average, provided the most significant increases in target annual incentives over other pay components, while Consumer Goods and Health Care industries had the greatest increase in target LTI opportunities.
CONCLUSIONS
Overall, companies had modest increases in target pay levels for the CEO and CFO, through changes in annual and long-term incentives. The Consumer Goods and Health Care industries saw increases in the 15%-20% range driven by higher LTI opportunity while other industries saw more modest changes in total pay levels. Compensation philosophies continue to migrate to median as companies adopt a more conservative pay philosophy. Overall pay mix for the CEO continues to maintain a strong LTI component (66% of pay) with salary representing smaller component of pay (14%), on average. We expect shareholders and proxy advisory firms to continue to influence company pay strategy, as companies to continue to provide modest increases in target total pay mainly through incentive compensation.
|
Industry |
Average Year over Year Change in CEO Target Pay – Top 3 Industries and Overall Sample |
|||
|
Base |
Target Bonus |
LTI |
Target Total Compensation |
|
|
Health Care |
2% |
4% |
30% |
19% |
|
Consumer Goods |
3% |
13% |
20% |
17% |
|
Automotive |
4% |
7% |
7% |
6% |
|
Overall Sample |
3% |
8% |
3% |
3% |


