


DOWNLOAD A PDF OF THIS REPORT pdf(0.3MB)
Contact
Melissa BurekFounding Partner [email protected] 212-921-9354 Margaret Engel
Founding Partner [email protected] 212-921-9353 Lauren Peek
Partner [email protected] 212-921-9374
Compensation Advisory Partners (“CAP”) reviewed 2012 proxy disclosure at a sample of 114 companies representing ten industry groups for the 2011 performance year. The industry groups reviewed include Aerospace and Defense, Automotive, Consumer Products, Financial Services, Health Care, Insurance, Manufacturing, Pharmaceuticals, Retail, and Technology. Our research of these Fortune 500 companies examines changes in executive compensation practices in 2011, observations on current trends, and annual and long-term incentive plan design practices.
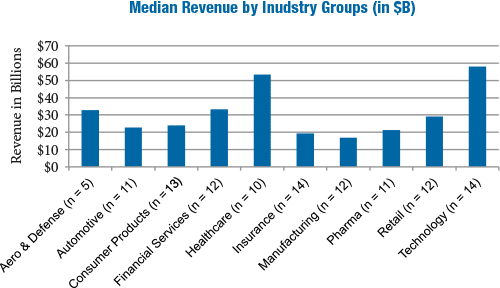
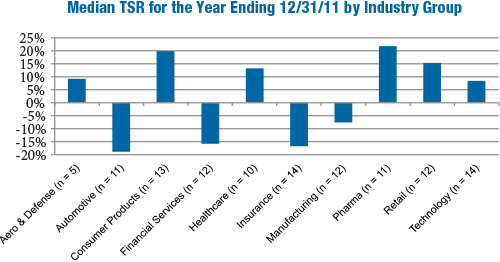
For the 114 company sample, median revenue was $30B, median market capitalization was $29B and median Total Shareholder Return (TSR) was 3% for 2011. As indicated in the charts below, significant variations in company size and performance occur by industry.
What We Found
During 2011, companies continued to make refinements to their executive compensation programs to improve the alignment between pay and performance. Compensation opportunities improved during 2011, as many companies in our sample resumed modest salary increases to the Named Executive Officers (“NEOs”), paid annual incentives for 2011 performance that were above target on average, and continued to shift long-term incentive opportunities into more performance-based vehicles.
Compensation Strategy
Compensation Strategy Changes
A few companies (7%) disclosed making changes to their compensation strategy in 2011. Of the eight companies that disclosed changes, five companies lowered their target pay positioning to be at median of the market (vs. above median) due, in part, to increasing scrutiny from shareholders and proxy advisory firms:
- Allstate: In 2010, the company targeted pay levels between 50th and 75th percentiles of the market. In 2011, Allstate received shareholder feedback that pay should not be targeted above the 50th percentile and, therefore, the company reduced its benchmark target to the median
- Amgen: Significantly reduced the grant value of regular annual LTI equity awards by lowering the benchmarking target by 25 percentage points to the median of the peer group to be responsive to stockholders
Two companies changed the mix between fixed and variable pay; Lincoln National and Prudential Financial increased the portion of total compensation based on variable pay.
Compensation Philosophy
66% of companies in our study disclosed their desired competitive pay positioning for the NEOs. Among these companies, approximately 60% target total direct compensation at median. Pay positioning varies among the industry groups. More companies in the Consumer Goods and Technology industries targeted total compensation above median (60% and 67%, respectively), while companies in the Manufacturing and Pharmaceutical industries tend to target pay at median (88% and 80%, respectively).
Pay Mix
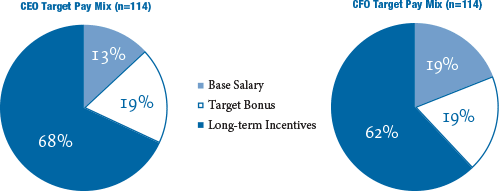
The target pay mix for CEOs includes a higher percentage of total pay in the form of long-term incentives, averaging 68% across industries. In contrast, the average CFO’s pay mix was composed of 62% in long-term incentives. This disclosed pay mix varies by industry with the Technology industry providing the highest proportion of CEO total compensation (75%) in long-term incentives.
Peer Groups Used For Benchmarking
In 2011, 30% of companies disclosed changes to their peer groups used to benchmark senior executive compensation levels. Many companies refined the peer group to better reflect their size and industry focus. More frequent peer group changes were due to, in part, greater shareholder scrutiny resulting from Say on Pay votes. We suspect that Institutional Shareholder Services’ (ISS) new approach to peer group development for their CEO pay-for-performance assessment also had an impact.
Approximately 50% of companies decreased the number of comparator companies in their peer group while 30% of companies increased the size of the peer group and 20% disclosed changes to their peer group but did not indicate an increase or decrease in the number of peer companies.
Base Salary Actions
As the economy continues its slow rebound, we found that more companies provided salary increases for senior executives. 47% of companies in our sample provided a salary increase for their CEO, while a majority of companies (78%) provided a salary increase for their CFO. Companies in the Automotive, Consumer Goods and Pharmaceutical industries were more likely to provide a salary increase to the CEO compared to the other industries reviewed. Companies typically cited the desire to provide a competitive merit increase (generally ranging from 3 – 5%) as the rationale. When companies provided salary increases above this range, market salary adjustments (40% of companies) and promotional increases (15% of companies) were often cited as the reasons.
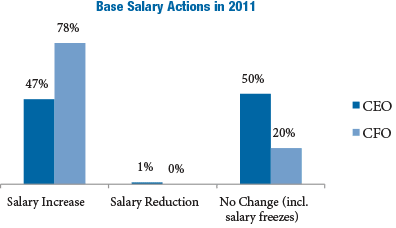
Note: Does not include new CEOs or CFOs hired in 2011. Therefore, percentages do not add up to 100%
Annual Incentive Plan Design
Nearly 40% of companies disclosed annual incentive plan design changes in 2011 or planned changes for 2012. Changes to the annual incentive plan were varied but most often reflected a refinement to enhance the pay for performance alignment and/or support the business strategy. Of companies that made changes to their annual incentive plan, 42% made changes to plan metrics that determine funding. 28% of companies increased the annual incentive target opportunity for the CEO and/or CFO to remain competitive with market practice.
The chart below presents the reported AIP changes:
|
% of Cos. Reporting Changes |
|||
|
Type of Change Reported in CD&A |
No. of Cos. |
2011 (n = 43) |
2010 (n = 57) |
|
Change in performance metrics used to fund awards |
18 |
42% |
33% |
|
Increased target award opportunities |
12 |
28% |
26% |
|
Change in performance metric weighting/mix |
9 |
21% |
18% |
|
Change in maximum award payout |
5 |
12% |
4% |
|
Added risk-based metrics |
2 |
5% |
n/a |
|
Other changes |
8 |
19% |
16% |
Note: Percentages do not add up to 100% due to multiple responses.
Change in Performance Metrics
Half of the companies that made changes to annual incentive plan metrics incorporated additional metrics to their plans in 2011/2012. Four companies reduced the number of metrics to focus executives on key criteria most aligned with the business strategy.
Three companies incorporated strategic measures to their annual incentive plan in addition to the financial metrics:
- Eli Lilly: Added achievement in new product pipeline milestones as an incentive plan metric
- Lowe’s Cos: Added the completion of three strategic incentives as additional performance goals
- Visteon: In addition to profitable growth, cash flow and quality, the 2012 annual incentive award will also be based on the accomplishment of key strategic actions
In 2011, two companies, Bank of New York Mellon and Manulife Financial, added risk-based adjustments to the annual incentive plan payouts, reinforcing the objective of minimizing any potential risk-related behavior that could have an adverse impact on the company.
Annual Incentive Plan Metrics
Revenue, EPS, operating income and cash flow were the most commonly used annual incentive plan metrics across all industry groups in 2011. Industries such as Insurance and Pharmaceutical tend to have industry specific metrics (e.g., Operating Income/EPS in the Insurance industry and Pipeline/R&D Development in the Pharmaceutical industry). Customer-focused industries (e.g., Consumer Goods, Pharmaceuticals, Retail and Technology) were more likely to have Revenue as an annual incentive metric.
The three most prevalent metrics for each industry group are detailed below:
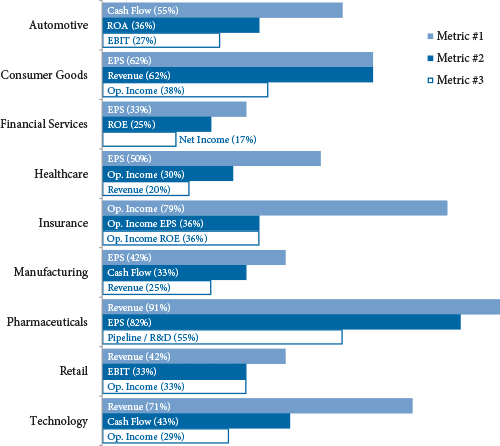
Note: Excludes Aerospace and Defense due to limited sample size (n = 5).
2011 Bonus Payout Details
Similar to last year, 96% of companies paid a bonus to NEOs for 2011 performance. A majority of companies (80%) used financial goals to determine annual incentive payouts and approximately 15% have a plan that provides a payout based on some degree of Compensation Committee or Board discretion. At median, CEOs received a payout that was 130% of target in 2011 (compared with 135% in 2010). In the Insurance and Technology industries, the median CEO payout approximated target suggesting performance was near the budget/plan for the companies in our review. Bonus payouts for the CEO’s in the Aerospace and Defense, Automotive, Manufacturing and Pharmaceuticals industries were generally 145 – 160% of target, likely reflecting stronger than expected performance in 2011.
All companies that paid a bonus in 2011 provided all or a portion of the award in the form of cash. 11% required executives to defer a portion of the annual incentive payout, with most of these companies deferring the payout in full value shares (e.g., restricted stock, restricted stock units, etc.) and one company, Morgan Stanley, providing a deferred cash payout. Approximately half of companies with mandatory deferrals are in the Financial Services industry, where it is more common for incentive pay (annual and long-term) to be deferred for a longer time period (i.e., at least 3 years).
Long-Term Incentive Plan Design
50% of companies made a change to their long-term incentive (“LTI”) plan design in 2011 or for 2012. 46% of these companies changed the LTI vehicle mix with a majority providing a greater emphasis on performance-based equity. Approximately 40% of companies eliminated and/or added LTI vehicles to their program. Companies were more likely to eliminate stock options or time-based restricted stock and add a performance share plan. The table below outlines the reported changes:
|
% of Cos. Reporting Changes |
|||
|
Type of Change Reported in CD&A |
No. of Cos. |
2011 (n = 57) |
2010 (n = 77) |
|
Changed mix of LTI award vehicles |
26 |
46% |
26% |
|
Added or eliminated LTI vehicle |
22 |
39% |
29% |
|
Changed long-term performance metric |
12 |
21% |
31% |
|
Changed LTI award opportunity level |
10 |
18% |
18% |
|
Changed performance plan comparison/peer group |
4 |
7% |
n/a |
|
Other |
13 |
23% |
22% |
Note: Percentages do not add up to 100% due to multiple responses.
Long-Term Incentive Prevalence
The prevalence of performance-based equity increased slightly in 2011 and the use of stock options and time-based restricted stock remained relatively flat. Further, companies continue to provide a larger portion of LTI in performance-based incentive vehicles.
Below is the breakdown of overall LTI vehicle prevalence for NEOs in 2009-2011:
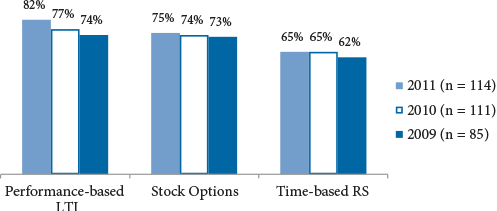
Note: Percentages do not add up to 100% due to multiple responses.
Companies use a balanced approach in delivering the executive LTI program. Nearly 55% of companies deliver LTI in the form of two vehicles and 35% use three vehicles.
Long-Term Award Mix
A majority of companies that made changes to the LTI program shifted a greater portion of LTI to performance-based awards.
|
% of Cos. Reporting Changes |
|||
|
Type of Change Reported in CD&A |
No. of Cos. |
2011 (n = 26) |
2010 (n = 20) |
|
Greater emphasis on performance-based awards |
17 |
65% |
60% |
|
Reduced emphasis on stock options |
11 |
42% |
35% |
|
Reduced emphasis on time-based restricted stock |
12 |
46% |
25% |
|
Other |
6 |
23% |
25% |
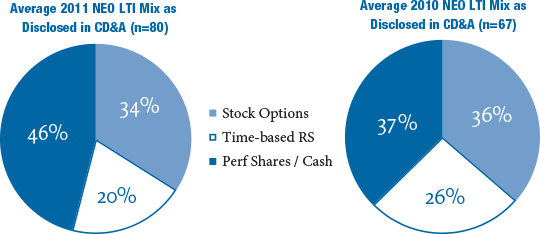
Of the 80 companies that disclosed a targeted LTI mix for 2011, the average CEO LTI mix included 46% in the form of performance shares or performance cash vs. 37% in 2010. The portion of LTI delivered in restricted stock decreased from 26% to 20% in 2011, a further reflection of the shift towards performance-based equity. The percentage of LTI in the form of stock options remained relatively flat year-over-year.
Performance-Based LTI Metrics
For companies that have a performance-based LTI plan, 36% use TSR and 34% use EPS, the most prevalent metrics used. More companies use absolute performance metrics than relative metrics. All companies using TSR disclose using it as a relative metric (vs. absolute) compared to a peer group or broader index.
The chart below displays the prevalence of LTI metrics for performance-based awards in 2011 and 2010:
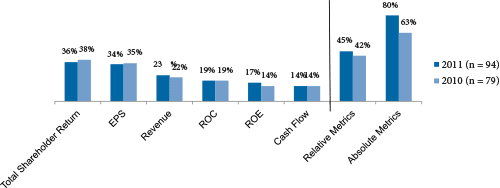
Note: Percentages do not add up to 100% due to multiple responses.
Treatment of Dividend Equivalents
49% of companies provide dividend equivalents on time-based restricted stock awards and approximately 30% do so for performance share awards. Of these companies, most pay dividends when shares are vested or earned (71% and 88%, respectively).
Conclusions
Companies are continuing to make changes to their compensation philosophy, primarily through targeting a more moderate (median) market pay position and making refinements to the peer group used for benchmarking. As the economy continues to slowly rebound, a strong majority of companies gave salary increases to NEOs in the past year. And as shareholders and shareholder advisory groups have an increasingly stronger voice in the compensation arena, companies are making notable program modifications that strengthen the pay and performance alignment, through refining annual incentive metrics or delivering more LTI in the form of performance-based awards.


