


DOWNLOAD A PDF OF THIS REPORT pdf(0.6MB)
Contact
Melissa BurekFounding Partner [email protected] 212-921-9354 Margaret Engel
Founding Partner [email protected] 212-921-9353 Lauren Peek
Partner [email protected] 212-921-9374
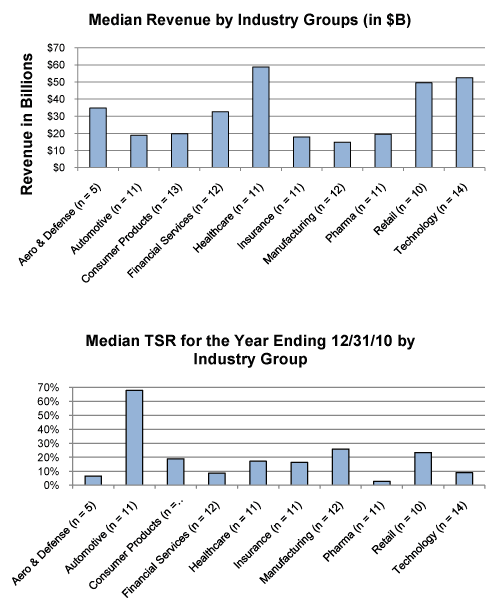
Compensation Advisory Partners (“CAP”) reviewed 2011 proxy disclosure at a sample of 111 companies representing ten industry groups for the 2010 performance year. The industry groups reviewed include Aerospace and Defense, Automotive, Consumer Products, Financial Services, Health Care, Insurance, Manufacturing, Pharmaceuticals, Retail, and Technology. Our research of these Fortune 500 companies examines changes in executive compensation practices in 2010, observations on current trends, and annual and long-term incentive plan design practices.
For the 111 company sample, median revenue was $27B, market capitalization was $30B and Total Shareholder Return (TSR) was 16% for 2010.
What We Found
Highlights of our research findings are below. Most companies did not make sweeping changes to their executive compensation programs. But many companies continued to refine annual and long-term incentive plans to strengthen the alignment between executive rewards and financial performance and to focus executives on the overall health of the organization.
Compensation Strategy Changes
Similar to 2009, most companies did not make significant changes to their compensation strategy. Financial Service firms were more likely to make changes to the strategy (e.g., increase at-risk pay) as they emerged from compensation restrictions imposed by TARP.
Peer Groups Used For Benchmarking
In 2010, companies continued to review and modify their peer group, although wholesale changes were not the norm. Approximately 40% of companies made some modification to their peer group by selecting peers that more closely aligned with their size and business mix. Pharmaceutical companies, in particular, continued to make changes to the peer group as industry consolidation continued.
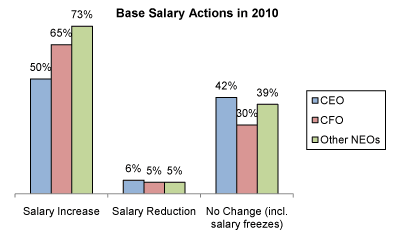
Base Salary Actions
2010 saw the return of salary increases for senior executives with a majority of companies providing salary increases to Named Executive Officers (NEOs) in 2010 (vs. 20% in 2009) as the economy improved. Within the NEO ranks, companies provided increases more frequently to executives below the CEO as they focused on retaining top talent and remaining competitive with the market. Salary reductions were most prevalent in companies that emerged from TARP, as these companies reverted to a compensation mix that provides a greater emphasis on incentive-based pay. Fewer companies froze base salaries for NEOs in 2010; companies in the Consumer Goods, Retail and Technology industry groups were more likely to maintain salaries at 2009 levels.
Annual Incentive Plan Design
Approximately 50% of companies disclosed a change in 2010 or planned changes for 2011 to their annual incentive plan design. Companies continued to refine the metrics and weightings that determine plan funding and payout as pay for performance remains a major focus for companies. 26% of companies increased the target annual incentive opportunity for at least one NEO illustrating that companies are focusing on the competitive market given the improvements in the economy. Although changes to annual incentive plans vary by company, there continues to be an attempt to reward executives based on appropriate indicators of company success.
The chart below presents the reported AIP changes:
| % of Cos. Reporting Changes | |||
| Type of Change Reported in CD&A | No. of Cos. | 2010 (n = 57) | 2009 (n = 34) |
| Change in performance metrics used to fund awards | 19 | 33% | 44% |
| Change in performance metric weighting mix* | 10 | 18% | n/a |
| Increased target award opportunities | 15 | 26% | 26% |
| Adopted / amended annual incentive plan | 13 | 23% | 6% |
| Modified performance scale | 6 | 11% | n/a |
| Reduced maximum award payout leverage | 2 | 4% | 12% |
| Other changes | 9 | 16% | 9% |
Note: Percentages do not add up to 100% due to multiple responses.
* Not captured separately in 2009 and is included in preceding category.
Change in Performance Metrics
Of the 19 companies that made changes to performance metrics, most (10 companies) added metrics to the plan design. Additionally, 10 companies changed the weighting of the AIP metrics. In general, these changes were focused on basic company performance indicators such as profitability and cash flow. For example,
- Computer Sciences: Added free cash flow as a measure to emphasize the importance of liquidity and profitability
- Morgan Stanley: Added capital adequacy and credit rating measures to the metrics used to determine financial achievements
- Visteon: Added product quality and free cash flow as performance metrics
Many companies added cash flow as an annual incentive metric in 2010 indicating that in the wake of the recent economic downturn, companies are balancing profitability with liquidity.
Annual Incentive Plan Metrics
In 2010, the most common metrics used across all industry groups were revenue or revenue growth, EPS and cash flow. Cash flow was one of the three most common metrics in five industry groups (Automotive, Consumer Goods, Manufacturing, Pharmaceuticals and Technology). More than other industries, annual incentive metrics for insurance companies tend to focus on industry-specific measures. The most prevalent metrics in the Automotive industry are cash flow and return on assets (ROA) denoting a focus on company operating performance during the economic recovery.
The three most prevalent metrics for each industry group are detailed below:
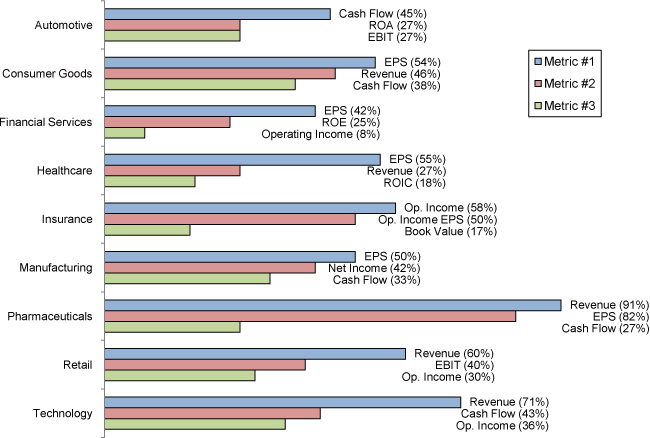
Note: Excludes Aerospace and Defense due to limited sample size (n = 5).
2010 Bonus Payout Details
Nearly all companies (95%) paid a bonus to an NEO for 2010. Most companies (90%) used financial performance to calculate the payout, although many of these companies (19%) also used discretion (positive and negative) to account for non-financial performance. Actual bonus payouts for CEOs on average were approximately 135% of the target incentive opportunity for 2010, indicating a rebound in financial performance in 2010 over 2009.
Long-Term Incentive Plan Design
A majority of companies (approximately 70%) reported making changes to their long-term incentive plan designs in 2010 or for 2011. Similar to the annual incentive plan changes, many companies (32%) reported changes to the performance metrics used to determine award payouts. 26% of companies reported changes to the LTI vehicle mix, with companies placing more emphasis on performance-based awards. This suggests that companies are focusing executives on longer-term goals. The table below outlines the reported changes:
| % of Cos. Reporting Changes | |||
| Type of Change Reported in CD&A | No. of Cos. | 2010 (n = 77) | 2009 (n = 60) |
| Changed long-term performance metric | 24 | 31% | 38% |
| Adopted / amended long-term incentive plan | 24 | 31% | n/a |
| Changed mix of LTI award vehicles | 20 | 26% | 55% |
| Added or eliminated LTI vehicle* | 22 | 29% | n/a |
| Changed LTI award opportunity level | 14 | 18% | 20% |
| Changed performance metrics/weighting | 6 | 8% | n/a |
| Other | 17 | 22% | 35% |
Note: Percentages do not add up to 100% due to multiple responses.
* Not captured separately in 2009 and is included in preceding category.
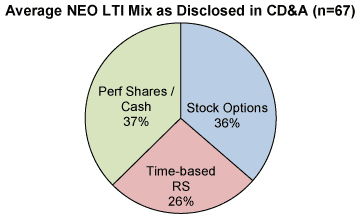
Long-Term Award Mix
From companies making changes to their LTI award mix, a majority (60%) disclosed that they increased the emphasis on performance by shifting a portion of total LTI value from time-based awards (options and restricted stock) to performance-based vehicles. On average, companies are providing approximately 25% of the total LTI awarded to NEOs in time-based restricted stock with the remaining value equally split between performance-based LTI and stock options.
| % of Cos. Reporting Changes | |||
| Type of Change Reported in CD&A | No. of Cos. | 2010 (n = 20) | 2009 (n = 33) |
| Greater emphasis on performance-based awards | 12 | 60% | 55% |
| Reduced emphasis on time-based restricted stock | 7 | 35% | n/a |
| Reduced emphasis on stock options | 5 | 25% | n/a |
| Other | 5 | 25% | 45% |
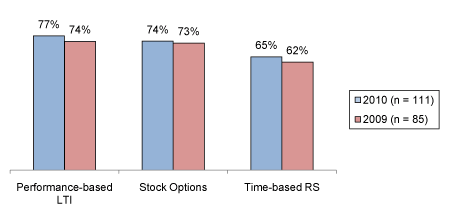
Long-Term Incentive Prevalence
Although companies making a change indicated they are placing a greater emphasis on performance-based awards, equity awards with time-based vesting continue to be prevalent. The prevalence of stock options and restricted stock with time-based vesting remained relatively flat in 2010, with 74% and 65% of companies using these vehicles, respectively.
Below is the breakdown of overall LTI vehicle prevalence for NEOs in 2010 vs. 2009:
Note: Percentages do not add up to 100% due to multiple responses.
Companies typically grant multiple LTI vehicles to NEOs to offer a balanced program with different performance metrics and time horizons. Most companies (77%) grant two or three award vehicles to provide LTI to executives.
Performance-Based LTI Metrics
For companies using performance-based LTI, TSR (38%) and EPS (35%) continue to be the most prevalent metrics. More companies are incorporating return on capital or return on equity as a metric in 2010 to increase the focus on longer term health/stability and the quality of earnings. The use of revenue and cash flow remained relatively flat year over year.
The chart below displays the prevalence of LTI metrics for performance-based awards in 2010 and 2009:
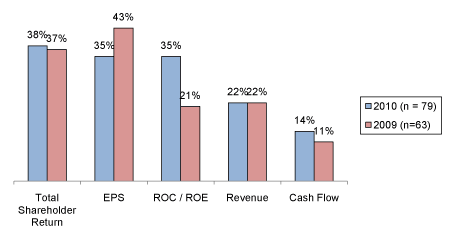
Note: Percentages do not add up to 100% due to multiple responses.
Treatment of Dividend Equivalents
Approximately 40% of companies that grant restricted stock (either time-based or performance-based) and 20% of companies that grant performance shares / units disclose that they pay dividend equivalents to executive officers. Companies typically pay dividends when the shares have vested or are earned.
Conclusions
2010 saw changes to annual and long-term incentive plan design in response to the rebounding economy, greater shareholder scrutiny, as a result of say on pay, and an attempt to further align pay and performance. With the economy on the rebound companies provided more frequent salary increases to NEOs in 2010 and were less likely to freeze base salaries. Companies modified incentive plan metrics, focusing on both company profitability and cash flow. The executive LTI mix continues to shift, with companies reporting more emphasis on performance-based awards. We expect to see companies continue to refine pay programs overall with the objective of strengthening pay and performance linkages and transparency.


