


DOWNLOAD A PDF OF THIS REPORT pdf(0.4MB)
Contact
Daniel LaddinFounding Partner [email protected] 212-921-9359 Matthew Vnuk
Partner [email protected] 212-921-9364
CAP analyzed director compensation programs among Fortune 100 companies1,2. These firms are generally considered trend-setting organizations. This CAPflash reflects key findings from the analysis.
Notable Findings
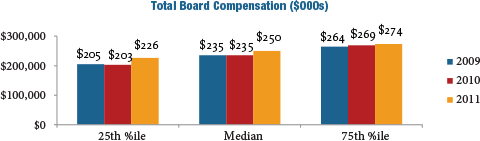
Total Board Compensation
At median, non-employee director compensation increased six percent in 2011, after being flat in 2009 and 2010. Year-over-year, median Total Board Compensation increased from $235,000 to $250,000{anchor anchor=’footnote-907-3′ text=’3′}.
Use of Board meeting fees was a minority practice in 2011, with only 19 percent of companies paying meeting fees. This declined from 23 percent in 2010. In line with emerging practices, more and more large companies are relying on annual retainers to compensate outside directors.
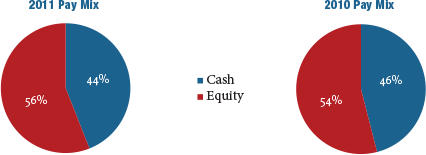
Pay Mix
The mix of cash and equity paid to outside directors was generally consistent between 2010 and 2011. On average, the majority of compensation delivered to directors continues to be in the form of equity.
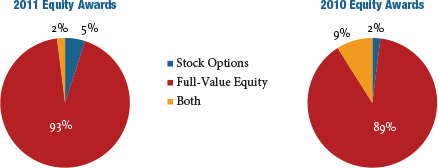
Equity Compensation
Full-value equity awards, including restricted stock units, restricted stock, deferred stock units and outright awards of common stock, continued to increase as a percentage of total equity delivered. In 2011, only seven percent of large companies granted stock options, down from 11 percent in 2010.
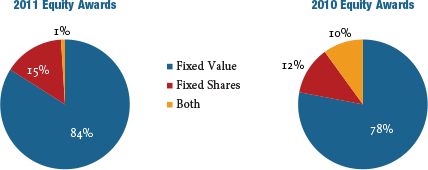
Year-over-year, equity awards denominated as a fixed value increased in prevalence, as opposed to awards based on a fixed number of shares.
CAP Perspective: Over the next few years, we expect the following changes in director compensation to take place: 1) low-to-mid single-digit annual increases in Total Board Compensation; 2) more companies moving to fixed retainer pay structures with a component in cash and a component in equity as opposed to paying meeting fees; and 3) a continued emphasis on full-value equity awards. Delivering a majority of compensation in the form of equity coupled with stock ownership/retention requirements creates strong alignment with long-term shareholders and is considered a best practice.
Committee Compensation
Companies are de-emphasizing committee member compensation and focusing on overall Board compensation. Our research found that just over 50 percent of companies studied pay no committee-specific fees to members of any of the three major committees{anchor anchor=’footnote-907-4′ text=’4′}, an increase from approximately one-third in 2010. During 2011, median committee member compensation decreased when compared with 2010{anchor anchor=’footnote-907-5′ text=’5′}. At median, committee member compensation is now $0.
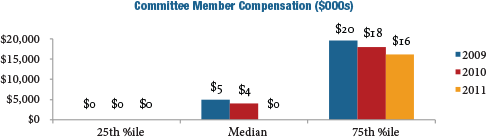
CAP Perspective: We expect the trend away from committee member fees to continue at a slow-to-moderate pace with the value being rolled into Board cash or equity retainers.
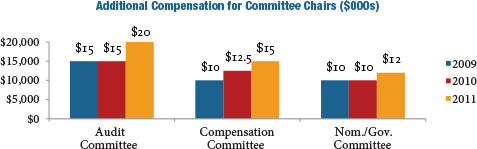
Unlike member compensation, median additional compensation for committee Chairs increased from 2010 to 2011: +33 percent for the Audit Committee; +20 percent for the Compensation Committee (following a 25 percent increase from 2009 to 2010); and +20 percent for the Nominating/Governance Committee. The increases have been driven by recognition of the differential between the time requirement of the leadership role versus that of a committee member.
Lead/Presiding Directors and Non-Executive Chair of the Board
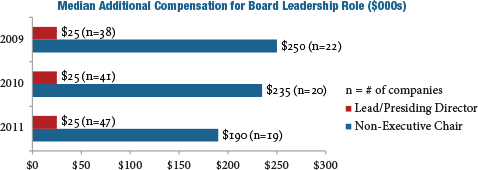
During 2011, the prevalence of providing additional compensation for Lead/Presiding Directors and non-Executive Board Chairs increased from approximately 65 percent in 2010 to approximately 70 percent in 2011. In terms of additional compensation for the role, median pay was unchanged at $25,000 in 2011 for Lead/Presiding Directors and decreased for non-Executive Chairs.
CAP Perspective: While not all non-executive Board leaders receive additional pay for the role, prevalence of additional compensation for these roles is expected to continue to increase over time. The differential in pay between Lead/Presiding Directors and non-Executive Chairs is in line with the responsibilities of each position.
Conclusion
The time commitment and potential for reputational and legal risk connected with service as a director has increased over the past few years, yet economic challenges and an uneven recovery have slowed the rate of growth in director compensation. Due to this, we have observed only moderate increases to director pay levels. However, pay practices for directors continue to evolve. We have observed a continuing and significant trend towards simplification, as director compensation becomes viewed more as an “advisory fee” than an “attendance fee.”
It continues to be important to comprehensively evaluate director pay programs on a regular basis or risk falling behind the curve in terms of desired market positioning and best in class program design. When programs are evaluated, the process and practices listed below should be considered.
|
Best in Class Director Compensation PROCESS |
Establish director pay levels and structure in an informed, deliberate and objective way, with consideration given to market data, trends and outlook Define target market positioning for total pay “Market” should reflect the peer group used for executive compensation benchmarking and/or size-appropriate general industry data Use compensation as a tool to align the interests of non-employee directors and long-term shareholders Disclose the director compensation philosophy and rationale for the program |
|
Best in Class Director Compensation PRACTICES |
Align pay levels with an organization’s size and complexity; in turn, provide appropriate pay for time and responsibilities Review director pay programs focusing on aggregate pay (Total Board Compensation), considering the ratio of cash compensation to equity compensation and additional pay for Board leadership roles Structure pay so that equity represents at least half of the total The pay program should be viewed as an “advisory fee” vs. an “attendance fee” Establish meaningful equity ownership requirements Eliminate benefit/perquisite programs unless there is a strong business case for maintaining them |
1 Analysis includes public Fortune 100 companies (excludes privately held companies).
2 Research assistance for this report was provided by Roman Beleuta, Armando Rivera and Kevin Scott.
3 Total Board Compensation reflects all cash and equity compensation for Board and committee service, excluding compensation for additional leadership roles such as committee Chair, Lead/Presiding Director, or non-executive Chair of the Board.
4 Audit, Compensation and Nominating/Governance committees.
5 Reflects all compensation for committee member service (excludes additional fees for leadership roles), across all Board committees.


