

The 2010 Dodd-Frank Wall Street Reform and Consumer Protection Act (“Dodd-Frank”) directed the SEC to enact rules that require disclosure in the annual proxy statement of the ratio of Chief Executive Officer (CEO) compensation to that of the median employee, including the absolute value for each input that goes into the ratio calculation. More than five years later, final pay ratio rules have been released by the SEC. These rules will go into effect requiring companies to provide disclosure of their pay ratios for their first fiscal year beginning on or after Jan. 1, 2017.
While many companies are preparing for the new pay ratio disclosure requirements from the SEC, ratios of CEO pay to other NEOs are also something companies should pay close attention to. Committees can use these ratios as a starting point to assess issues such as retention, talent development, and succession planning. A high ratio can be an indicator that the CEO is potentially carrying too much of the company, a disconnect exists between the pay practices for the CEO vs. other senior leaders, or that there is no succession plan in place. Having healthy internal equity with appropriate ratios of pay for leadership, and an eye on general market norms, is an important factor in talent acquisition and retention.
This CAPflash focuses on three NEO pay ratio calculations:
- CEO versus Chief Operating Officer (COO);
- CEO versus Chief Financial Officer (CFO); and
- CEO versus General Counsel (GC).
In this study, we provide market practice among S&P 500 companies, as well as the policies of proxy advisory firms, ISS and Glass-Lewis. In our analysis, we use the following target pay elements per proxy disclosure: disclosed base salary, target annual incentive, and target/grant date value of LTI awards.
Please note that the ratios used in this analysis are calculated from proxy disclosure. Therefore, if a COO or GC is not among the top 5 highest paid, as required in proxy disclosure, they are not included in the analysis—CFO pay disclosure is required.
What does our research show?
To evaluate market norms, Compensation Advisory Partners (“CAP”) conducted an analysis of senior executive target pay ratios among S&P 500 companies during the most recent three fiscal years (as of August 22, 2016).
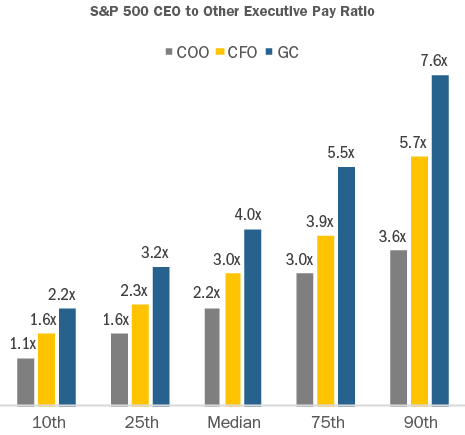
- At median, CEO pay was 2.2x the COO; i.e., for every $1.00 paid to the COO, the CEO was paid approximately $2.20
- At median, CEO pay was 3.0x the CFO; i.e., for every $1.00 paid to the CFO, the CEO was paid approximately $3.00
- At median, CEO pay was 4.0x the GC; i.e., for every $1.00 paid to the GC, the CEO was paid approximately $4.00
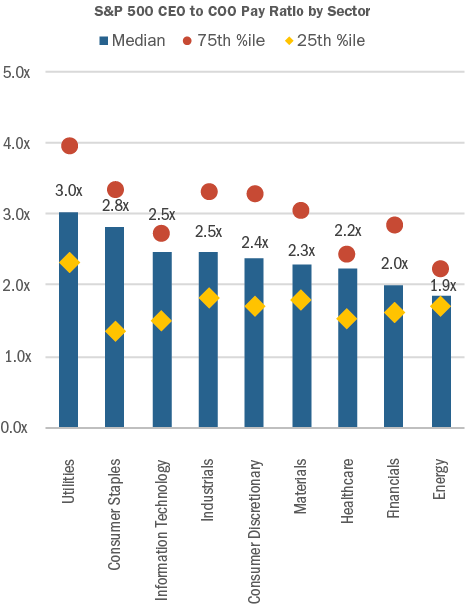
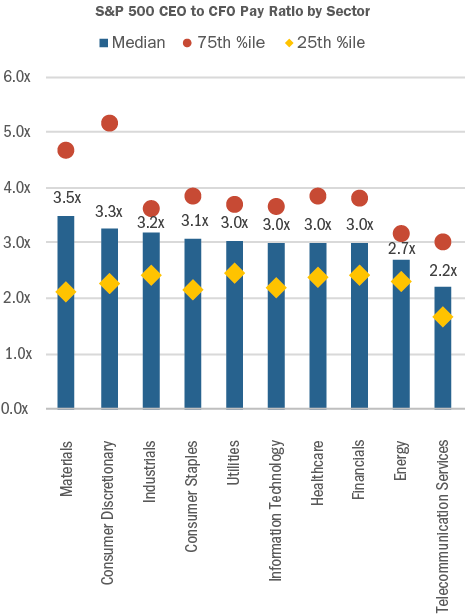
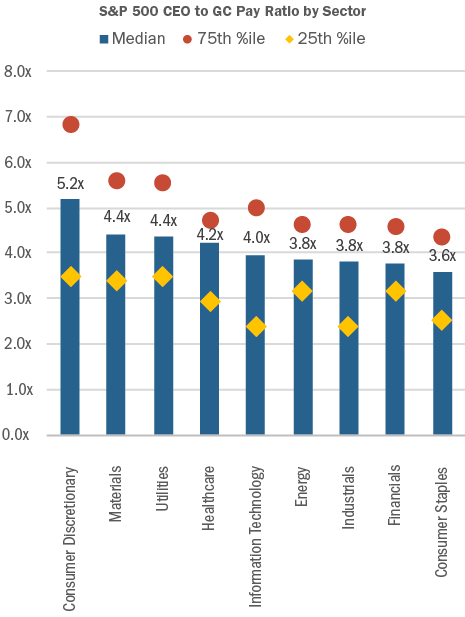
CAP also analyzed the S&P 500 senior executive pay ratios by industry.
- For the CEO vs. COO ratio, the Utilities sector had the highest ratio of 3.0x at median, while Energy had the lowest ratio of 1.9x at median
- For the CEO vs. CFO ratio, the Materials sector had the highest ratio of 3.5x at median, while Telecommunication Services had the lowest ratio of 2.2x, at median
- For the CEO vs. GC ratio, the Consumer Discretionary sector had the highest ratio of 5.2x at median, while Consumer staples had the lowest ratio of 3.6x, at median
Note: Telecommunication Services was not included because the sample was too small.
Note: Telecommunication Services was not included because the sample was too small.
How do ISS and Glass-Lewis use pay ratios?
Both proxy advisory firms include senior executive pay ratios in their annual proxy analyses.
- ISS includes the ratio of CEO pay versus the second highest paid active NEO, as well as the ratio of CEO pay versus the average of the other active NEOs. “Pay” includes all elements from the Summary Compensation Table; however, the grant-date value of stock options is updated to reflect ISS’ methodology which differs from accounting rules
- Glass-Lewis includes the ratio of CEO pay versus the average of other NEOs during each of the past three years. “Pay” includes select elements from the Summary Compensation Table: Salary, Bonus, Non-Equity Incentive Plan, Stock Awards, and Option Awards
ISS also uses pay ratio as one of the inputs to the Compensation score it assigns companies in its QuickScore 3.0 tool, which is meant to influence investment decisions through an assessment of risk factors. The ratio of CEO pay versus the second highest paid active NEO is included in QuickScore 3.0.
When do proxy advisors perceive there to be a possible issue?
To our knowledge, these ratios have not been used by ISS or Glass-Lewis to justify an Against Say on Pay vote recommendation. However, large pay discrepancies can reinforce other negative assessments. In general, comments from ISS and Glass-Lewis are likely when the CEO to NEO ratio exceeds 4x. Ratios exceed 4x at 5-10% of S&P companies, depending on which ratio is used (see ISS and Glass-Lewis definitions above). Ratios rising to 5-6x, or greater, will receive more strongly worded commentary.
Conclusion
Since companies are very different in their organizational and operational structures, we believe that there is limited utility in the CEO pay ratio disclosure that will be required by the SEC under Dodd-Frank. However, looking at the ratios of leadership pay at companies in the same business sector and/or of the same size, can provide important information and insights. It is worthwhile for compensation committees to track this information internally and on a relative basis. Such information can be used as an input in the pay benchmarking process and as a barometer of healthy succession planning, as well as contributing to effective talent acquisition and retention.


