


DOWNLOAD A PDF OF THIS REPORT pdf(0.1MB)
Contact
Lauren PeekPartner [email protected] 212-921-9374 Rose Marie Orens
Partner Emeritus [email protected] 212-921-9352
Highlights
- Median increase of 15% in total compensation for CEOs delivered through both above target bonus payouts and higher long-term incentive awards (“LTI”)
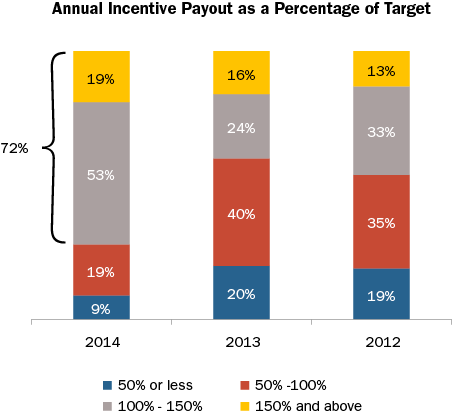
- More companies are paying above target bonuses for 2014 performance. 72% of companies had a payout at or above target versus 40% and 46% of companies in 2013 and 2012, respectively
- Companies with higher bonus payouts demonstrated correspondingly higher levels of financial performance, including stronger top-line growth and greater profitability
- Companies continue to shift a greater portion of total LTI into a performance-based vehicle although time-based stock options and restricted stock remain prevalent
- Performance-based long-term vehicles represent the largest portion of LTI with many companies incorporating TSR as a metric
Total Compensation
Among Early Filers with CEOs who held their position for at least two years (37 companies), actual total compensation in 2014 increased 15% from 2013. The increase in total pay was delivered mostly through the annual and long-term incentive awards, with median increases of 18% and 14% increases year over year, respectively.
|
Compensation Element |
% Increase at Median |
|
Base Salary |
1.5% |
|
Annual Incentive |
18% |
|
Total Cash |
9% |
|
Long-Term Incentive (LTI) |
14% |
|
Total Compensation |
15% |
Base Salary
Among the Early Filers, companies continue to provide modest salary increases to the NEOs. Salary increases for incumbent CEOs ranged from 0 – 5%. Approximately 50% of companies did not increase their CEO's salary in 2014.
Annual Incentive Compensation
2014 was a strong financial year for the Early Filers, reflected in 8.8% EPS growth at median and 15% TSR for the year. This resulted in higher annual incentive payouts compared to both 2013 and 2012. 72% of companies had a payout at or above target versus 40% and 46% of companies in 2013 and 2012, respectively.
The companies that paid a bonus at or above target had stronger financial performance than both the S&P 500 and all Early Filers. Higher performance among companies with higher bonus payouts was evident in all three financial metrics examined, including Revenue growth, Pre-tax Income growth and EPS growth. For example, median EPS growth for these higher performers was 13.3% (versus 9.9% among the S&P 500 and 8.8% among all 50 Early Filers). Higher performance for companies with above target bonus payouts demonstrates that pay and performance is well-aligned. One-year TSR performance (as of February 2015) was similar across all groups.
|
Financial Metric |
Median 1-Yr Performance |
||
|
S&P 500 |
All Early Filers (n=50) |
Companies with at or above target payout (n=36) |
|
|
Revenue Growth |
5.2% |
5.7% |
6.4% |
|
Pre-Tax Income Growth |
8.3% |
6.2% |
9.7% |
|
EPS Growth |
9.9% |
8.8% |
13.3% |
|
TSR |
15.7% |
15.2% |
15.2% |
Median annual incentive payout as a percentage of target for all Early Filers was 111% in 2014 which was higher than the median in both 2013 and 2012.
|
Summary Statistics |
Annual Incentive Payout as a % of Target |
||
|
2014 |
2013 |
2012 |
|
|
75th Percentile |
136% |
116% |
130% |
|
Median |
111% |
94% |
100% |
|
25th Percentile |
99% |
75% |
72% |
Although 2014 was a strong year, companies are continually refining their annual incentive plan to ensure executive pay is aligned with performance. Among companies in our study, 34% made changes to the annual incentive plan with a majority of companies making changes to annual incentive metrics.
The chart below illustrates all changes companies made to their annual incentive plan:
|
Type of Change Reported |
Companies Reporting Changes (n = 17) |
|
|
# of Cos. |
% of Cos. |
|
|
Change in performance metrics used to fund awards |
12 |
71% |
|
Change in performance metric weighting / mix |
4 |
24% |
|
Increased target annual incentive award opportunity (CEO and/or CFO) |
4 |
24% |
|
Other |
4 |
24% |
Note: Percentages add to greater than 100% due to multiple changes by select companies.
Long-Term Incentive Compensation
The use of time-based LTI (stock options and restricted stock) continues to be prevalent, yet performance-based LTI continues to play the strongest role in the overall LTI mix.
Approximately 50% of companies in our study made changes to their overall LTI program. Most changes involved the mix of vehicles, which continues the recent trend of increasing performance-based LTI and reducing the reliance on time-based long-term incentives. The table below indicates all changes made by the Early Filers:
|
Type of Change Reported |
Companies Reporting Changes (n = 26) |
|
|
# of Cos. |
% of Cos. |
|
|
Mix of LTI award vehicles |
11 |
42% |
|
Increased or reduced LTI award target opportunity level (CEO and/or CFO) |
8 |
31% |
|
Performance plan metric |
7 |
27% |
|
Add or eliminate LTI vehicle |
7 |
27% |
|
Vesting/performance period |
4 |
15% |
|
Other |
2 |
8% |
Note: Percentages add to greater than 100% due to multiple changes by select companies.
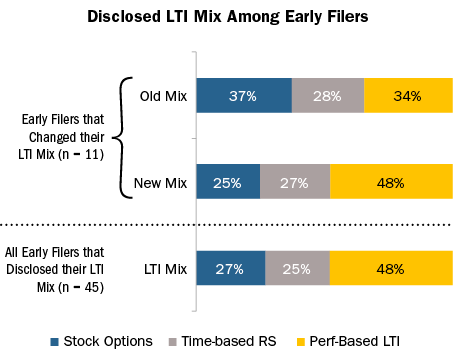
Among the companies that changed their LTI mix, most increased the emphasis on performance-based LTI while reducing stock option use. The portion of LTI awarded in the form of time-based restricted stock remained relatively unchanged. Overall, nearly 90% of companies use performance-based LTI, 74% use stock options and 62% use time-based restricted stock.
Among the Early Filers that grant performance-based LTI awards, approximately 60% use two or more metrics. The use of multiple metrics provides balance and rewards executives based on holistic performance.
Approximately two-third of companies use relative Total Shareholder Return ("TSR") as a performance metric. Companies incorporate TSR as a long-term incentive metric for multiple reasons including aligning with the shareholder experience, simplifying the goal-setting process and conforming to proxy advisory firms’ preference for TSR. Among the companies that use relative TSR as a standalone metric, it typically represents 25-50% of the total performance award. Some companies use financial performance (either absolute or relative) to fund the payout of the performance award and use relative TSR to modify the final payout, thereby incorporating it as an LTI metric but reducing its overall effect on payouts.
|
Weighting of TSR Metric in the LTI Plan (n = 28) |
Number of other LTI Metrics |
% of Companies |
|
25% |
1 – 2 |
11% |
|
50% |
1 |
29% |
|
Weighting not disclosed |
2 |
7% |
|
100% |
0 |
32% |
|
Modifier |
2 – 3 |
21% |
Say on Pay (SOP) Vote Results
In 2015, 98% of Early Filers that released SOP results this year received majority shareholder support; most companies (approximately 75%) received greater than 90% support. Compensation program design changes can and do improve Say on Pay results! Among the companies that made changes to either their annual or long-term incentive plan in 2014 (n = 29), 97% received majority shareholder support with approximately 70% receiving greater than 90% support. However, making a change to the incentive program design does not guarantee shareholder approval of the executive compensation program.
When fundamental problems with the compensation program exist – such as high pay levels or misalignment with performance – companies may fail the SOP vote. Additionally, poor SOP results can be attributed to shareholders expressing dissatisfaction with other aspects of the company’s business, its management or TSR performance.
Conclusion
2014 annual incentive payouts among the Early Filers were higher than 2013 which, when combined with the rise in LTI award levels, resulted in a 15% increase in total compensation. We saw a big increase in the number of companies with at or above target bonus payouts, as well as higher performance among these companies. Nearly 65% of companies use TSR as a long-term incentive metric, suggesting that companies are trying to enhance alignment between executive pay and shareholder experience.
Companies continue to make changes to their annual incentive and LTI plans, with a strong focus on enhancing the pay for performance relationship through modification of the annual incentive metrics and/or the long-term vehicle mix. Among companies that changed their LTI vehicle mix, they tended to increase the role of performance-based LTI. Our experience suggests these trends are consistent with the broader market practice. While changes to the incentive plan will likely lead to a favorable Say on Pay vote, companies should be aware of that other factors may affect the vote.


