

Compensation Advisory Partners (CAP) conducts an annual review of Chief Financial Officer (CFO) and Chief Executive Officer (CEO) pay. For the first time since we began our study in 2010, the median increase in CEO total direct compensation (5.2%) is higher than the median increase in CFO total direct compensation (3.2%). The increase in overall pay levels in 2013 was driven by improved financial results, a stronger stock market and recovering economy.
The increases that CAP observed in 2013 are much higher than seen last year. In 2012, our study showed almost no change in CEO compensation (-0.3% at median) and a very modest increase in CFO total direct compensation (1.4% at median).
Our findings indicate that the rate of increase in total direct compensation levels for both CEOs and CFOs accelerated in 2012-2013 compared to flat pay increases in 2011-2012. This increase suggests that the economic recovery is having an impact. The higher increase in 2013 among CEOs was driven by larger increases in actual bonuses paid for 2013 and slight increases in long-term incentives (LTI). The slower rate of growth in CFO compensation may signal a leveling off of CFO pay increases – which has been increasing at a faster rate than CEO pay since 2010. On an absolute basis, CFO total direct compensation continues to total approximately one-third of CEO total direct compensation.
Methodology
Our findings are based on a sample of 92 public companies. Similar to prior years, the study analyzes executive pay data disclosed by companies with revenues ranging from $1 to $130 billion, and median 2013 revenues of $8 billion. Only companies with the same CEO and CFO incumbents in the past three years are included allowing us to measure year-over-year changes for individual incumbents. In the past, we excluded financial services firms from the study, since this industry’s compensation practices were evolving in the years after the financial crisis. This year we expanded our sample to include financial services companies in our analysis, because we believe that compensation in the financial services industry has stabilized over the last couple of years.
Study Results
Salaries
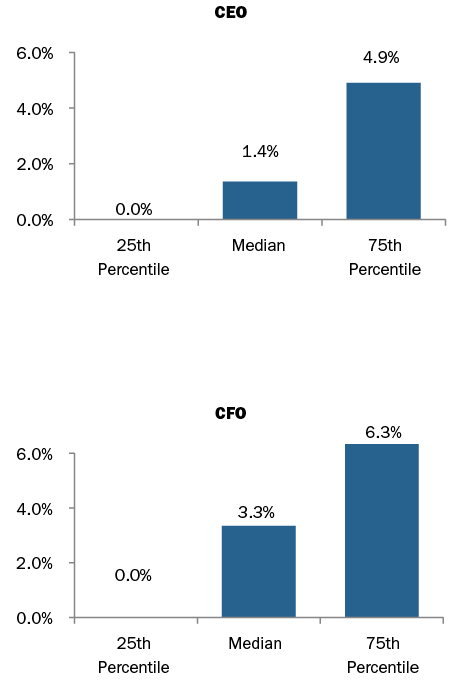
In 2013, approximately 73% of CFOs received salary increases compared to 85% in 2012. The median increase was 3.3% and the 75th percentile increase was 6.3%. In comparison, only 54% of CEOs received salary increases and the increases were smaller — 1.4% at median and 4.9% at the 75th percentile. The number of CEOs receiving a salary increase was similar to 2012. Less frequent and lower salary increases among CEOs may be explained by companies’ hesitancy to increase salaries beyond $1M.
|
% of Executives Receiving Salary Increases |
||||||
|
2010 – 2011 |
2011 – 2012 |
2012 – 2013 |
||||
|
No Increase |
Receiving Increase |
No Increase |
Receiving Increase |
No Increase |
Receiving Increase |
|
|
CEO |
34% |
66% |
47% |
53% |
46% |
54% |
|
CFO |
12% |
88% |
15% |
85% |
27% |
73% |
2013 Salary Increases
Actual Pay Levels
Our findings indicate that the rate of increase in total direct compensation levels for both CEOs and CFOs accelerated in 2012-2013 compared to flat pay increases in 2011-2012, supported by stronger performance in 2013. During 2012-2013, actual total direct compensation (salary plus actual annual incentive plus the grant date value of long-term incentives) for CEOs and CFOs increased by 5.2% and 3.2%, respectively. This year is the first year since 2010 that we see higher median increases in actual total direct compensation for the CEO versus the CFO. In addition to salary increases of 1-3%, annual bonuses were 4-5% higher at median and long-term incentives increased about 3% at median for both CEOs and CFOs.
Absolute CFO total direct compensation levels, on average, continue to be approximately 30% of CEO total direct compensation levels.
|
Median Percentage Change in Pay Components |
||||||
|
2010 – 2011 |
2011 – 2012 |
2012 – 2013 |
||||
|
Pay Components |
CEO |
CFO |
CEO |
CFO |
CEO |
CFO |
|
Salary |
1.8% |
3.5% |
0.5% |
3.0% |
1.4% |
3.3% |
|
Actual Bonus |
0.0% |
3.5% |
-2.8% |
-1.2% |
4.9% |
3.7% |
|
Long-Term Incentives |
10.0% |
10.3% |
0.0% |
2.0% |
3.2% |
3.3% |
|
Actual Total Direct Comp. |
3.6% |
7.5% |
-0.3% |
1.4% |
5.2% |
3.2% |
|
Financial Performance (Median Levels) |
|||
|
Year |
Total Shareholder Return (as of 12/31) |
1-Year Revenue Growth |
1-Year Net Income Growth |
|
2011 |
5% |
9% |
13% |
|
2012 |
14% |
3% |
2% |
|
2013 |
31% |
5% |
12% |
Since this was the first year financial services companies were included, we tested the results without financial services companies and found that the median increase in total direct compensation between the two data sets for CEOs and CFOs was within a 1% difference. However, total cash compensation yielded greater differences. For CFOs of non-financial services companies the median increase in total cash compensation was 1.9% vs. 4.6% median increase of the total sample. For CEOs the median increases were 3.1% vs. 4.2%, respectively. This is due to higher bonus payouts at financial services institutions in 2013.
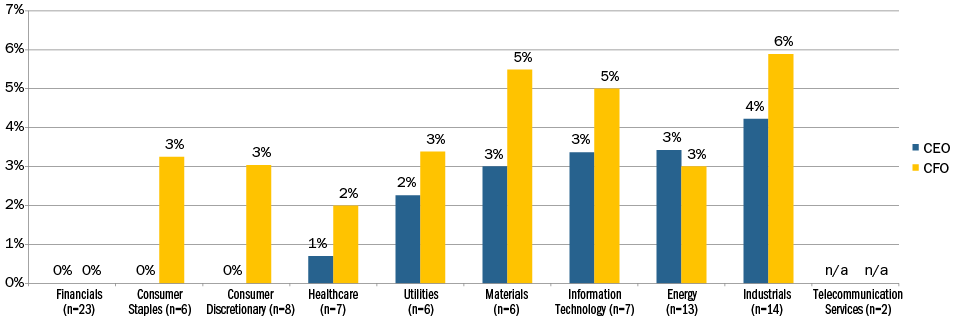
2013 Median Salary Increase by Industry
2013 Median Actual Total Direct Compensation Increase by Industry
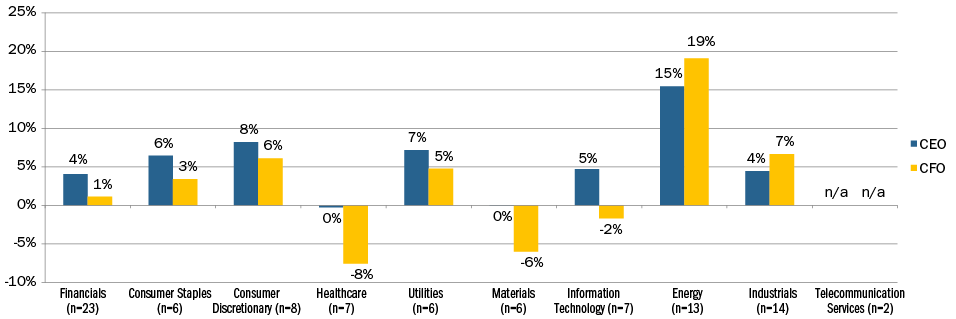
Our study breaks out 2013 CEO and CFO pay by industry classification (Financials, Consumer Staples, Consumer Discretionary, Healthcare, Utilities, Materials, Information Technology, Energy, Industrials, and Telecommunication Services). When looking at median increases in salary for both CEOs and CFOs, they tend to be in the range of 0-3%. Median salary increases over 3% occurred in the Materials and Information Technology industries for CFOs and in Industrials for both CEO and CFO. When looking at actual total direct compensation there is greater volatility in increases, which is primarily driven by industry and company performance.
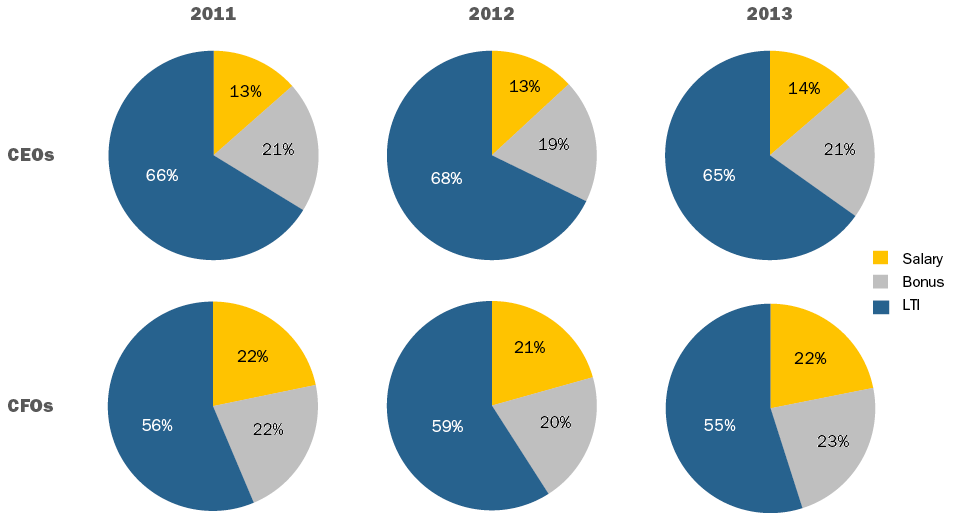
Target Pay Mix
In terms of target compensation levels, the overall pay mix remained largely unchanged from 2011 to 2013. We continue to observe a greater emphasis on at-risk pay for CEOs than for CFOs.
Long-Term Incentive (LTI) Vehicle Prevalence and Mix
LTI vehicle prevalence and mix trends have been fairly consistent over the past few years. The use of at least two long-term incentive vehicles continues to be the majority practice for CEOs and CFOs. The role of stock options has been decreasing slowly in the overall mix with companies delivering about 30% of LTI using this vehicle. On average, performance-based LTI continues to comprise approximately 50% of LTI for CEOs and CFOs. Data continues to show that about 80% of CFOs and CEOs receive some form of performance-based awards as part of their LTI program.
|
# of LTI Vehicles Used |
% in Total |
|
|
CEO |
CFO |
|
|
1 Vehicle |
25% |
27% |
|
2 Vehicles |
49% |
43% |
|
3 Vehicles |
26% |
30% |
|
Average |
2 |
2 |
|
LTI Mix |
2011 |
2012 |
2013 |
|||
|
CEO |
CFO |
CEO |
CFO |
CEO |
CFO |
|
|
Stock Options |
32% |
32% |
30% |
32% |
29% |
29% |
|
Time Vested Restricted Stock |
17% |
22% |
16% |
20% |
19% |
22% |
|
Perf. Based LTI |
51% |
46% |
53% |
48% |
53% |
49% |
Conclusion
Given the improved economy and strong stock market it is not surprising that CEO and CFO pay levels increased in 2013. The fact that CEO pay increased at a faster rate than CFOs for the first time in four years, implies that Compensation Committees are recognizing CEO performance as overall company performance improves. In the future, we expect continued pay-for-performance alignment with CEOs experiencing a greater impact on compensation for good and bad performance.


